. 2022 Aug;608(7921):98-107.
doi: 10.1038/s41586-022-04922-8. Epub 2022 Jul 6.

A time-resolved, multi-symbol molecular recorder via sequential genome editing

Affiliations

A time-resolved, multi-symbol molecular recorder via sequential genome editing

Junhong Choi et al. Nature. 2022 Aug.

Abstract

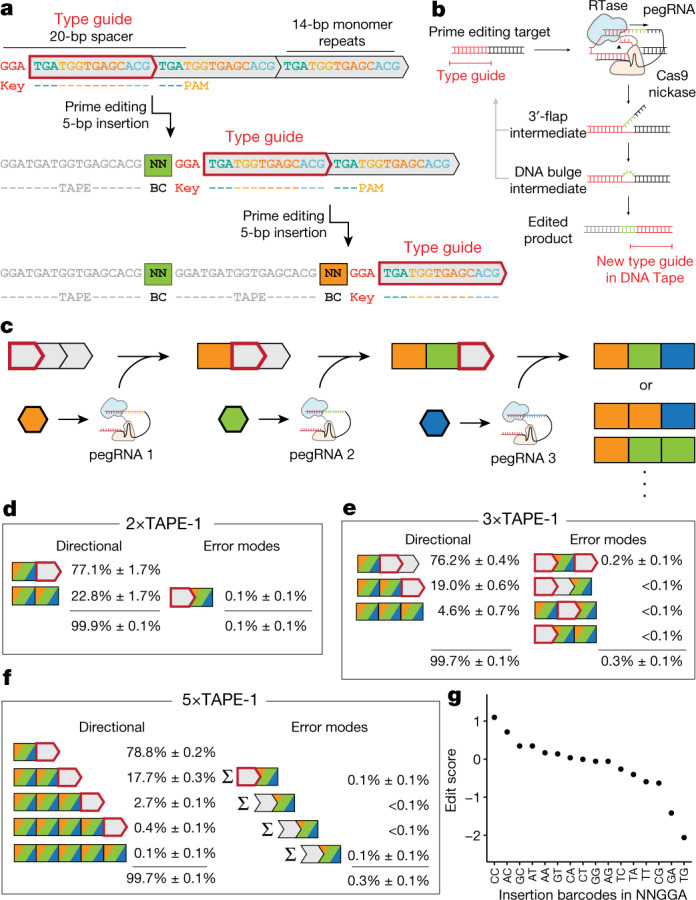
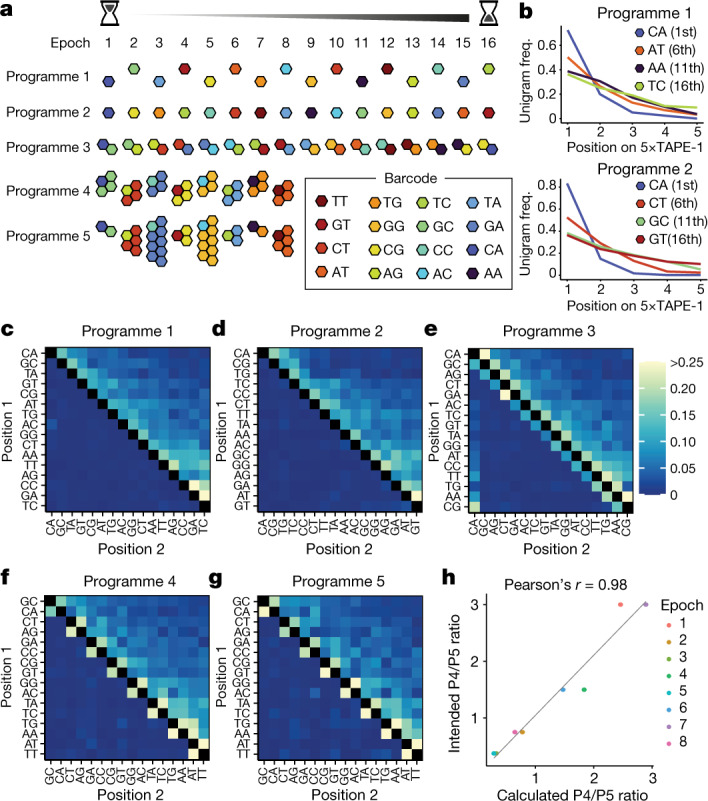
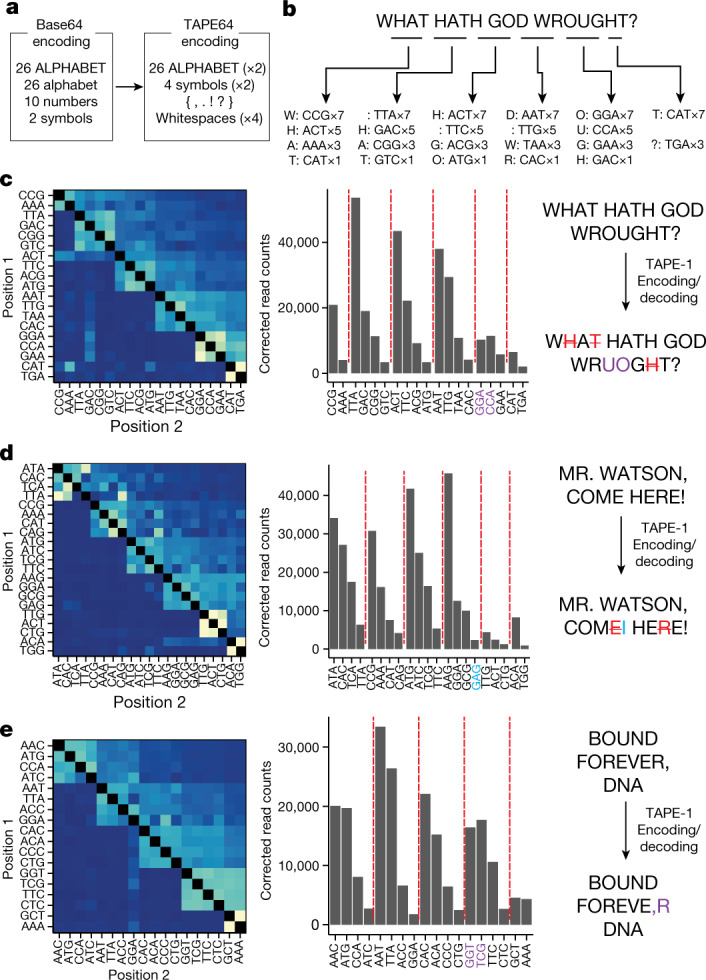
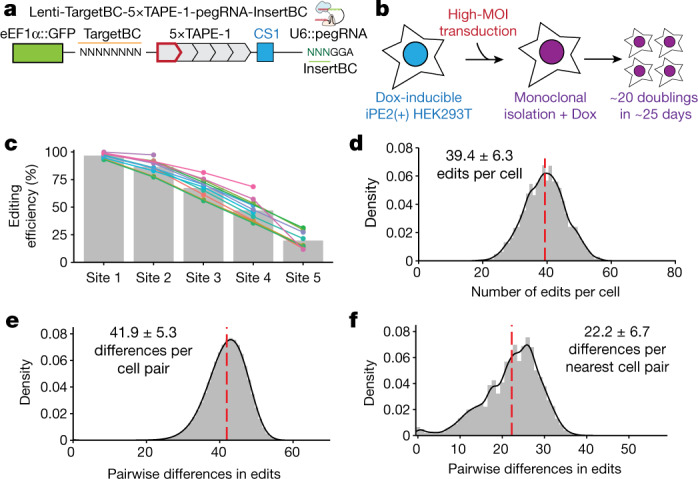
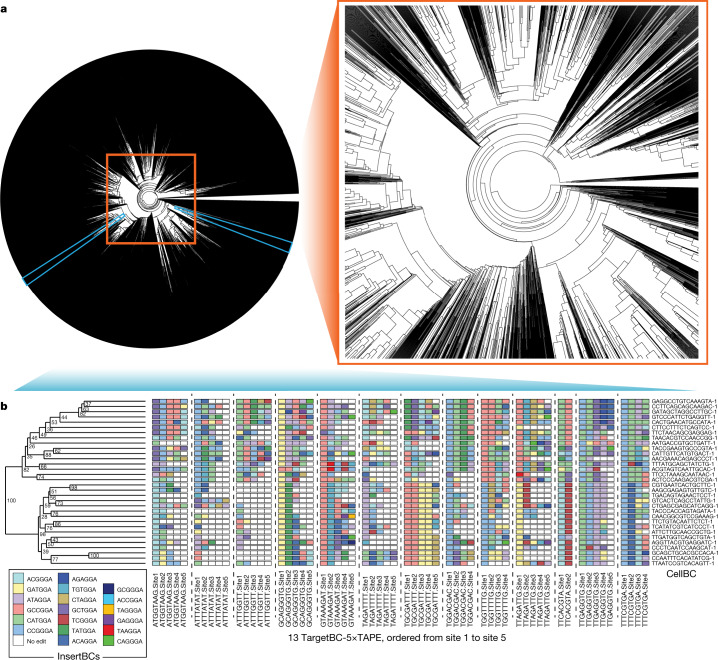
DNA is naturally well suited to serve as a digital medium for in vivo molecular recording. However, contemporary DNA-based memory devices are constrained in terms of the number of distinct 'symbols' that can be concurrently recorded and/or by a failure to capture the order in which events occur1. Here we describe DNA Typewriter, a general system for in vivo molecular recording that overcomes these and other limitations. For DNA Typewriter, the blank recording medium ('DNA Tape') consists of a tandem array of partial CRISPR-Cas9 target sites, with all but the first site truncated at their 5' ends and therefore inactive. Short insertional edits serve as symbols that record the identity of the prime editing guide RNA2 mediating the edit while also shifting the position of the 'type guide' by one unit along the DNA Tape, that is, sequential genome editing. In this proof of concept of DNA Typewriter, we demonstrate recording and decoding of thousands of symbols, complex event histories and short text messages; evaluate the performance of dozens of orthogonal tapes; and construct 'long tape' potentially capable of recording as many as 20 serial events. Finally, we leverage DNA Typewriter in conjunction with single-cell RNA-seq to reconstruct a monophyletic lineage of 3,257 cells and find that the Poisson-like accumulation of sequential edits to multicopy DNA tape can be maintained across at least 20 generations and 25 days of in vitro clonal expansion.


Conflict of interest statement

The University of Washington has filed a patent application partially based on this work in which J.C., W.C. and J.S. are listed as inventors. The remaining authors declare no competing interests.

Figures

Fig. 1
Fig. 1. Sequential genome editing with DNA Typewriter.
a, Schematic of two successive editing events at the type guide, which shifts in position with each editing event. The DNA Tape consists of a tandem array of CRISPR–Cas9 target sites (grey boxes), all but the first of which are truncated at their 5′ ends and therefore inactive. The 5-bp insertion includes a 2-bp pegRNA-specific barcode as well as a 3-bp key that activates the next monomer. Because genome editing is sequential in this scheme, the temporal order of recorded events can simply be read out by their physical order along the array. b, Schematic of prime editing with DNA Typewriter. Prime editing recognizes a CRISPR–Cas9 target and modifies it with the edit specified by the pegRNA. With DNA Typewriter, an insertional editing event generates a new prime editing target at the subsequent monomer. c, Schematic of ordered recording via DNA Typewriter. Individual pegRNAs are potentially event driven or constitutively expressed, together with the PE2 enzyme. df, Specificity of genome editing on versions of TAPE-1 with two (d), three (e) or five (f) monomers. Cells bearing stably integrated TAPE-1 target arrays were transfected with a pool of plasmids expressing pegRNAs and PE2. Each class of outcomes is inclusive of all possible NNGGA insertions; collectively, the classes shown include 2n – 1 possible outcomes, where n is the number of monomers. We observe that editing of any given target site is highly dependent on the preceding sites in the array having already been edited. g, Edit scores of 16 barcodes used in the experiment with 5×TAPE-1. Edit scores for each insertion are calculated as the log2-scaled ratio between the insertion frequencies and the abundances of pegRNAs in the plasmid pool, averaged over n = 3 transfection replicates.
Fig. 2
Fig. 2. Transfection programmes for 16 sequential epochs.
a, Schematic of five transfection programmes over 8 or 16 epochs. For programmes 1 and 2, pegRNAs with single barcodes were introduced in each epoch for 16 epochs.The specific orders aimed to maximize (programme 1) or minimize (programme 2) the edit distances between temporally adjacent transfections. For programme 3, pegRNAs with two different barcodes were introduced at a 1:1 ratio for 16 epochs, with one barcode always shared between adjacent epochs (and between epochs 1 and 16). For programmes 4 and 5, pegRNAs with two different barcodes were introduced either at a constant ratio (1:3) or at varying ratios in each epoch (1:1, 1:2, 1:4 or 1:8) for eight epochs, respectively. b, Barcode frequencies across five insertion sites in 5×TAPE-1 in programmes 1 and 2 following epoch 16. Barcodes introduced in early epochs are more frequently observed at the first site. cg, Bigram transition matrices for programmes 1 (c), 2 (d), 3 (e), 4 (f) and 5 (g). Barcodes are ordered from early (left/top) to late (right/bottom). h, Calculated versus intended relative frequencies between programmes 4 and 5. Programme ratios were calculated by combining sequencing reads from n = 3 independent transfection experiments.
Fig. 3
Fig. 3. Recording and decoding short digital text messages with DNA Typewriter.
a, Base64 binary-to-text was modified to assign 64 NNNGGA barcodes for TAPE-1 to 64 text characters. b, Illustration of the encoding strategy for “WHAT HATH GOD WROUGHT?”, which has 22 characters including whitespaces. The message is grouped into sets of four characters, converted to NNN barcodes according to the TAPE64 encoding table, and plasmids corresponding to each set are mixed at a ratio of 7:5:3:1 for transfection. To encode 22 characters, we sequentially transfected 5 sets of 4 characters and 1 set of 2 characters 3 days apart into PE2(+) 5×TAPE-1(+) HEK293T cells. ce, Decoding of three messages based on sequencing of the following 5×TAPE-1 arrays: “WHAT HATH GOD WROUGHT?” (c), “MR. WATSON, COME HERE!” (d) and “BOUND FOREVER, DNA” (e). For each message, the full set of NNNGGA insertions was first identified and cotransfected sets of characters were then identified from the bigram transition matrix (left). Within each set of characters inferred to have been cotransfected, ordering was based on corrected unigram counts (middle), resulting in the final decoded message (right). Misordered characters within each recovered message are coloured purple, missing characters are coloured red with strikethrough, and unintended characters are coloured light blue. Both two-dimensional histogram and corrected read counts were calculated by combining sequencing reads over n = 3 independent transfection experiments. Read counts were corrected using the edit score for each insertion barcode.
Fig. 4
Fig. 4. Reconstruction of a monophyletic cell lineage tree using DNA Typewriter and scRNA-seq.
a, Schematic of the lentiviral vector used in the DNA Typewriter-based lineage tracing experiment. The integration cassette includes a 5×TAPE-1 sequence associated with an 8-bp random barcode (TargetBC) and a pegRNA expression cassette. The pegRNA targets TAPE-1 and inserts 6 bp, in which the first 3 bp is the random barcode (InsertBC) and the last 3 bp is the key sequence of GGA for TAPE-1. Each TargetBC-5×TAPE-1 array is embedded in the 3′ UTR of the eGFP gene with an RNA capture sequence at its 3′ end and transcribed from the eEF1α promoter. b, Schematic of the monophyletic lineage tracing experiment. A HEK293T line with Dox-inducible PE2 expression was transfected with the lentiviral construct shown in a at a high MOI. A monoclonal line was then established and expanded in the presence of Dox. During expansion, pegRNAs expressed by TargetBC-defined integrants compete to mediate insertions at the type guides of TAPE-1 arrays within the same cell. c, Cumulative editing of each site within TAPE-1. Each coloured line shows the cumulative editing rate for 1 of 13 TargetBCs. Grey bars denote the cumulative editing of TAPE-1 sites across all 13 independent TargetBCs within the n = 1 single-cell experiment. d, Histogram of the number of edits across 59 editable sites in each cell. The red dashed line denotes the average. e, Histogram of the number of differences across the 59 editable sites for all possible pairs of the 3,257 sampled cells. The red dashed line denotes the average. f, Distribution of the number of pairwise differences between each cell and its ‘nearest neighbour’ among the 3,257 sampled cells.
Fig. 5
Fig. 5. Reconstruction of a monophyletic cell lineage tree using DNA Typewriter.
a, A monophyletic lineage tree of the 3,257 cells with all 13 TargetBC Tape arrays recovered. The UPGMA clustering method was used to construct the tree from a distance matrix that takes into account the order of edits within the TAPE-1 arrays, by discounting matches for which earlier sites along the same DNA Tape were not also identically edited. b, A lineage tree constructed by order-aware UPGMA for a subset of 32 cells drawn from the larger tree, specifically the two 16-cell clades marked with light blue in the circular tree. Numbers next to branching points denote bootstrap values out of 100 resamplings. The 59 sites of the 13 TargetBC-associated Tape arrays are represented to the right, with InsertBCs coloured by edit identity. Cells are identified by the 16-bp CellBCs (10x Chromium v3 chemistry) listed on the far right. A higher-resolution version of the entire tree of 3,257 cells in the same format is provided in Supplementary Fig. 1.
Extended Data Fig. 1
Extended Data Fig. 1. The relative insertional frequencies of k-mers to DNA Tape are determined by relative pegRNA abundances as well as by insertion-dependent sequence bias.
a. Conditional, site-specific editing efficiencies across 3 sites within the 3xTAPE-1 or 5 sites within the 5xTAPE-1, calculated as the number of reads that contain an edit in the indicated site over the total number of reads that contain an edit in the immediately preceding site, which activates the indicated site as a target for editing. The number of all 5xTAPE-1 (or 3xTAPE-1) reads were used for calculating the site-specific editing efficiency for the Site-1, which is activated by its own key sequence. The center and error bars are mean and standard deviations, respectively, from n = 2 transfection replicates for the second plot from the left and n = 3 transfection replicates for the other 3 plots. b. Pairwise scatterplots of unigram frequencies of NNGGA insertions at the initiating monomer of 5xTAPE-1 among three transfection replicates. c. Scatterplot of unigram frequencies, averaged across three transfection replicates, at the initiating vs. second monomer of 5xTAPE-1. d. Scatterplot of averaged unigram frequencies at the initiating monomer in “pre-cloning pooling” experiment vs. the abundances of NNGGA pegRNA-expressing plasmids (left). Insertional bias was corrected for with data from a separate experiment using NNGGA pegRNA-expressing plasmids that were pooled post-cloning, resulting in a better correlation with the abundances of pegRNAs in the plasmid pool (right). Corrections were done by dividing pre-cloning unigram frequencies by post-cloning unigram frequencies at the initiating monomer and multiplying by post-cloning pegRNA plasmid frequencies. e. Scatterplot of NNGGA edit scores calculated on the initiating monomer of the 5xTAPE-1 target edited by pegRNA-expressing plasmids pooled pre-cloning vs. post-cloning. Edit scores for each insertion are calculated as log2 of the ratio between insertion frequencies and the abundances of pegRNAs in the plasmid pool. Spearman’s p was used instead of Pearson’s r. f. Scatterplot of averaged unigram frequencies at the initiating monomer in “post-cloning pooling” experiment vs. the abundances of NNGGA pegRNA-expressing plasmids (left). Correcting for insertional bias with pre-cloning unigram frequencies improves the correlation (right).
Extended Data Fig. 2
Extended Data Fig. 2. Enhancements of prime editing facilitate DNA Typewriter’s range and efficiency.
a. Editing efficiencies at the first site of 5xTAPE-1 integrated in HEK293T cells. A pool of plasmids expressing TAPE-1 targeting epegRNAs were transfected with the pCMV-PEmax-P2A-hMLH1dn plasmid. Five pools with different insertion lengths ranging from 5-bp (NNGGA) to 9-bp (NNNNNNGGA or 6N+GGA) were tested separately. The center and error bars are mean and standard deviations, respectively, from n = 3 transfection replicates. b. Scatterplot of 16 NNGGA edit scores with pegRNAs vs. epegRNAs. c. Edit scores for 16 NNGGA insertions with epegRNA. Edit scores for each insertion are calculated as log2 of the ratio between insertion frequencies and the abundances of pegRNAs in the plasmid pool. d. Scatterplot of 64 NNNGGA edit scores with pegRNAs vs. epegRNAs. e. Edit scores for 64 NNNGGA insertions with epegRNAs. f. Knee plot of read-counts for 4,096 possible 6N+GGA insertions, across three replicates. A minimum threshold of requiring at least 20 reads for a given insertion in each of the three transfection replicates was determined based on this plot. g. Knee plot of read-counts for 4,096 possible 6N+GGA-inserting pegRNAs from the pool of plasmids. A minimum threshold of 30 reads for each insertion plasmid was determined based on this plot. h. Edit scores for 1,908 6N+GGA insertions. Only insertions that appeared more than 20 reads in each of three transfection replicates and more than 30 reads in the sequencing of the plasmid pool were considered. Edit scores for each insertion are calculated as log2 of the ratio between insertion frequencies and the abundances of pegRNAs in the plasmid pool. i. Top 25 edit scores for 6N+GGA insertions. j. Editing efficiencies at the first site of 5xTAPE-1 integrated in the mouse embryonic fibroblasts (MEFs) or mouse embryonic stem cells (mESCs). For mESCs, up to two sequential transfections of a pool of epegRNA-expressing plasmids were tested. The error bars are standard deviations from n = 3 transfection replicates. k,l. Scatterplot of 16 NNGGA (k) and 64 NNNGGA (l) edit scores with epegRNAs in mESCs vs. HEK293T cells. Edit scores were calculated after one transfection (left) or two serial transfections (right) of the same pool of pCMV-PEmax-P2A-hMLH1dn/U6-epegRNA plasmids. The edit score calculated with two serial transfections showed higher correlations (Spearman’s p) with the edit score measured in HEK293Ts, probably due to better coverage of the insertion pools. Edit scores shown in this figure are calculated by combining sequencing data across n = 3 transfection replicate experiments.
Extended Data Fig. 3
Extended Data Fig. 3. Characterising diverse DNA Tape designs for efficiency and directional accuracy.
a. Deriving 48 TAPE designs from the eight basal CRISPR spacer sequences that previously demonstrated reasonable prime editing efficiencies,, via six distinct sequence shuffling procedures. b. Efficiency (fraction of edited reads out of all reads) vs. sequential error rate (fraction of edited reads inconsistent with sequential, directional editing out of all edited reads) for 48 3xTAPE constructs on episomal DNA (left) and piggyBAC transposon integrated DNA (right). Both horizontal and vertical error bars are standard deviations from n = 3 transfection replicates. c. Boxplots of the efficiencies and sequential error rates of 3xTAPE constructs derived from 8 basal sequences for each of 6 design procedures. Each data point is either mean efficiencies or mean sequential error rates over n = 3 independent transfection experiments with 8 basal sequences in each experiment. In general, a longer key sequence was associated with a lower error rate, while a longer insertion did not appreciably impact efficiency (e.g. NNGGAC with Design-6 vs. NNGA with Design-5). d. Boxplots of sequential error rates (left) and efficiencies (right) of 3xTAPE constructs grouped by their basal CRISPR target sequences. Each data point is either mean efficiencies or mean sequential error rates over n = 3 independent transfection experiments with 6 design procedures in each experiment. Boxplot elements in c,d represent: Thick horizontal lines, median; upper and lower box edges, first and third quartiles, respectively; whiskers, 1.5 times the interquartile range; circles, outliers. e. Correlation between the sequential error rate (left) and editing efficiency (right) of each 3xTAPE construct either in the context of episomal DNA vs. integrated DNA. Each data point is both mean efficiencies and mean sequential error rates over n = 3 independent transfection experiments with 48 designs in each experiment.
Extended Data Fig. 4
Extended Data Fig. 4. Inferred event order and magnitude from sequential transfections.
a. Sequential editing efficiency and sum of sequential errors from five sites in 5xTAPE-1 across 16 transfection epochs of Program-1. b. Repeat-length change of 5xTAPE-1 array sampled over 16 transfection epochs. c. For each of the five transfection programs, the event orders are inferred using “Unigram” (top) and “Bigram” (bottom) information. d. Undersampling analysis of Program-1. From the original 277,397 sequencing reads used for Program-1, we undersampled to 10,000, 2,500, 2,000, 1,500, or 1,000 reads. For each sampling point, the bigram transition matrix (top) was plotted and order of events (bottom) were inferred using bigram information. In c,d, sequencing reads from n = 3 independent transfection experiments are combined. e,f. For Program-4 (e) and Program-5 (f), the absolute barcode read counts (left) are corrected based on the edit score of 16 NNGGA barcodes (middle), and used to calculate the relative magnitude of two co-transfected barcodes (right). The expected barcode ratios are marked with a red “X” mark in each epoch. The center and error bars in panels (a), (b), (e), and (f) are mean and standard deviations, respectively, from n = 3 transfection replicates.
Extended Data Fig. 5
Extended Data Fig. 5. Inferring the barcode overlap in each message.
a. Hierarchical clustering analyses of identified unigram barcodes based on the bigram matrices. For each message, the normalised bigram matrix was converted to a distance matrix using the euclidean distance measure. The resulting distance matrix was then used for clustering 3-mer barcodes using the complete-linkage clustering method, resulting in a cluster dendrogram for each message. Based on these dendrograms, groups of 2 to 4 barcodes were manually grouped as putative co-transfection sets, and ordered within the set based on unigram frequencies. Sets were ordered relative to one another using the normalised bigram matrix, following the sorting algorithm described in the text. b. Undersampling analysis of the short text “WHAT HATH GOD WROUGHT?”. From the original 1,256,996 sequencing reads, we undersampled to 4 sampling points: 1,000,000, 100,000, 10,000, and 5,000 reads. For each sampling point, the bigram transition matrix (top), the corrected unigram counts (middle), and the hierarchical clustering (bottom) were plotted. From these, the original short text was inferred at the end. Both 2D histogram and corrected read counts are calculated by summing the sequencing reads over n = 3 independent transfection experiments. Read counts are corrected using the edit score for each insertion barcode.
Extended Data Fig. 6
Extended Data Fig. 6. Characterising the monoclonal lineage tracing experiment.
a. Cell doubling times measured for HEK293T and the monoclonal lineage tracing cell line (iPE2(+) LT(+)), with or without Doxycycline (Dox). The presence of Dox lengthened the cell doubling time, possibly negatively affecting the cell physiology. P values were obtained using the two-tailed Student’s t-test with Bonferroni correction: only *P < 0.05 are shown. The center and error bars are mean and standard deviations, respectively, from n = 3 independent experiments. b. Determining a set of valid TargetBCs based on frequencies. The Y-axis is on a log10-scale. Recovered TargetBCs were first ranked by their read counts to estimate multiplicity of infection (MOI) (left). Any additional TargetBCs that are 1-bp Hamming distance away from the set of 19 were corrected. We then retained 3,257 cells for which we recovered 13 of the most frequent TargetBCs (excluding one tape sequence with a corrupted type-guide) for lineage analysis (right). c. Read counts of InsertBCs observed in TAPE-1 arrays. The Y-axis is on a log10-scale. For the 3,257 selected cells, we additionally required that all observed edits were amongst the 19 most frequent InsertBCs in the overall dataset, as we presume this to be the valid set of pegRNA-defined insertional edits. d. Characterization of indel error rates of prime editing on TargetBC-5xTAPE-1 arrays. The Y-axis is on a log10-scale. Correct length insertions with prime editing are > 100-fold more likely than an insertion of a different length product. Furthermore, some of the apparent longer insertions are likely to correspond to a contraction of TAPE-1 monomer within 5xTAPE-1 before the integration, such as contraction of TGATGGTGAGCACG TAPE-1 monomer to the observed TGAGCACG 8-bp sequence appearing between two TAPE-1 monomers. e. Characterization of substitution error rates during prime editing-mediated insertion of the GGA key sequence on TargetBC-5xTAPE-1 arrays. The X-axis is on a log10-scale. Correct insertions are > 100-fold more likely than insertions with substitution errors. The most frequent class of errors are transition errors, and these may be occurring during PCR amplification or sequencing-by-synthesis of cDNA amplicons, rather than during prime editing. Data in panel (b) to (e) is generated from n = 1 monoclonal lineage experiment, followed by n = 1 single-cell RNA-seq data collection. f. A lineage tree constructed by order-aware UPGMA for a clade of 81 cells drawn from the larger tree. Numbers next to branching points denote bootstrap values out of 100 resamplings. The 59 sites of 13 TargetBC-associated tape arrays are represented to the right, with InsertBCs colored by edit identity. Cells are identified by the 16-bp CellBCs (10X Chromium v3 chemistry) listed on the far right.
Extended Data Fig. 7
Extended Data Fig. 7. Editing and recovering longer TAPE arrays.
a-b. Sanger sequencing traces for cloned (a) 12xTAPE-1 and (b) 20xTAPE-1 constructs. Each TAPE-array includes the 3-bp key sequence (GGA for TAPE-1), 12 or 20 repeats of 14-bp TAPE-1 monomer, and a 11-bp partial TAPE-1 monomer to serve as a prime-editing homology sequence for the last editing site. Nucleotides A, C, G, and T, in Sanger sequencing traces are colored green, blue, black, and red, respectively. Grey bars in the background are proportional to quality (Phred-scale) for each base call. c-h. Integration, editing, and recovery of 12x and 20xTAPE-1 arrays. Each construct was integrated into PE2(+) 3N-TAPE-1-pegRNA(+) HEK293T cell line in triplicate, cultured for 40 days for prolonged editing, and recovered via PCR and long-read sequencing on the PacBio platform. Circular consensus sequencing (CCS) reads that had at least 3 NNNGGA insertions and no small indel errors were grouped based on the site of integration (using 8-bp TargetBC barcodes), and a read with the maximum number of TAPE-1 monomers (and within that set, the read with the maximum number of edits) was selected per TargetBC. c. Histogram of the number of TAPE-1 monomers recovered from ~12xTAPE-1 (top) and ~20xTAPE-1 (bottom) integrants. d. Histogram of number of edits recovered from ~12xTAPE-1 (top) and ~20xTAPE-1 (bottom) integrants. e. For TargetBC groups with a given maximum number of TAPE-1 monomers (X-axis), we show the mean proportion with the same number of monomers as the maximum (Y-axis), for both 12xTAPE-1 (red) and 20xTAPE-1 (blue) integrants. We conclude from this that shorter arrays are more stable, and that the length-dependent stability is consistent between the two experiments. f. Similar to (e), but showing the full distribution of monomer lengths (Y-axis) for each TargetBC group with a given maximum number of TAPE-1 monomers (X-axis), for both ~12xTAPE-1 (red) and ~20xTAPE-1 (blue) integrants. The size of dots are proportional to these proportions. Data shown in panels (c) to (f) are generated by combining sequencing reads from n = 3 transfection replicate experiments. g,h. Recovery of (g) ~12x-TAPE-1 and (h) ~20x-TAPE-1 arrays after prolonged editing. Edited portions of each TAPE-array are colored red and overwhelmingly exhibit sequential editing. Very rarely, we observe instances of non-sequential editing, e.g. internal monomers that are edited. These are marked with asterisks below the corresponding column.

Comment in

  • DNA Typewriter.
    Minton K. Minton K. Nat Rev Genet. 2022 Sep;23(9):521. doi: 10.1038/s41576-022-00523-3. Nat Rev Genet. 2022. PMID: 35869289 No abstract available.

References

    1. Sheth RU, Wang HH. DNA-based memory devices for recording cellular events. Nat. Rev. Genet. 2018;19:718–732. doi: 10.1038/s41576-018-0052-8. - DOI - PMC - PubMed
    1. Anzalone AV, et al. Search-and-replace genome editing without double-strand breaks or donor DNA. Nature. 2019;576:149–157. doi: 10.1038/s41586-019-1711-4. - DOI - PMC - PubMed
    1. Church, G. & Shendure, J. Nucleic acid memory device. US patent US20100099080A1 (2003).
    1. Roquet N, Soleimany AP, Ferris AC, Aaronson S, Lu TK. Synthetic recombinase-based state machines in living cells. Science. 2016;353:aad8559. doi: 10.1126/science.aad8559. - DOI - PubMed
    1. Farzadfard F, Lu TK. Genomically encoded analog memory with precise in vivo DNA writing in living cell populations. Science. 2014;346:1256272. doi: 10.1126/science.1256272. - DOI - PMC - PubMed