. 2022 Jul;607(7919):527-533.
doi: 10.1038/s41586-022-04912-w. Epub 2022 Jul 6.

Molecular landscapes of human hippocampal immature neurons across lifespan

Affiliations

Molecular landscapes of human hippocampal immature neurons across lifespan

Yi Zhou et al. Nature. 2022 Jul.

Abstract

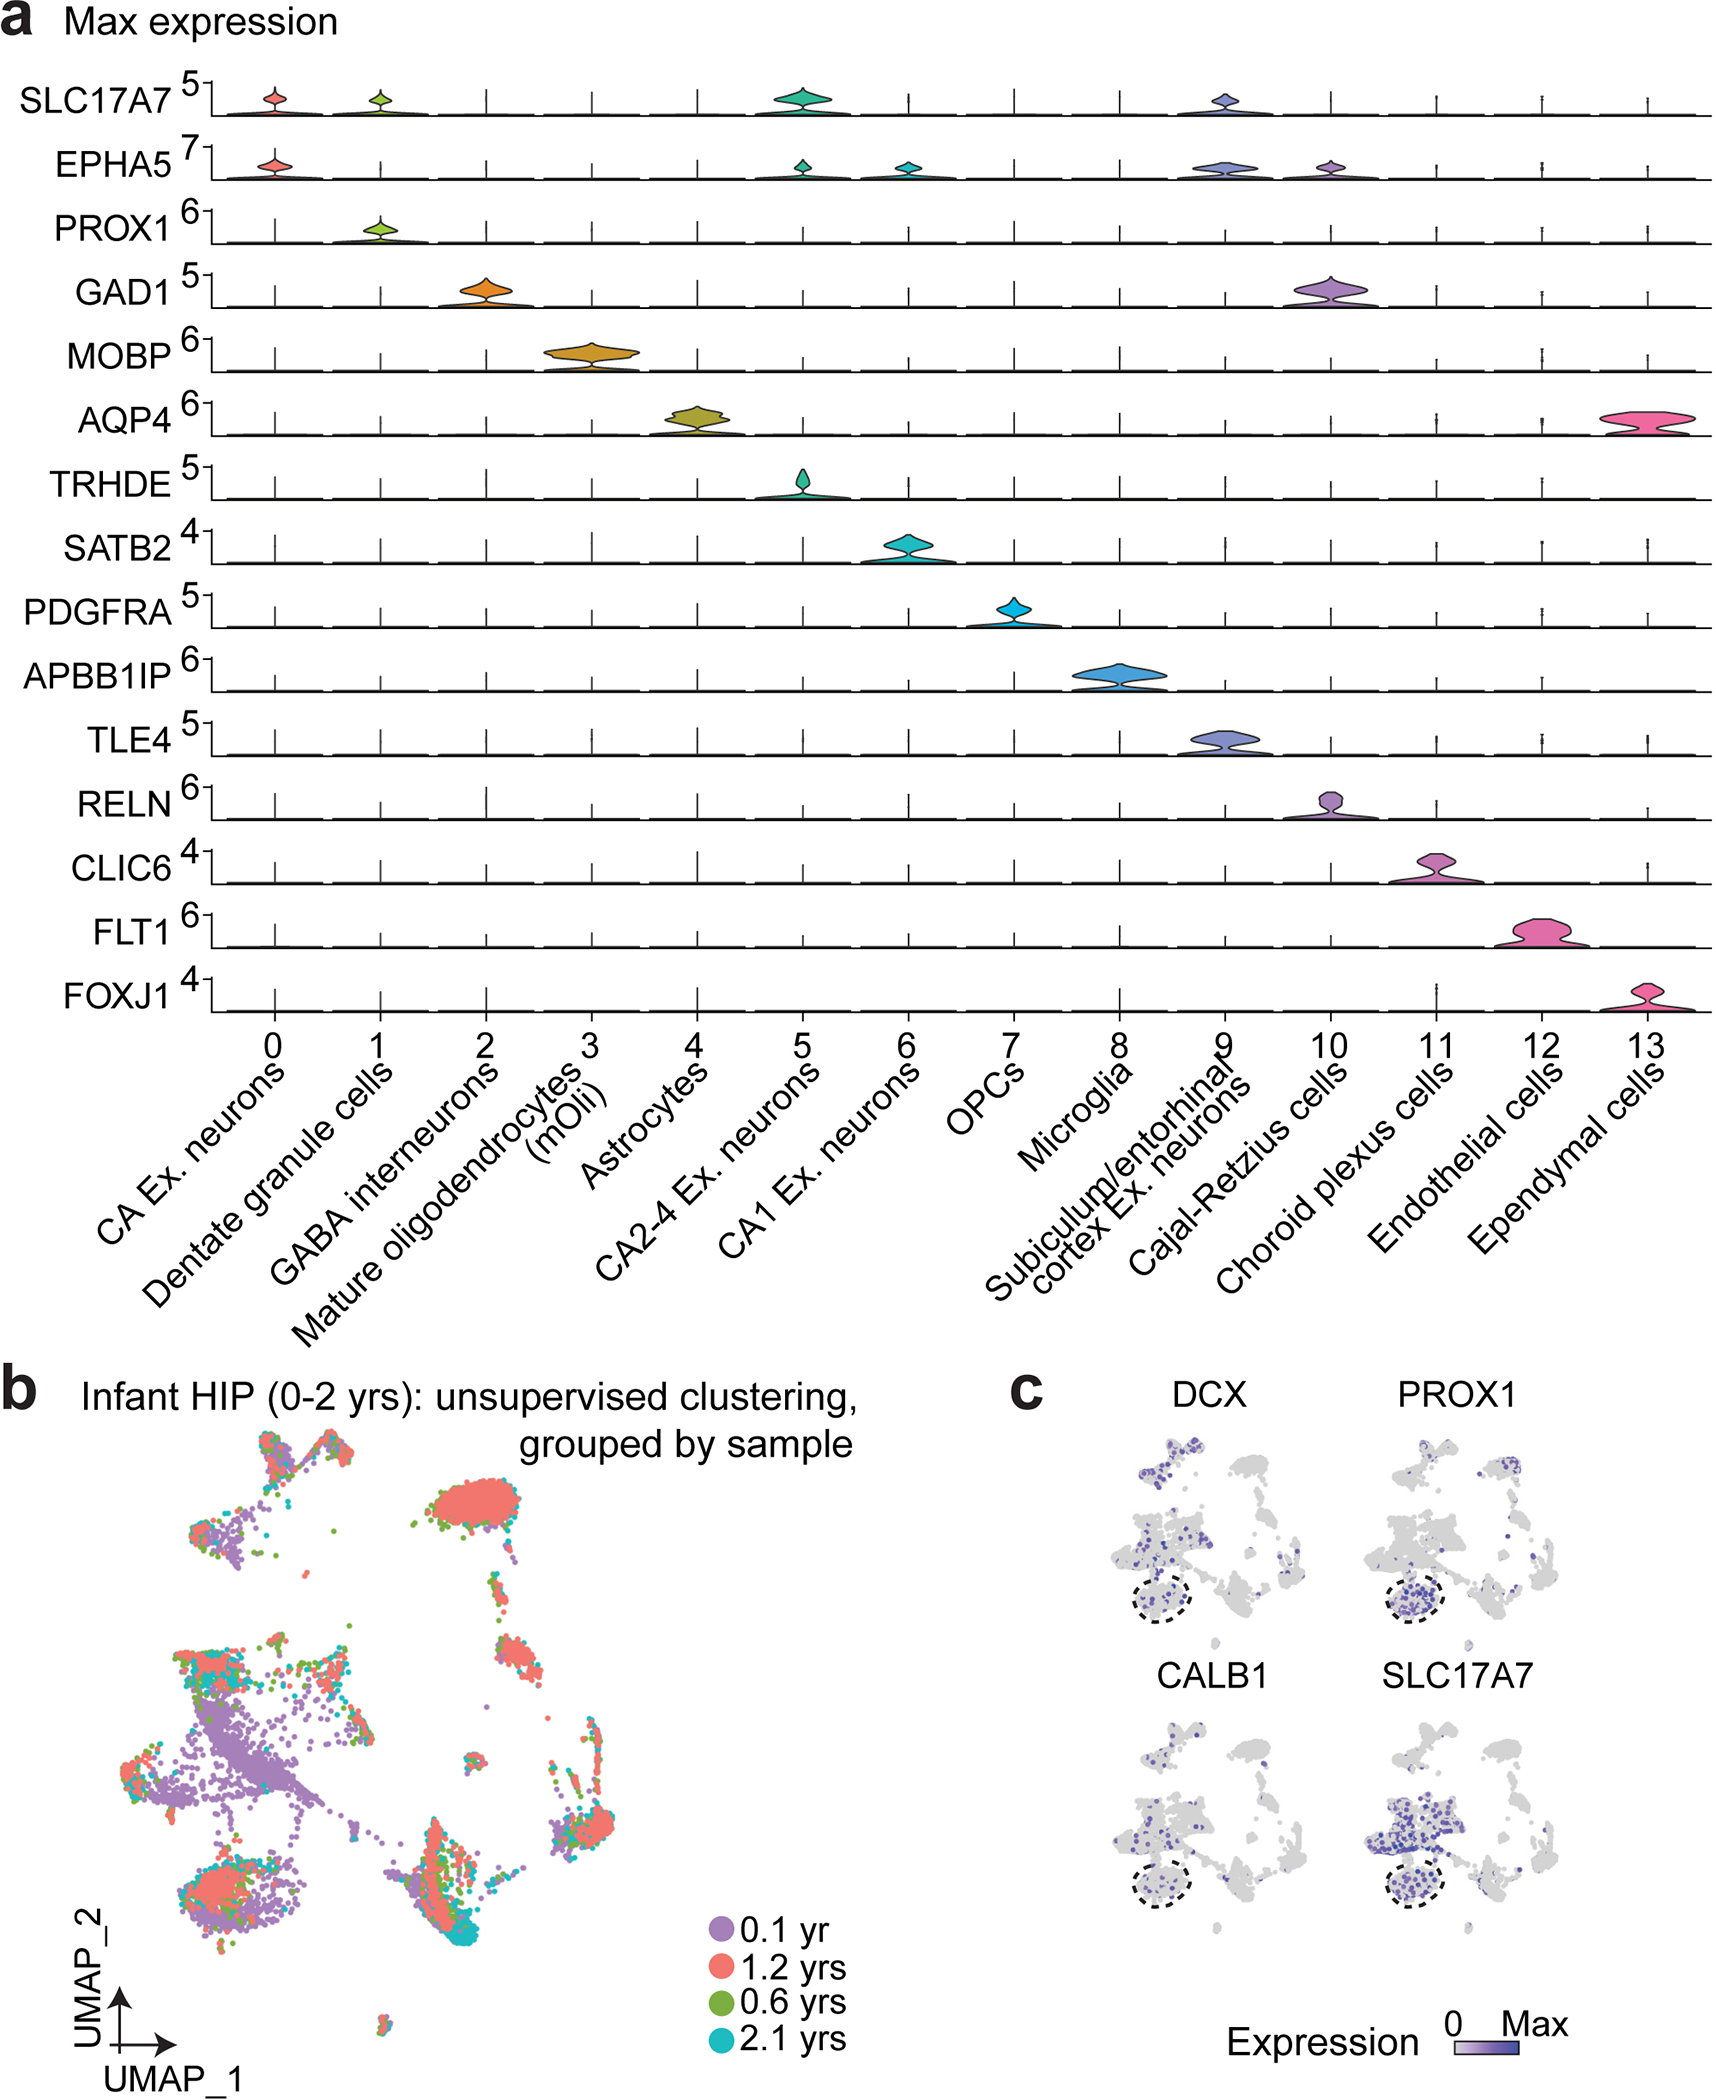
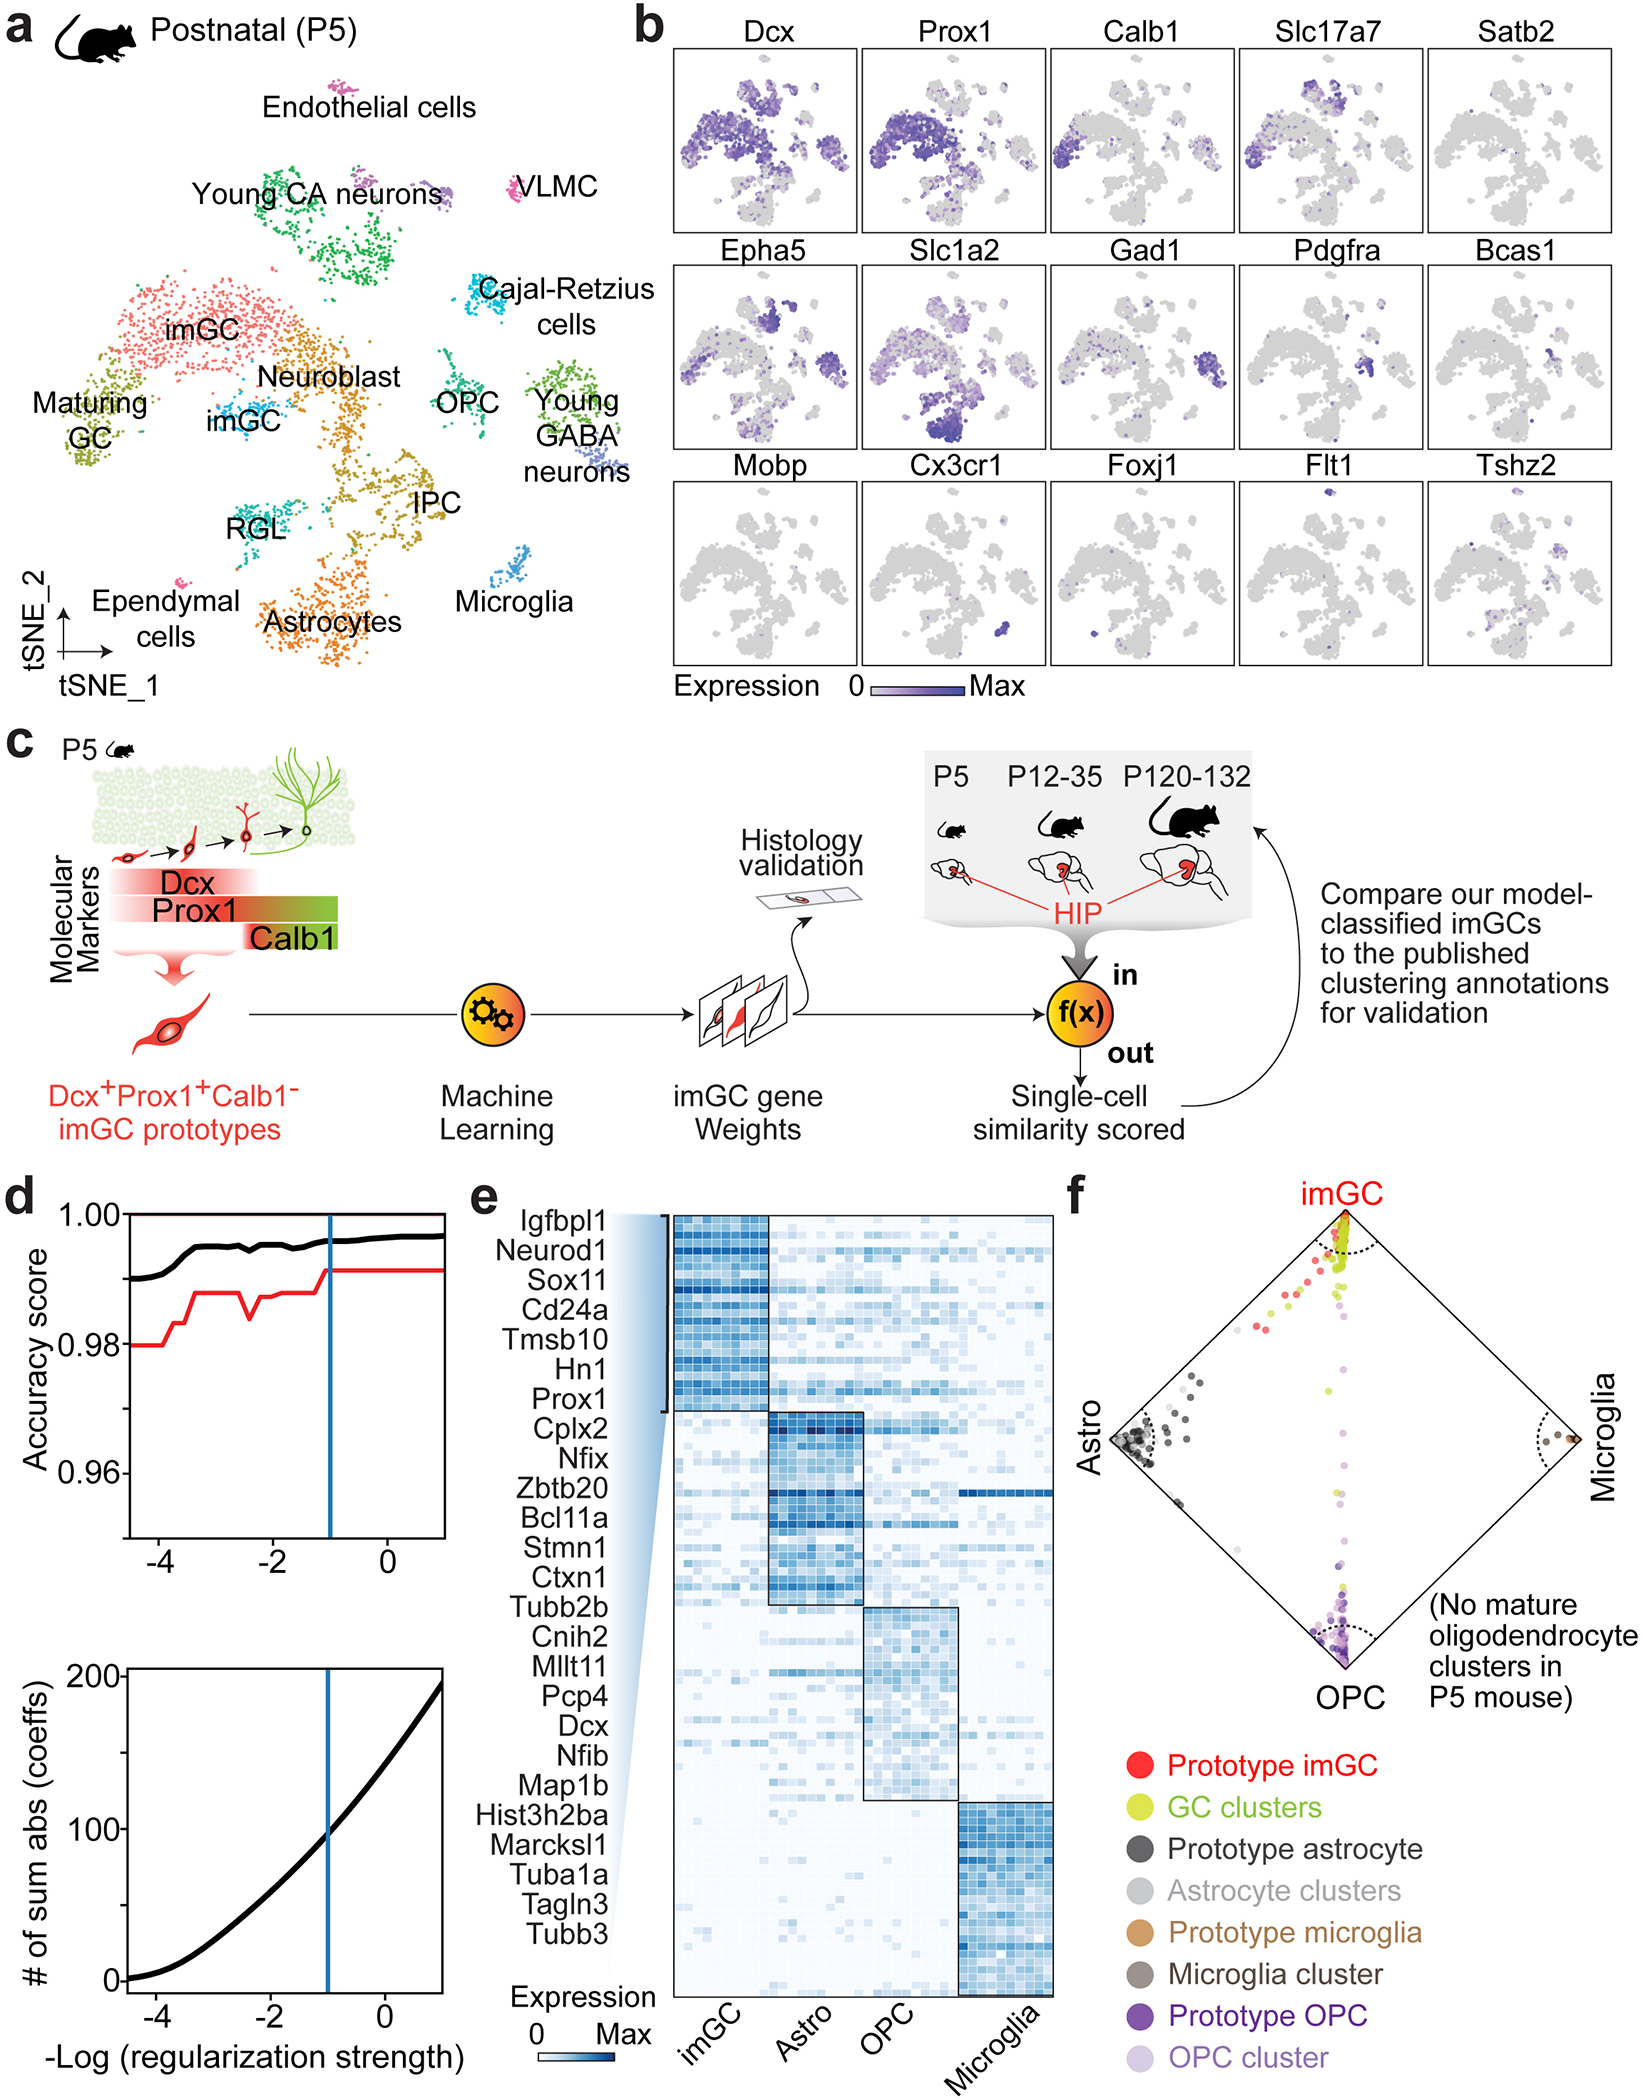
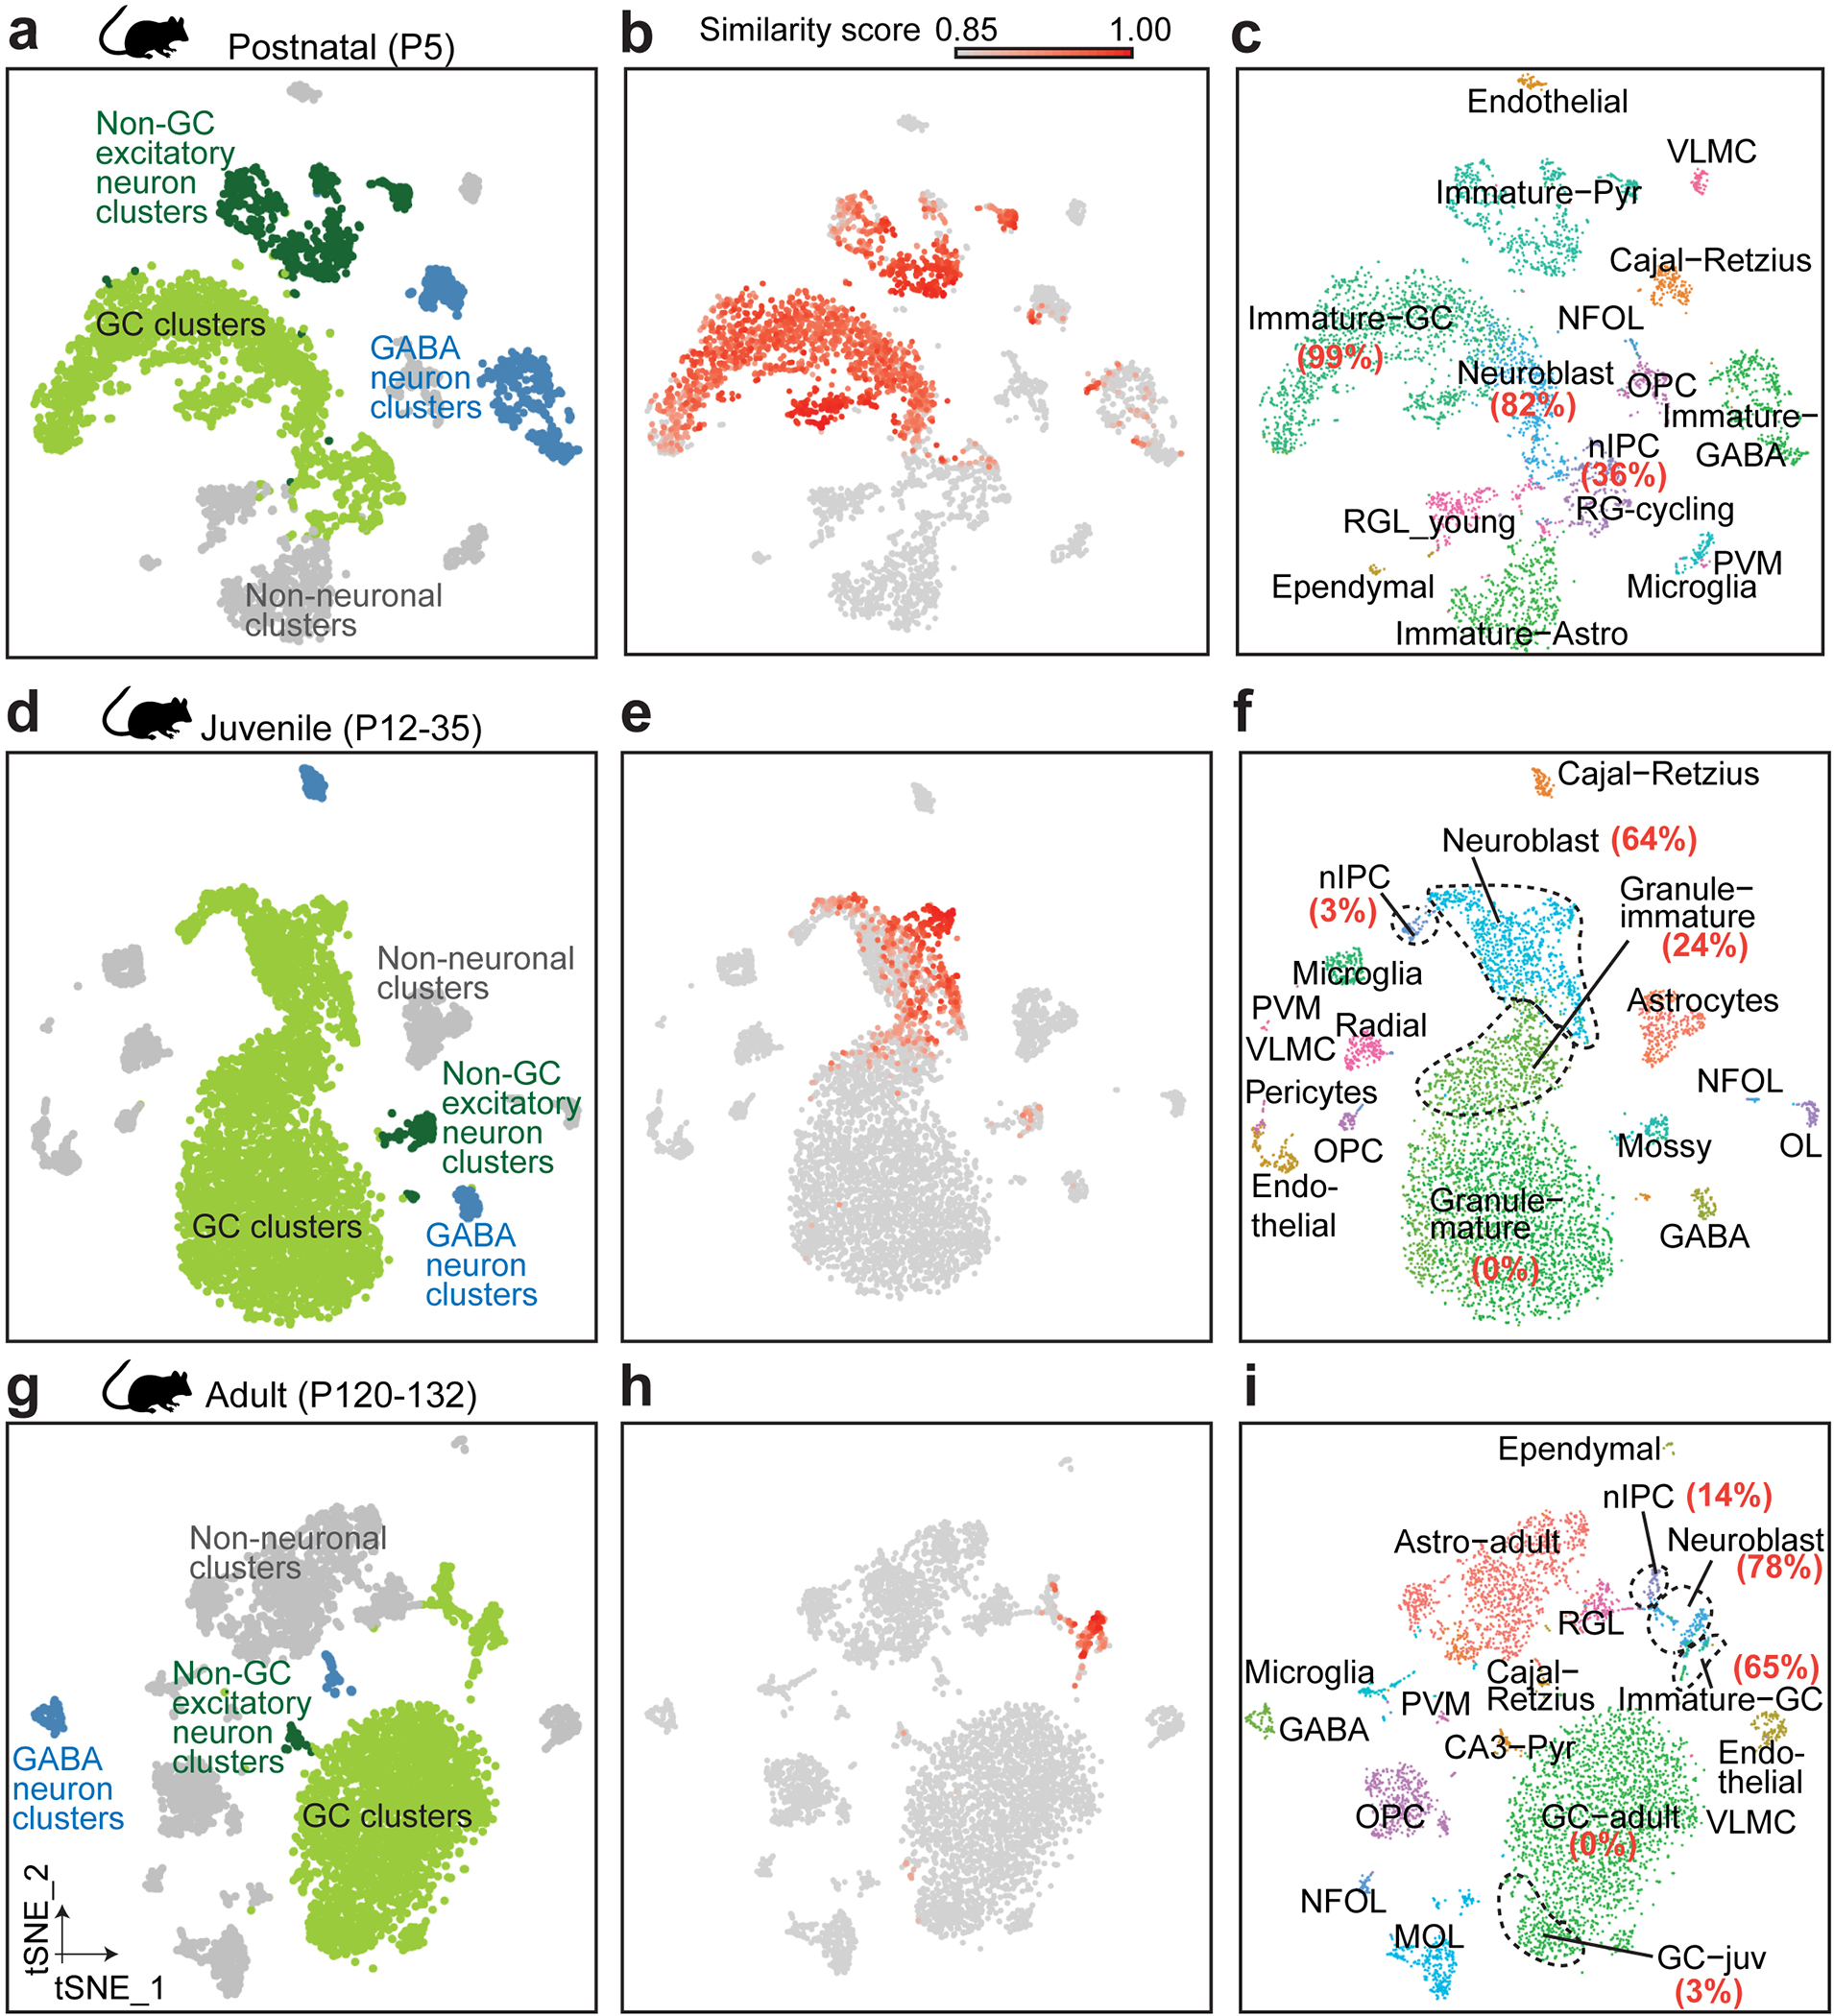
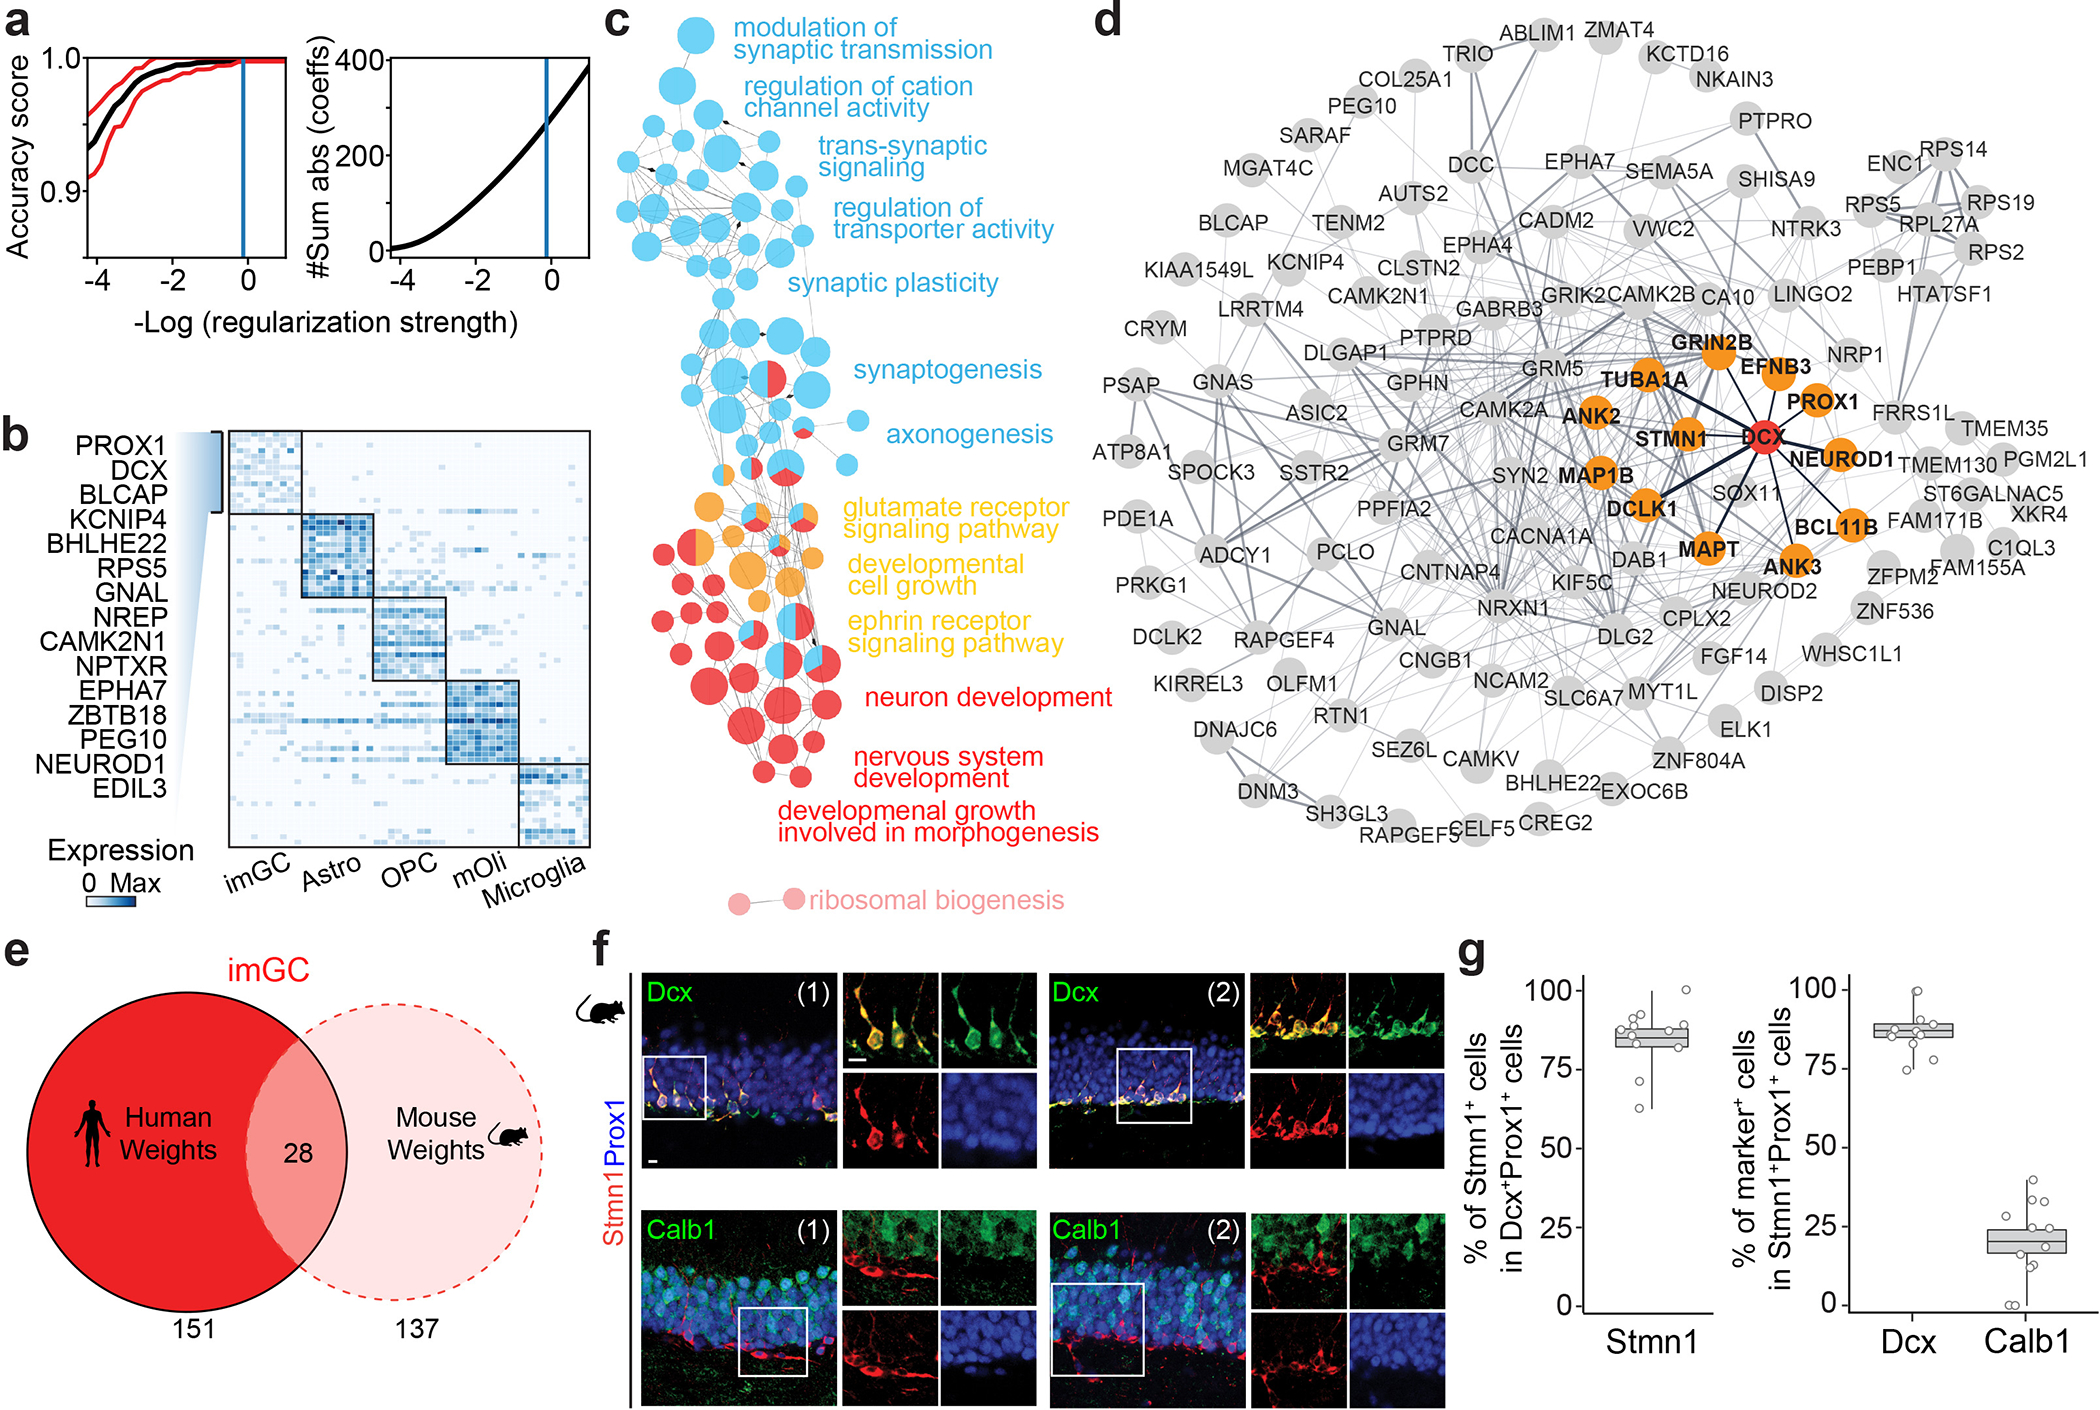
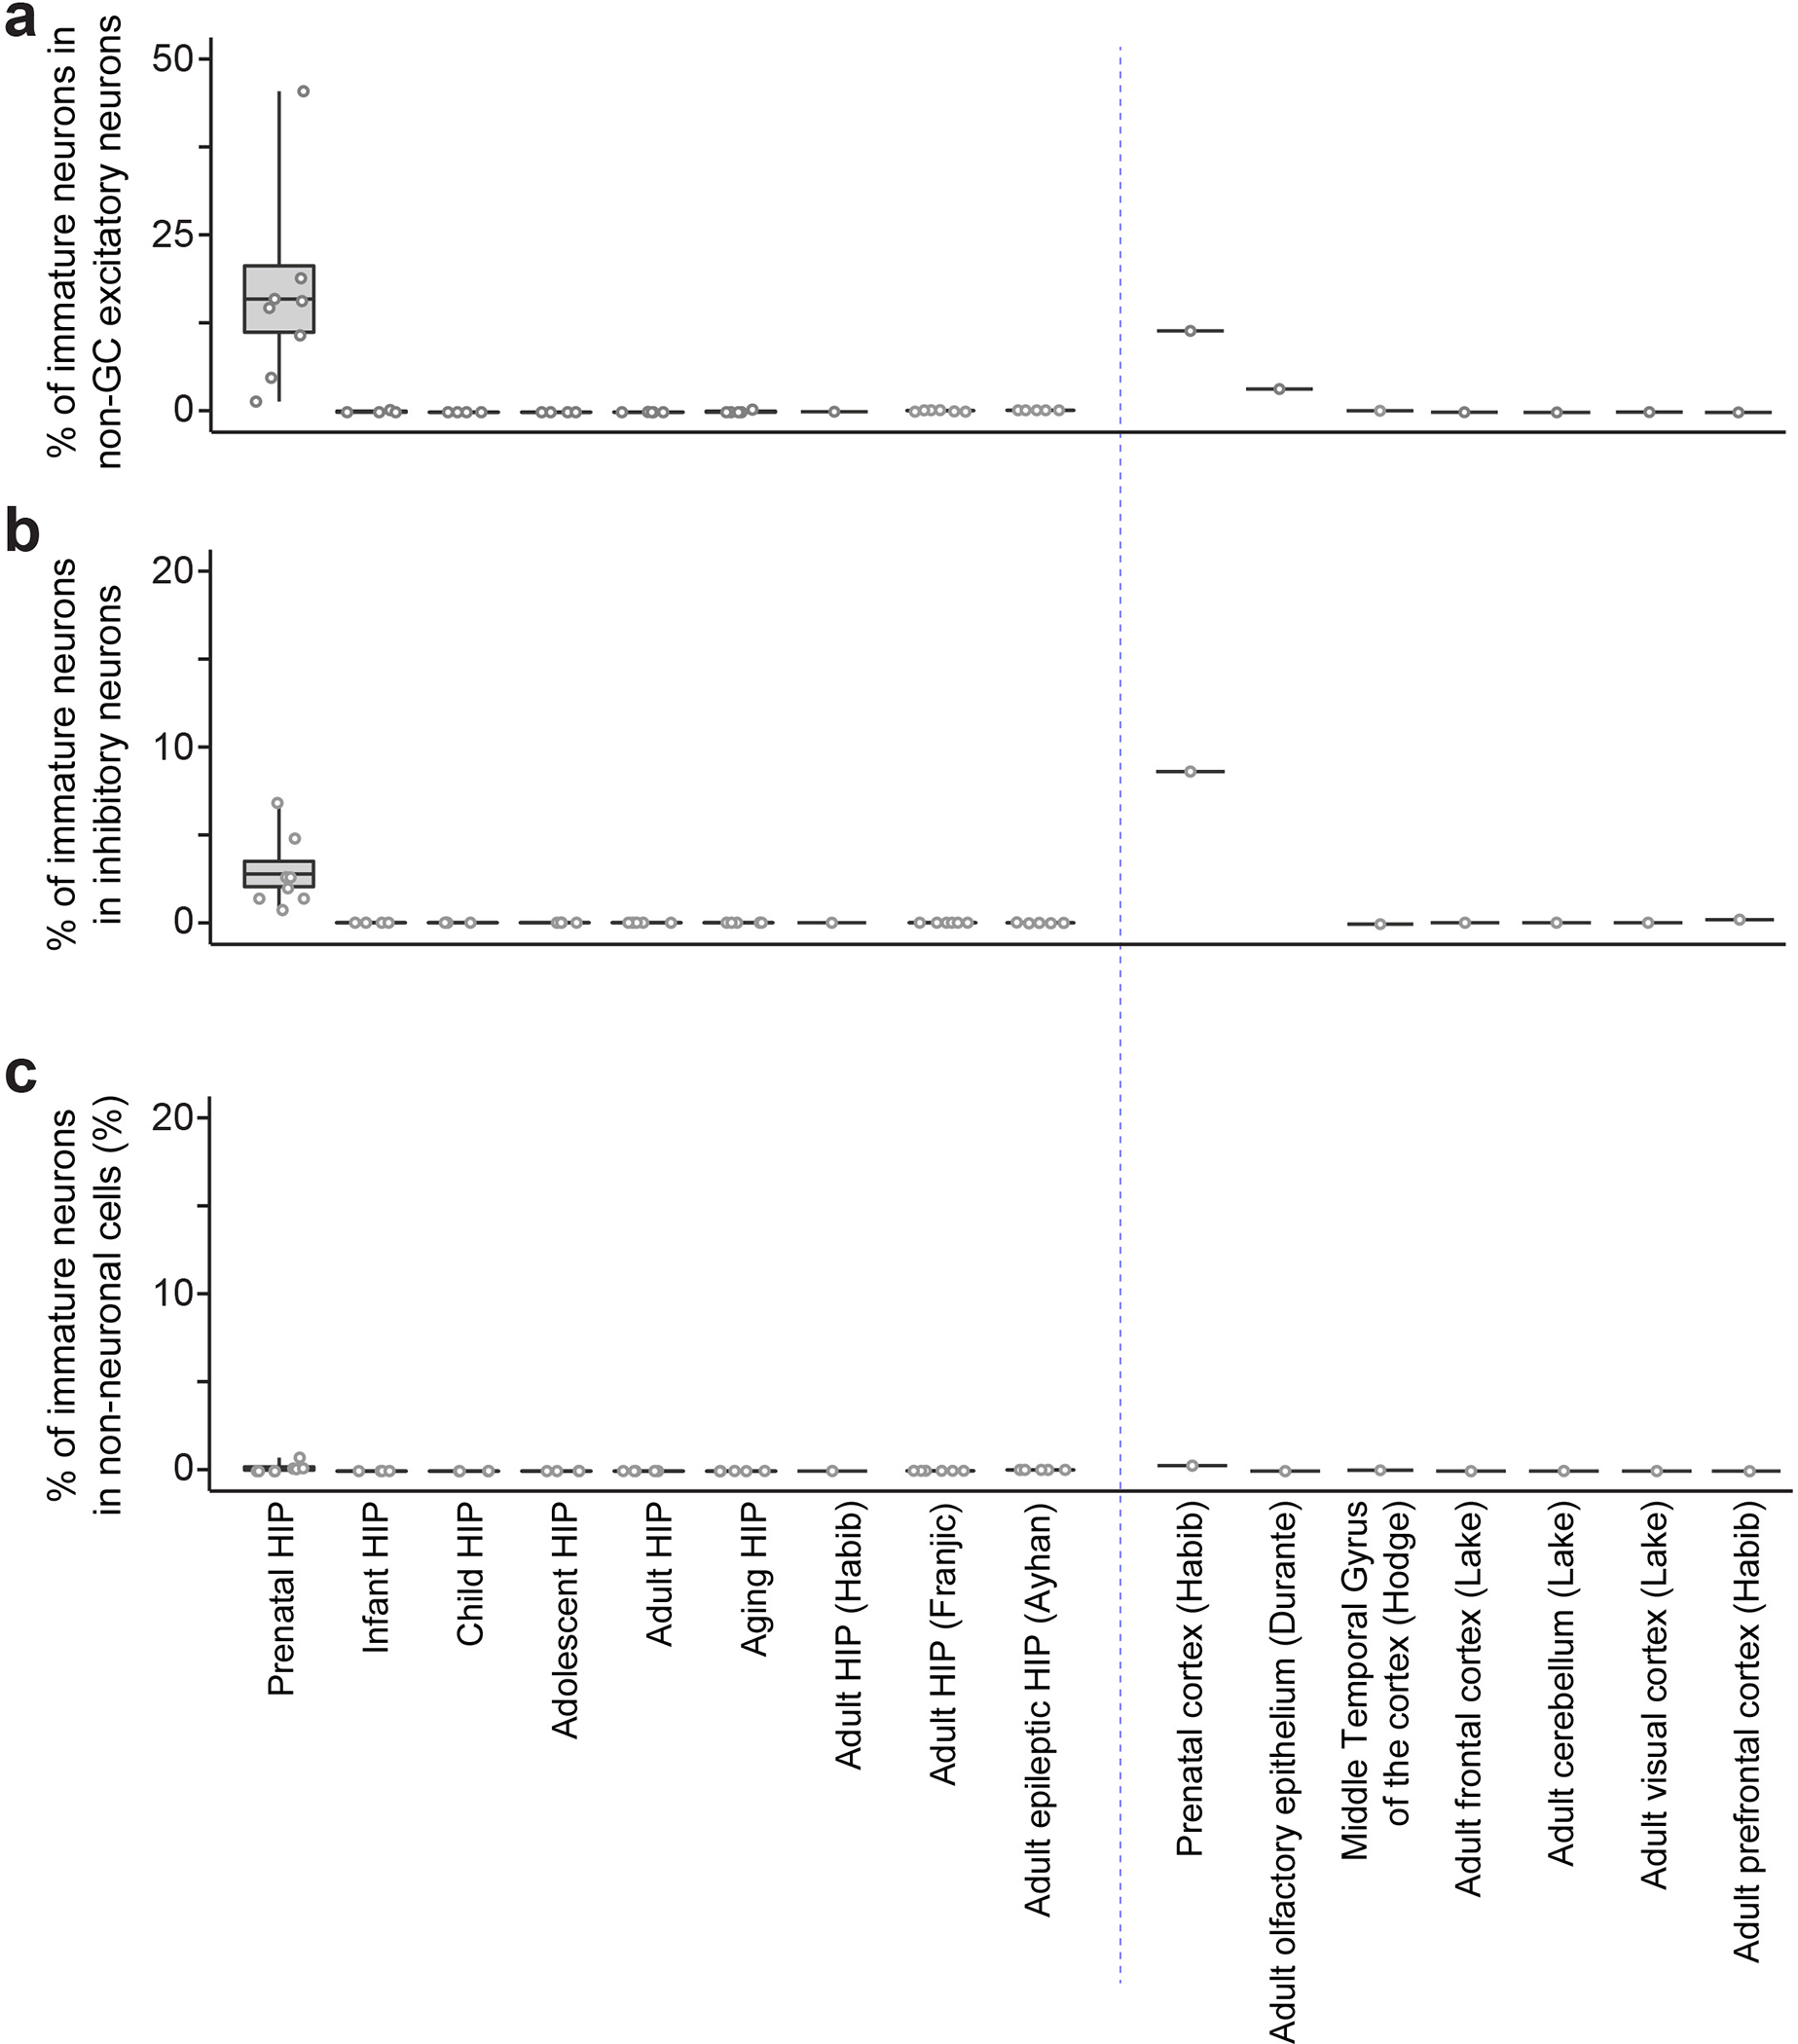
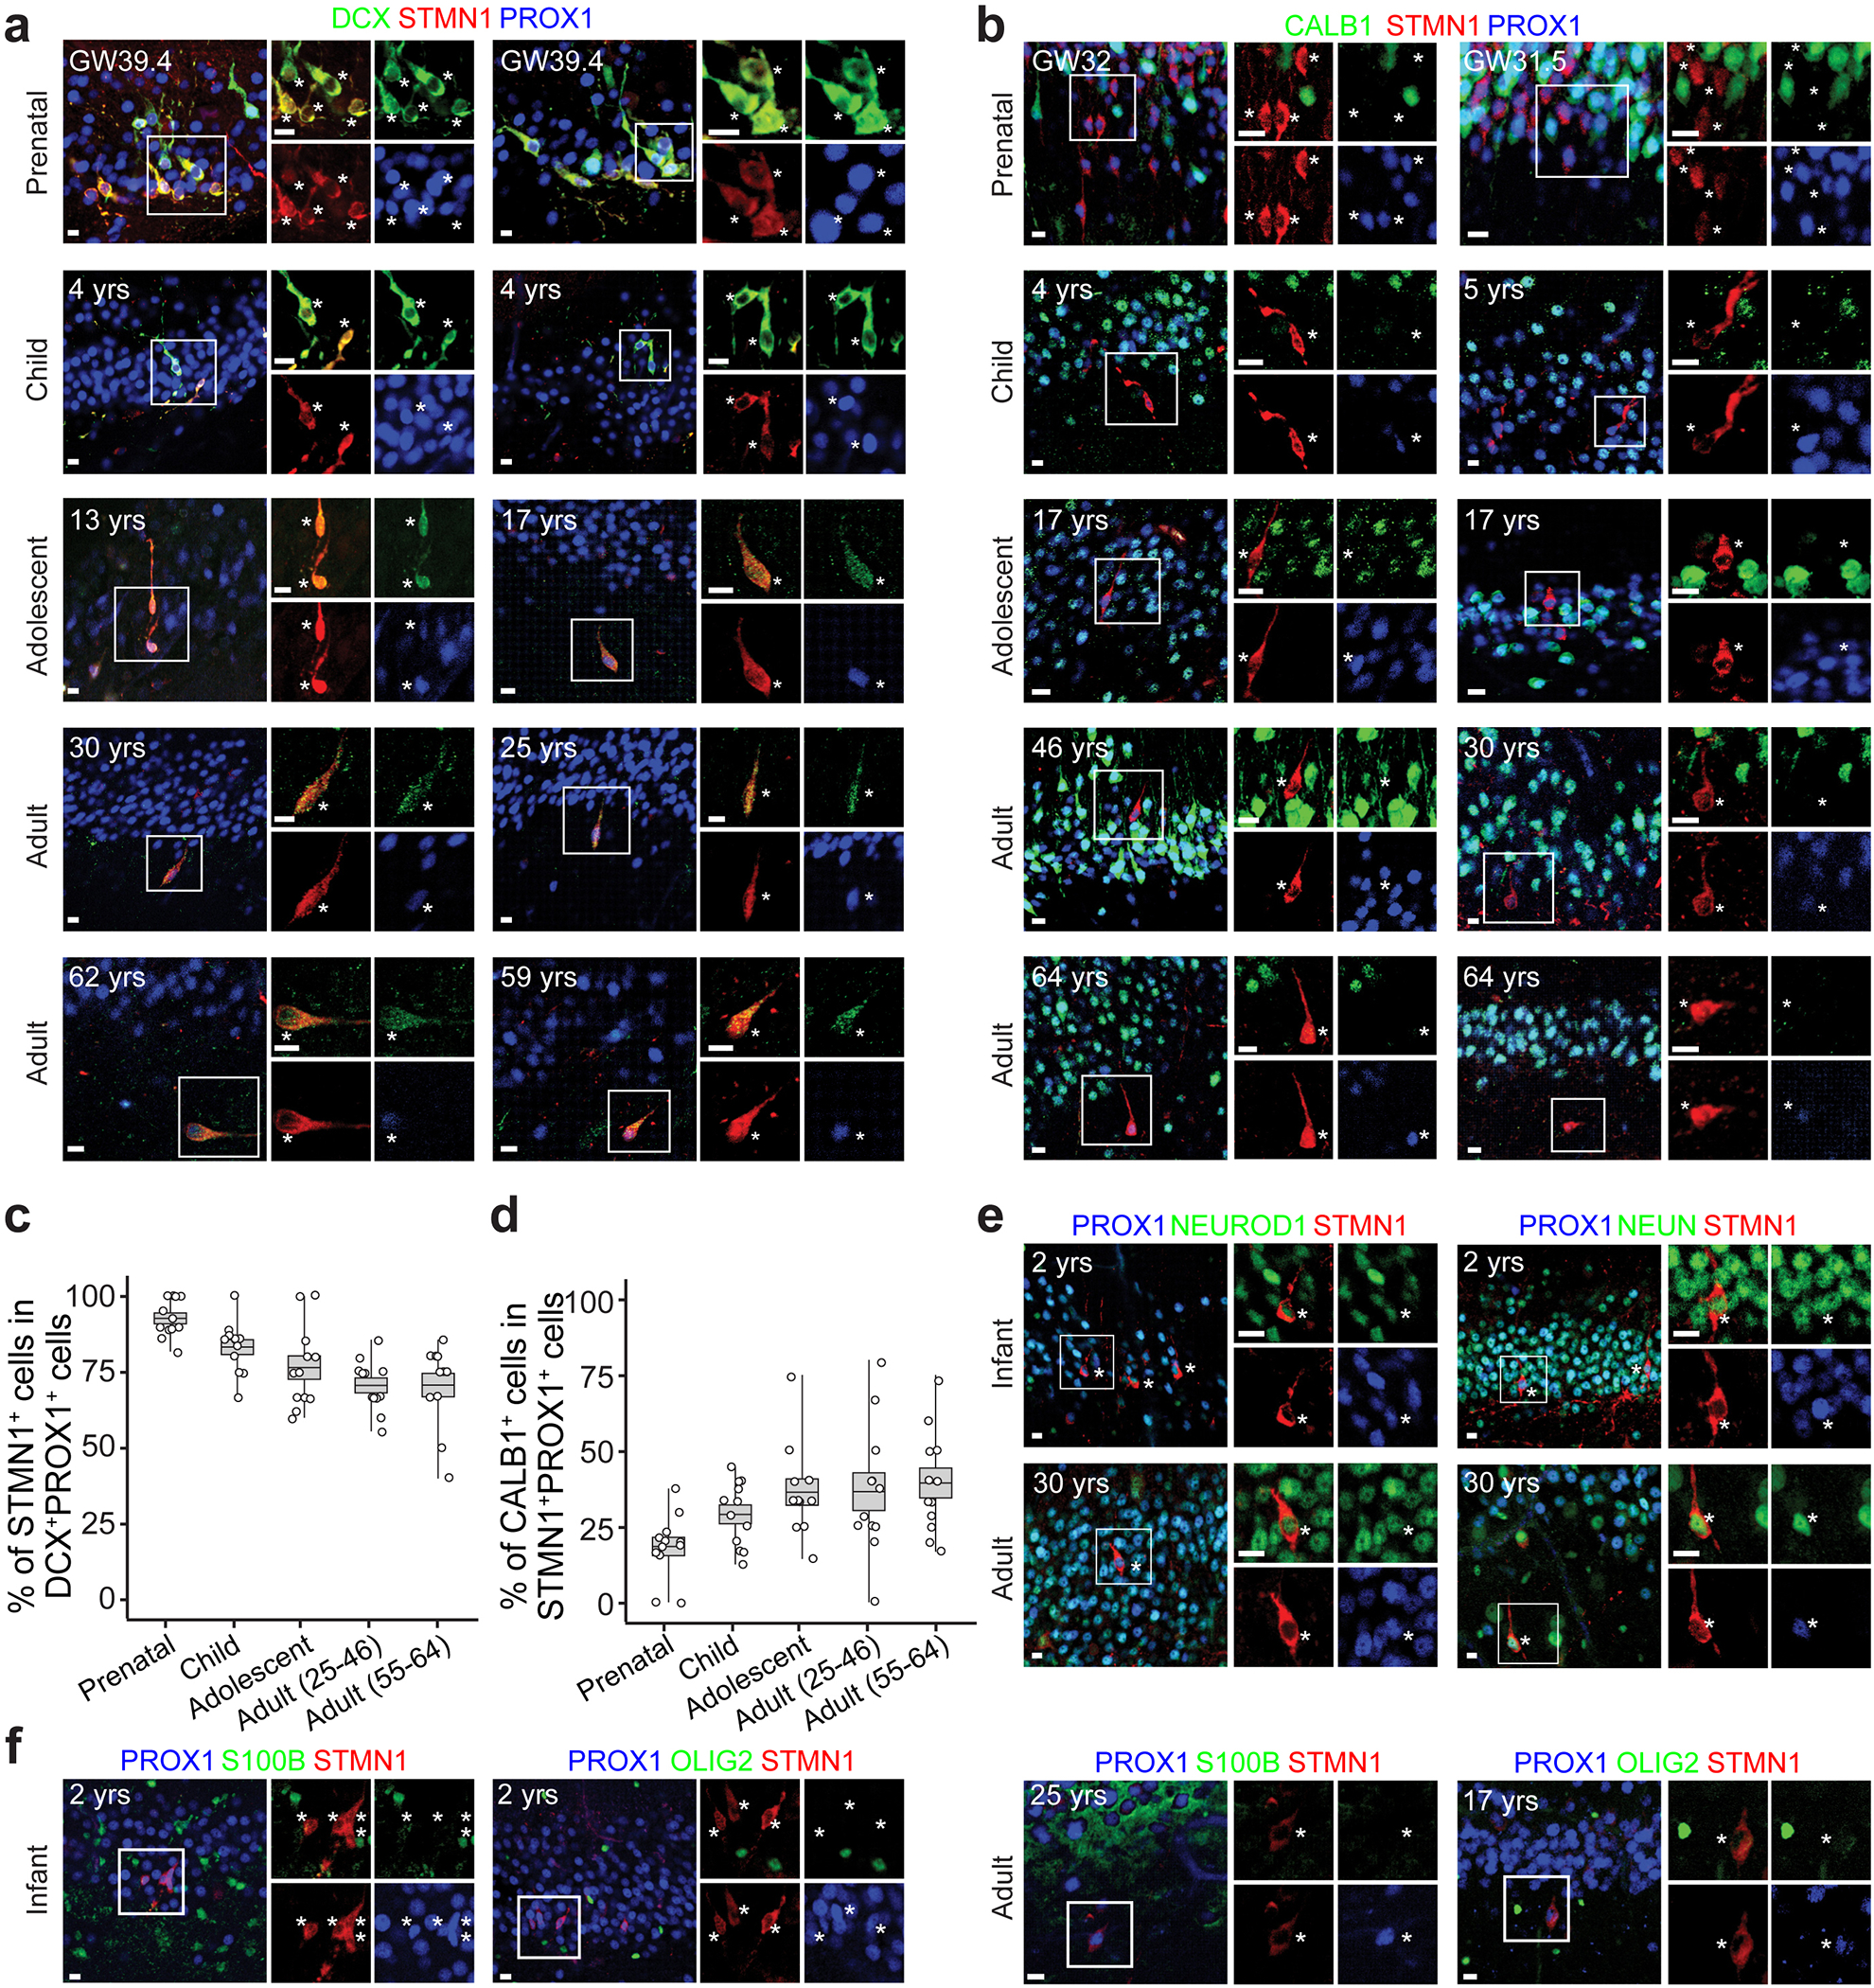
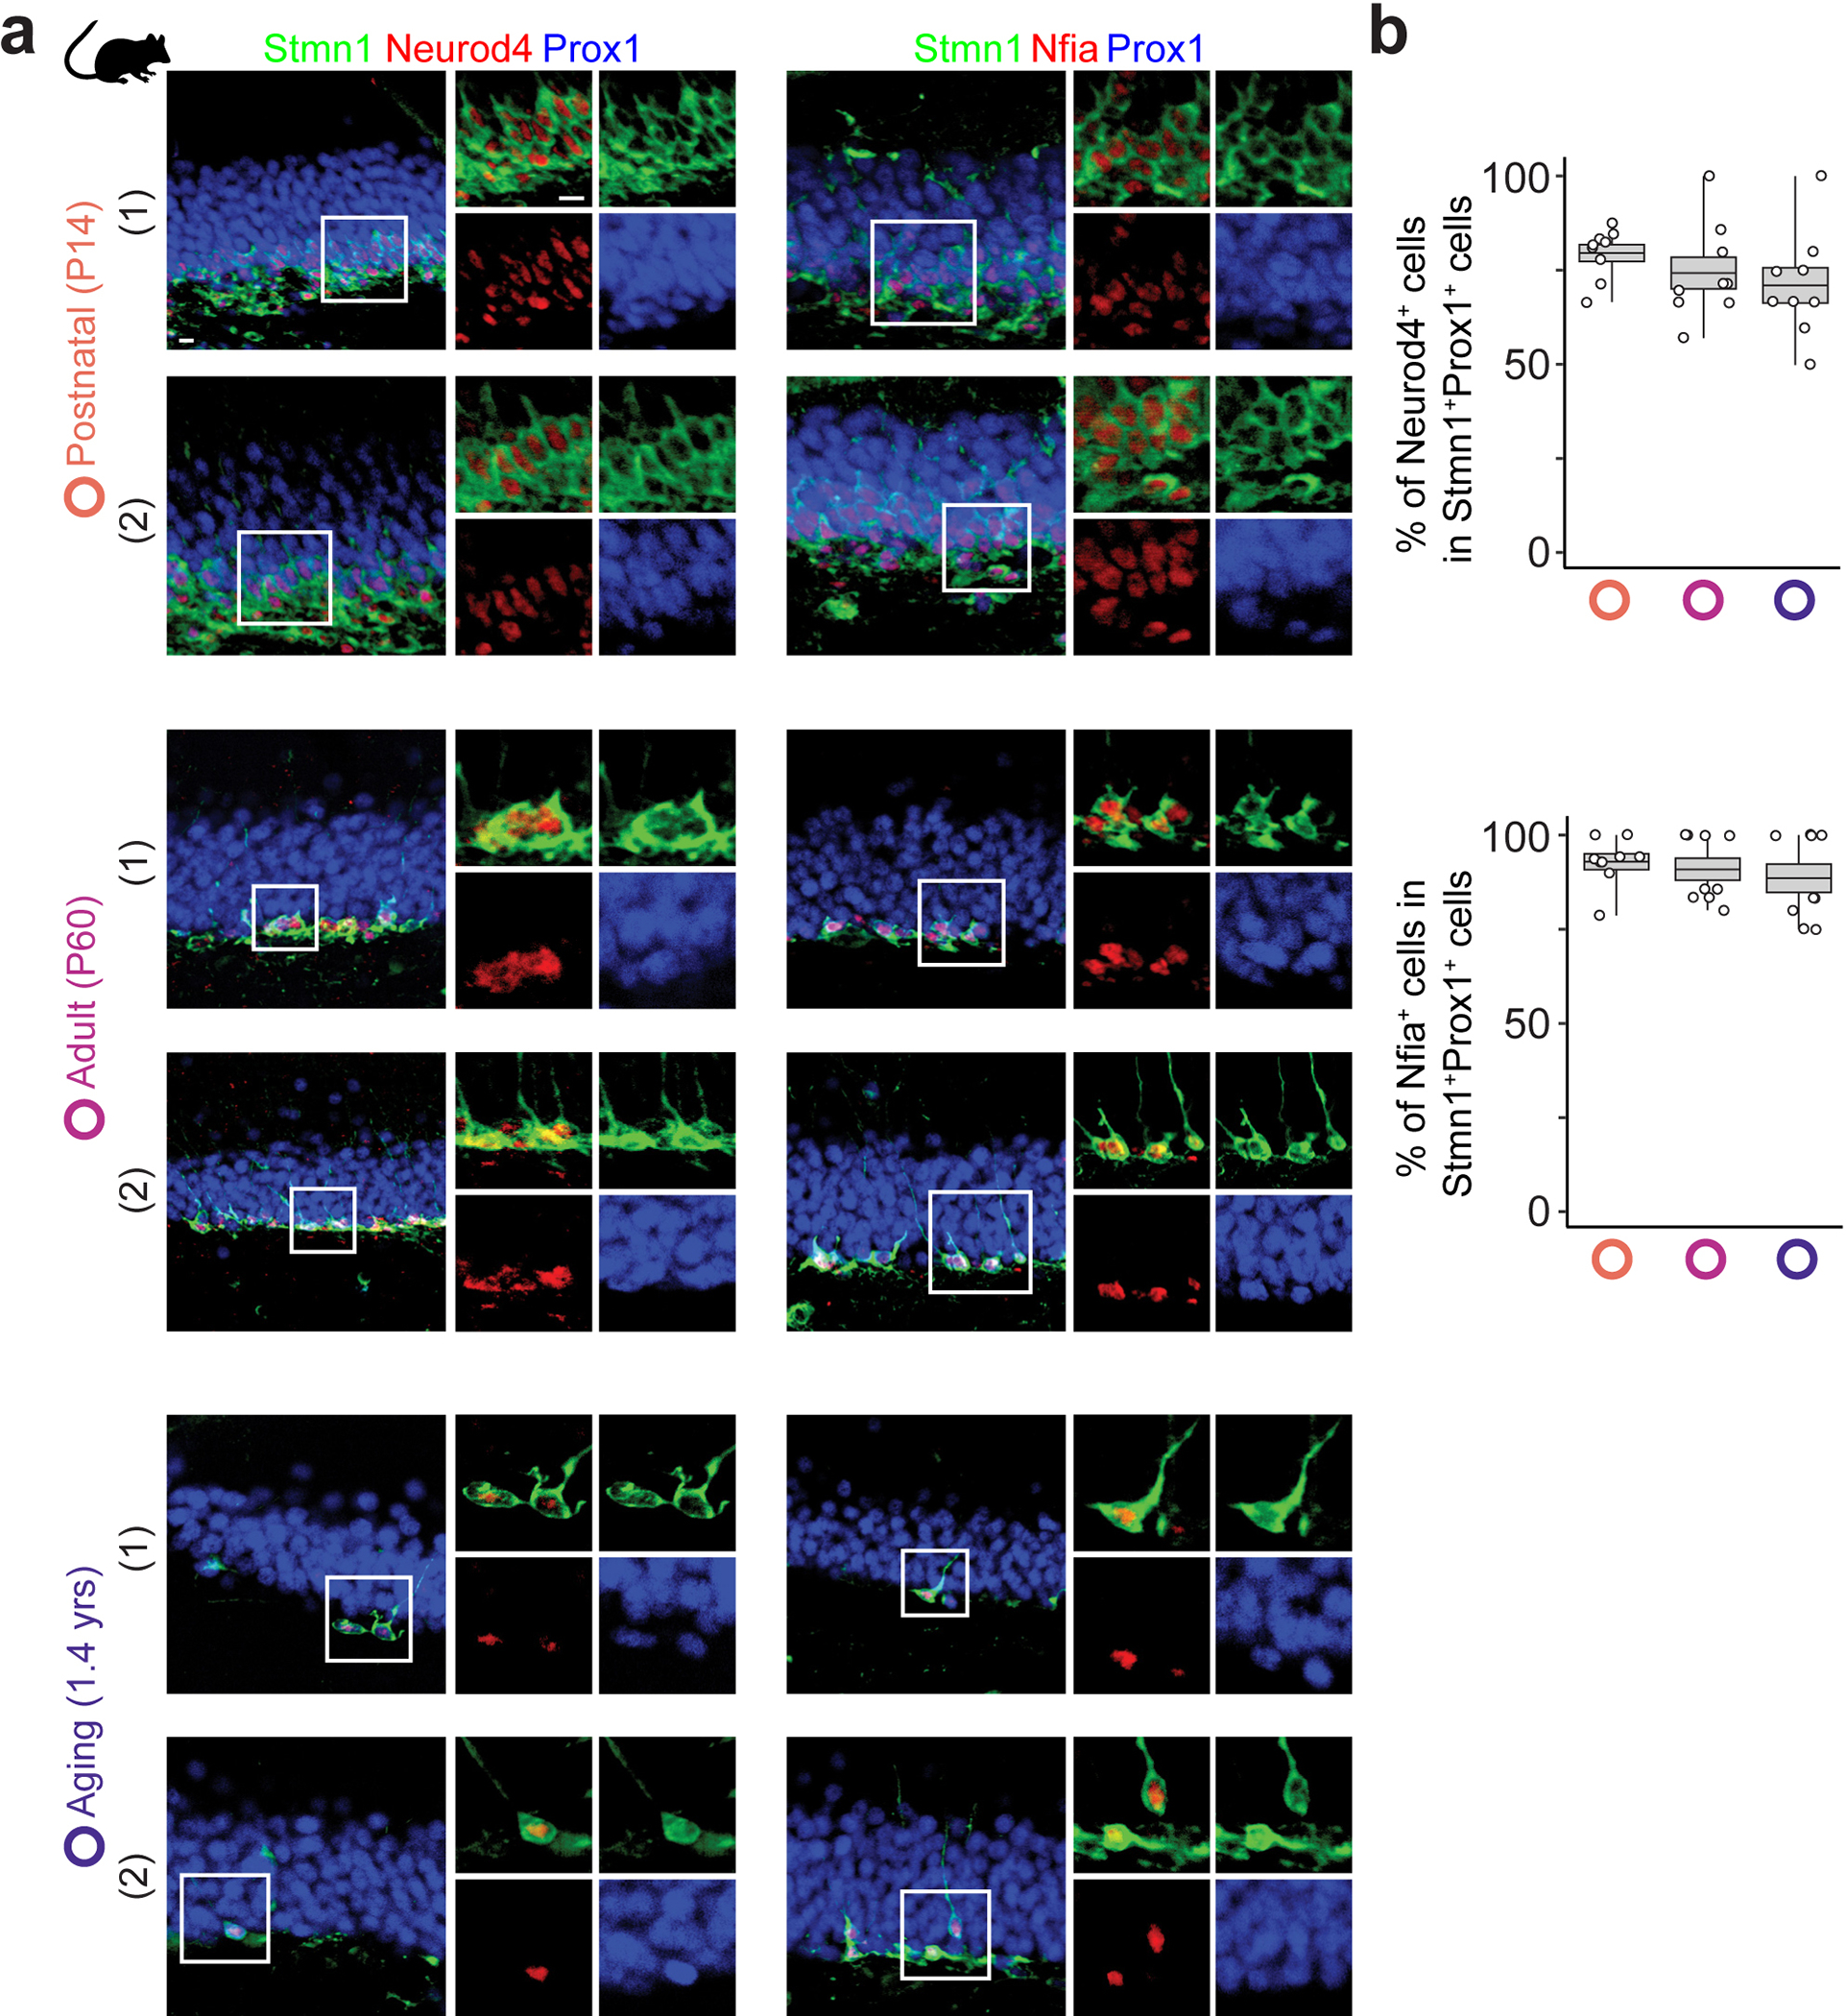
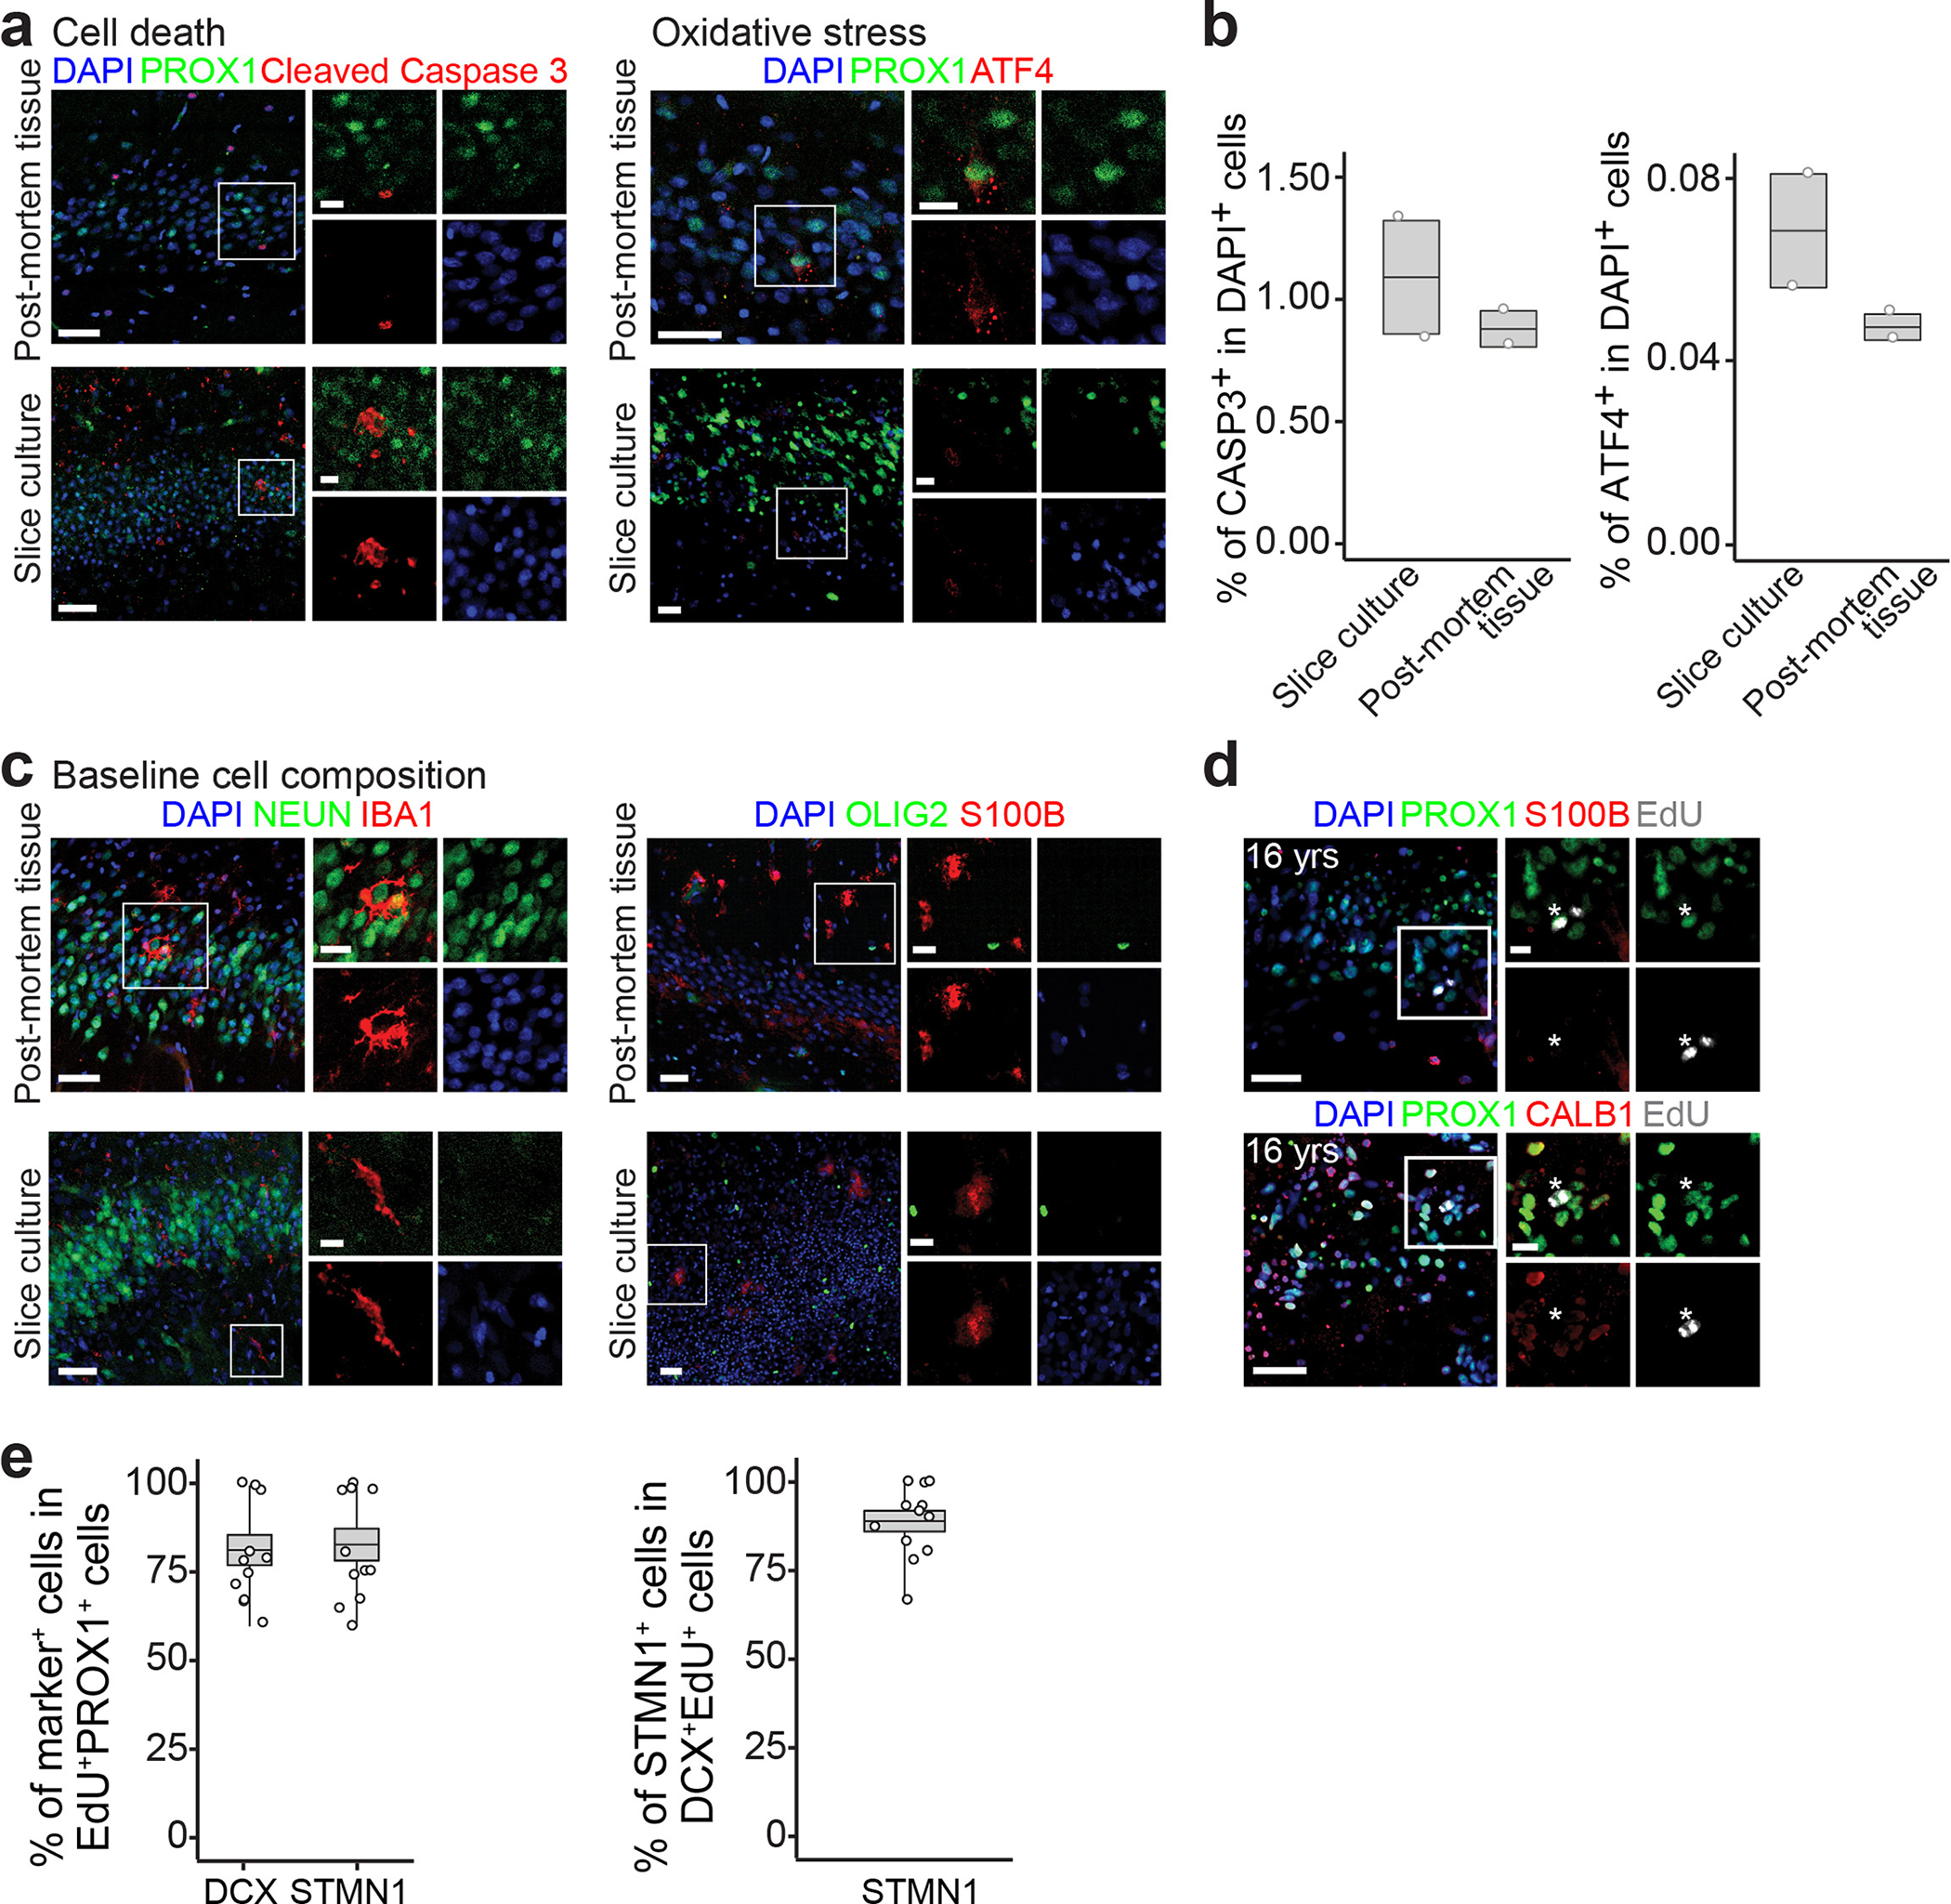
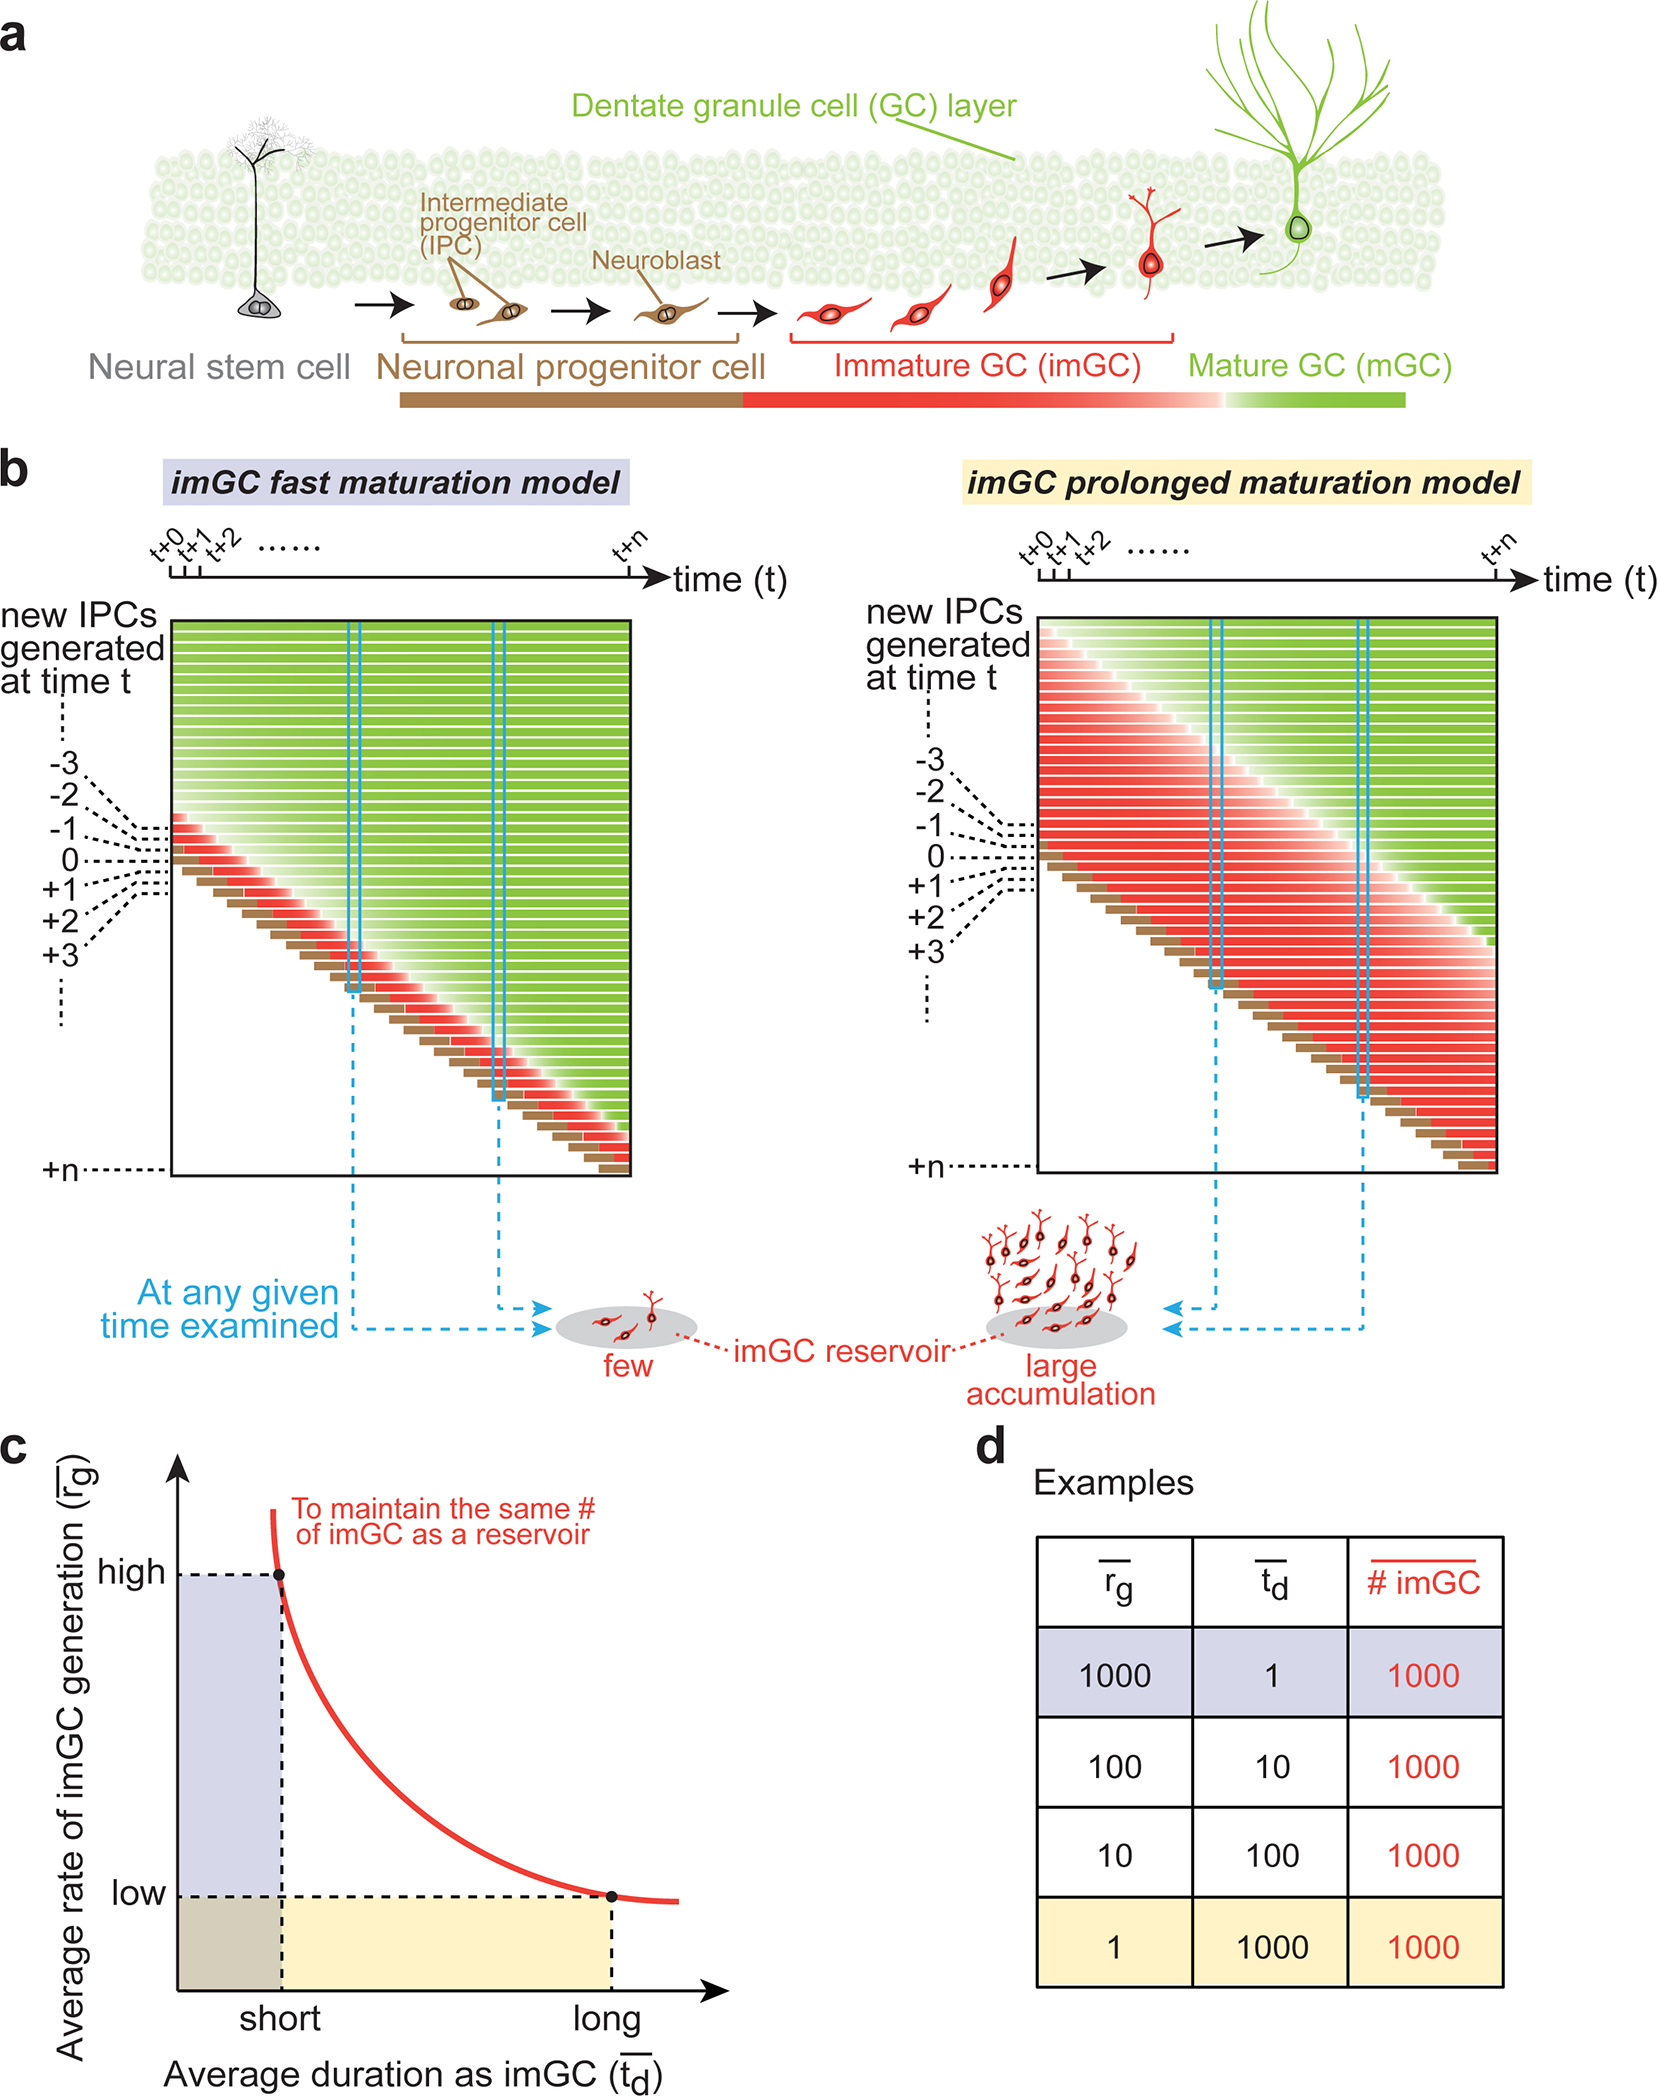
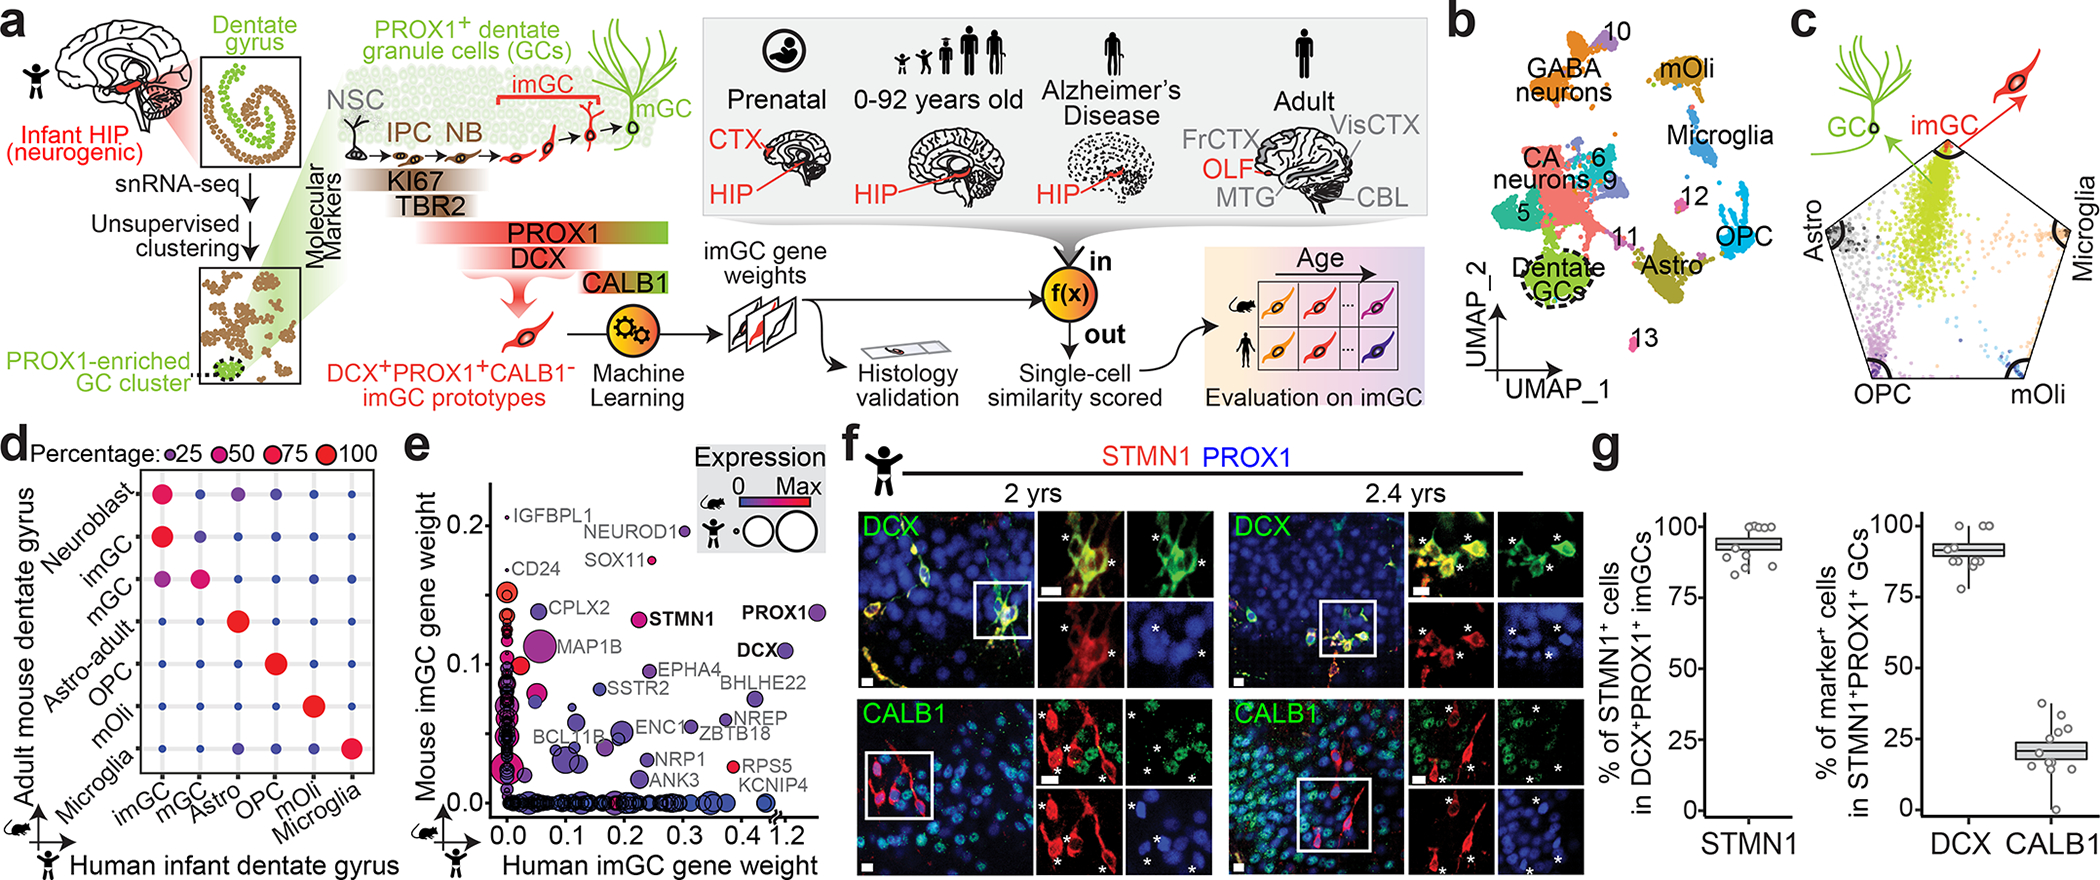
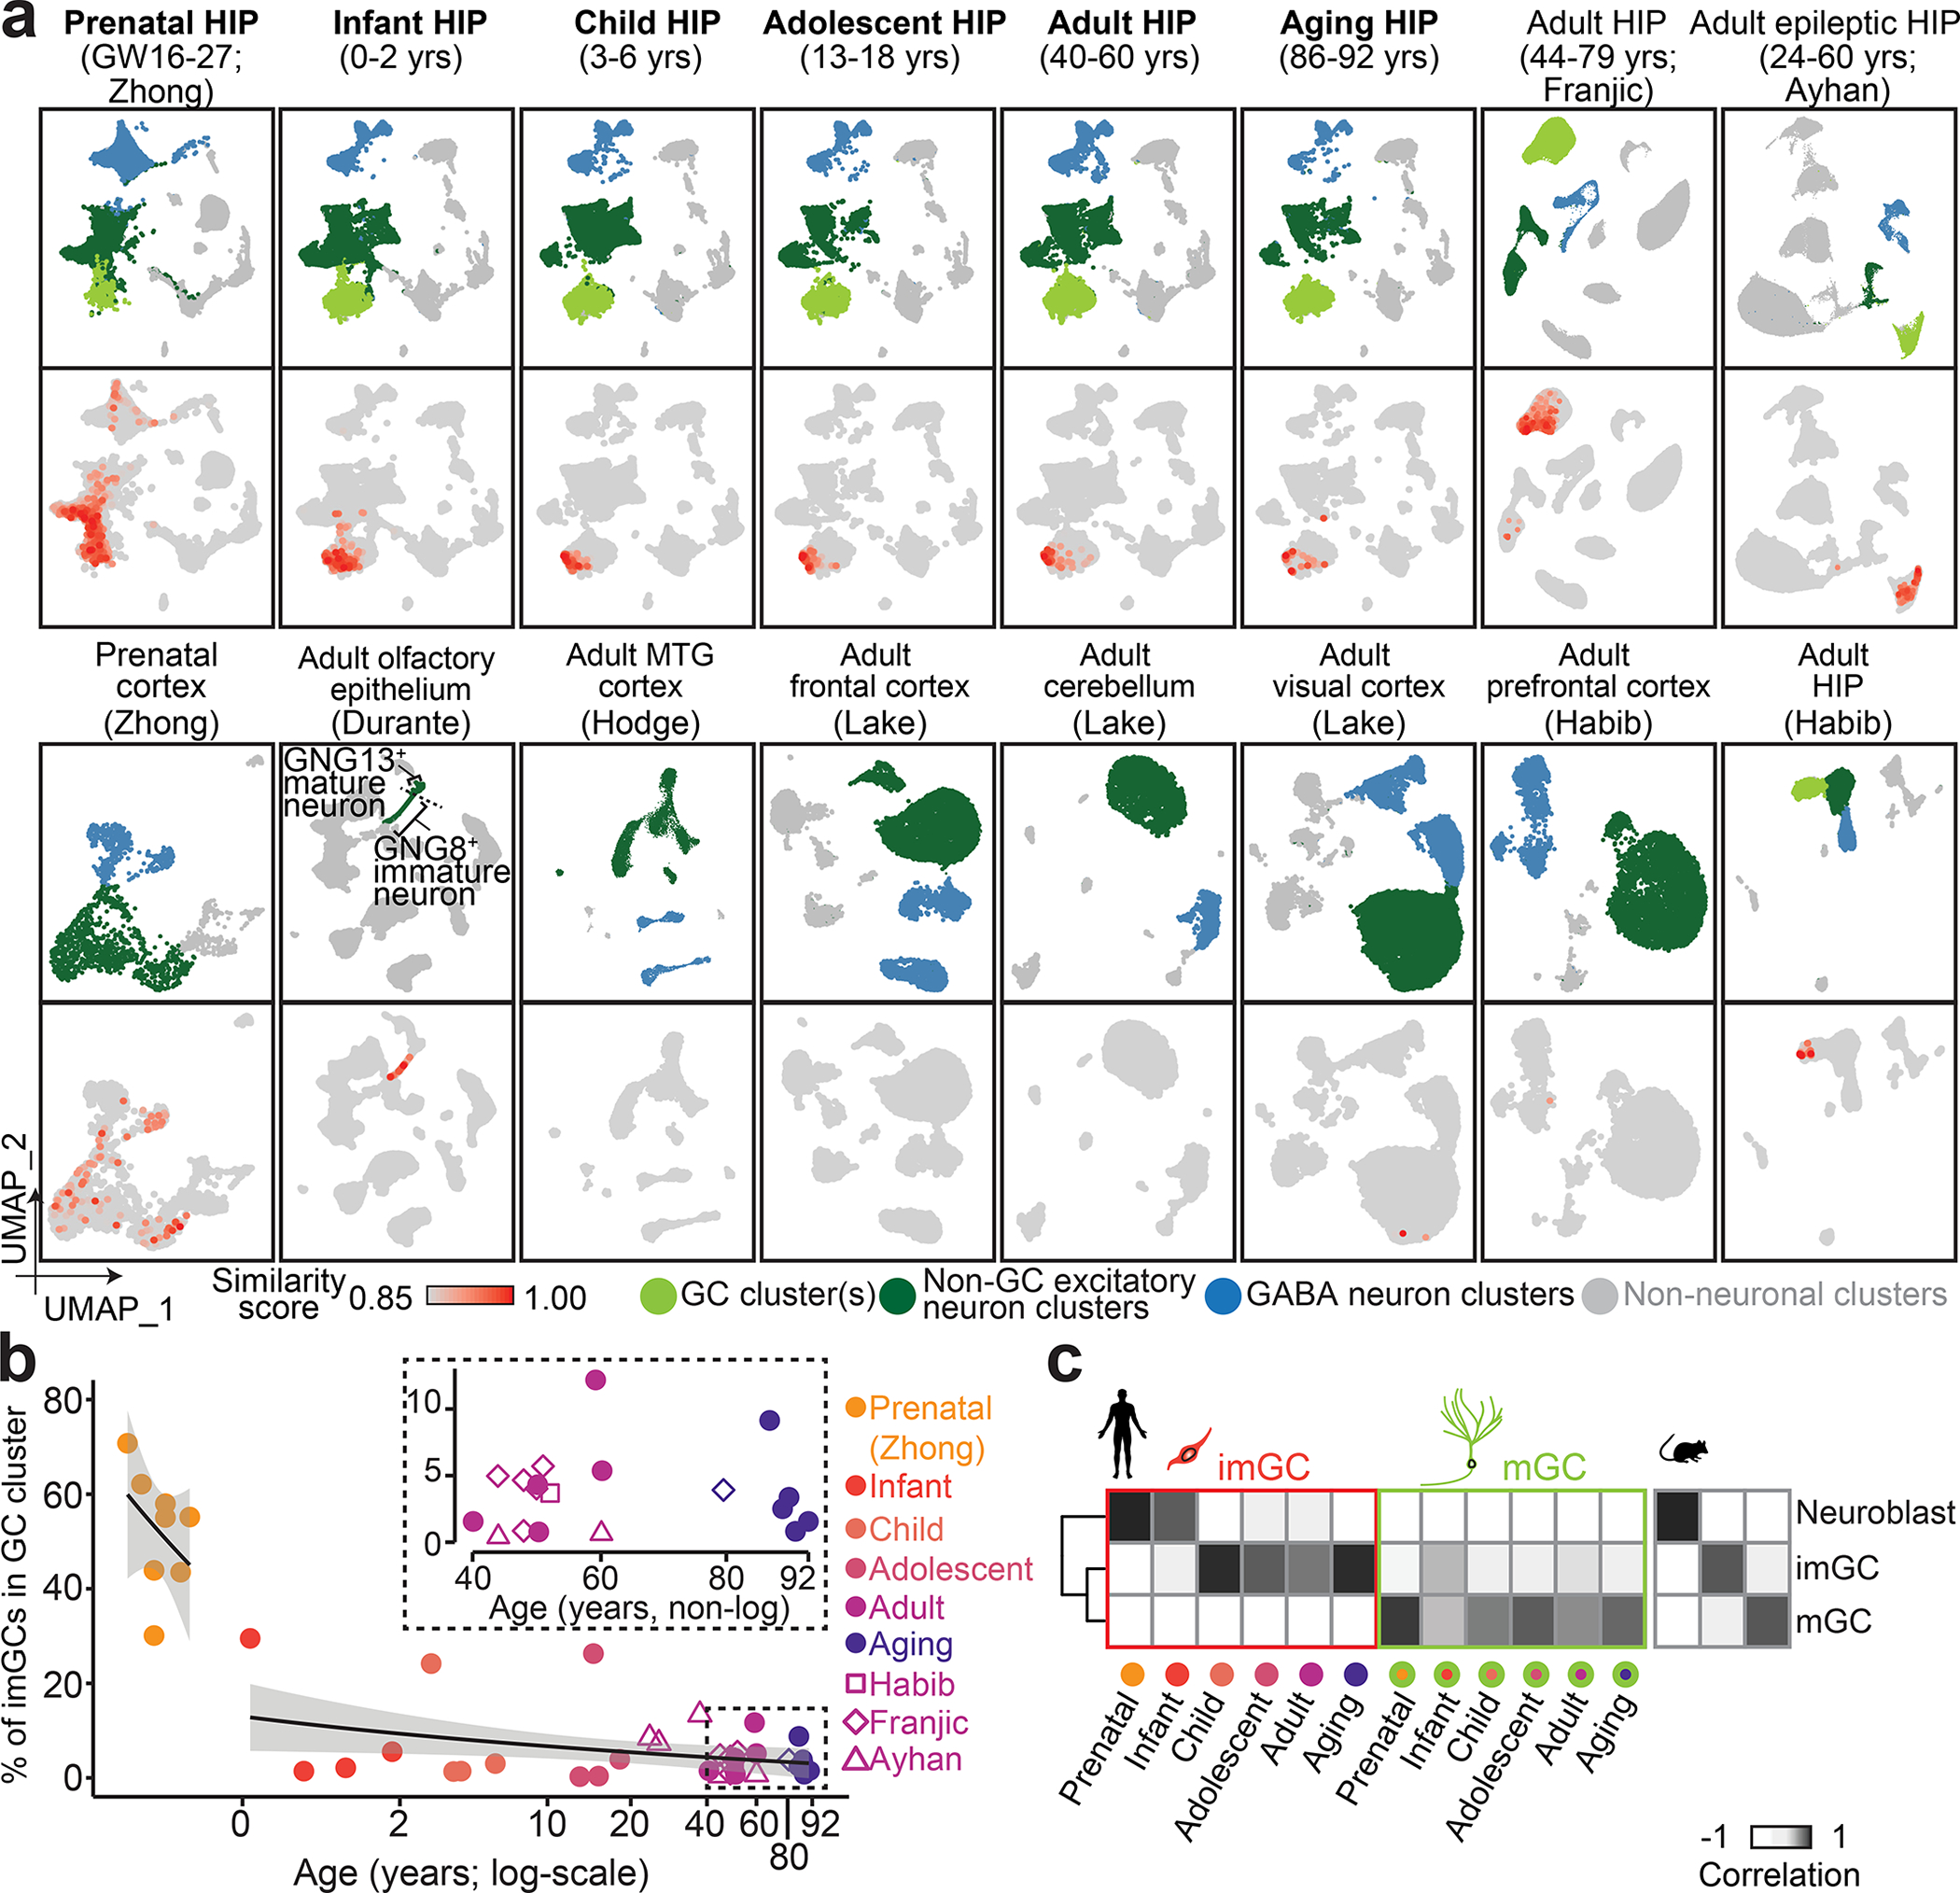
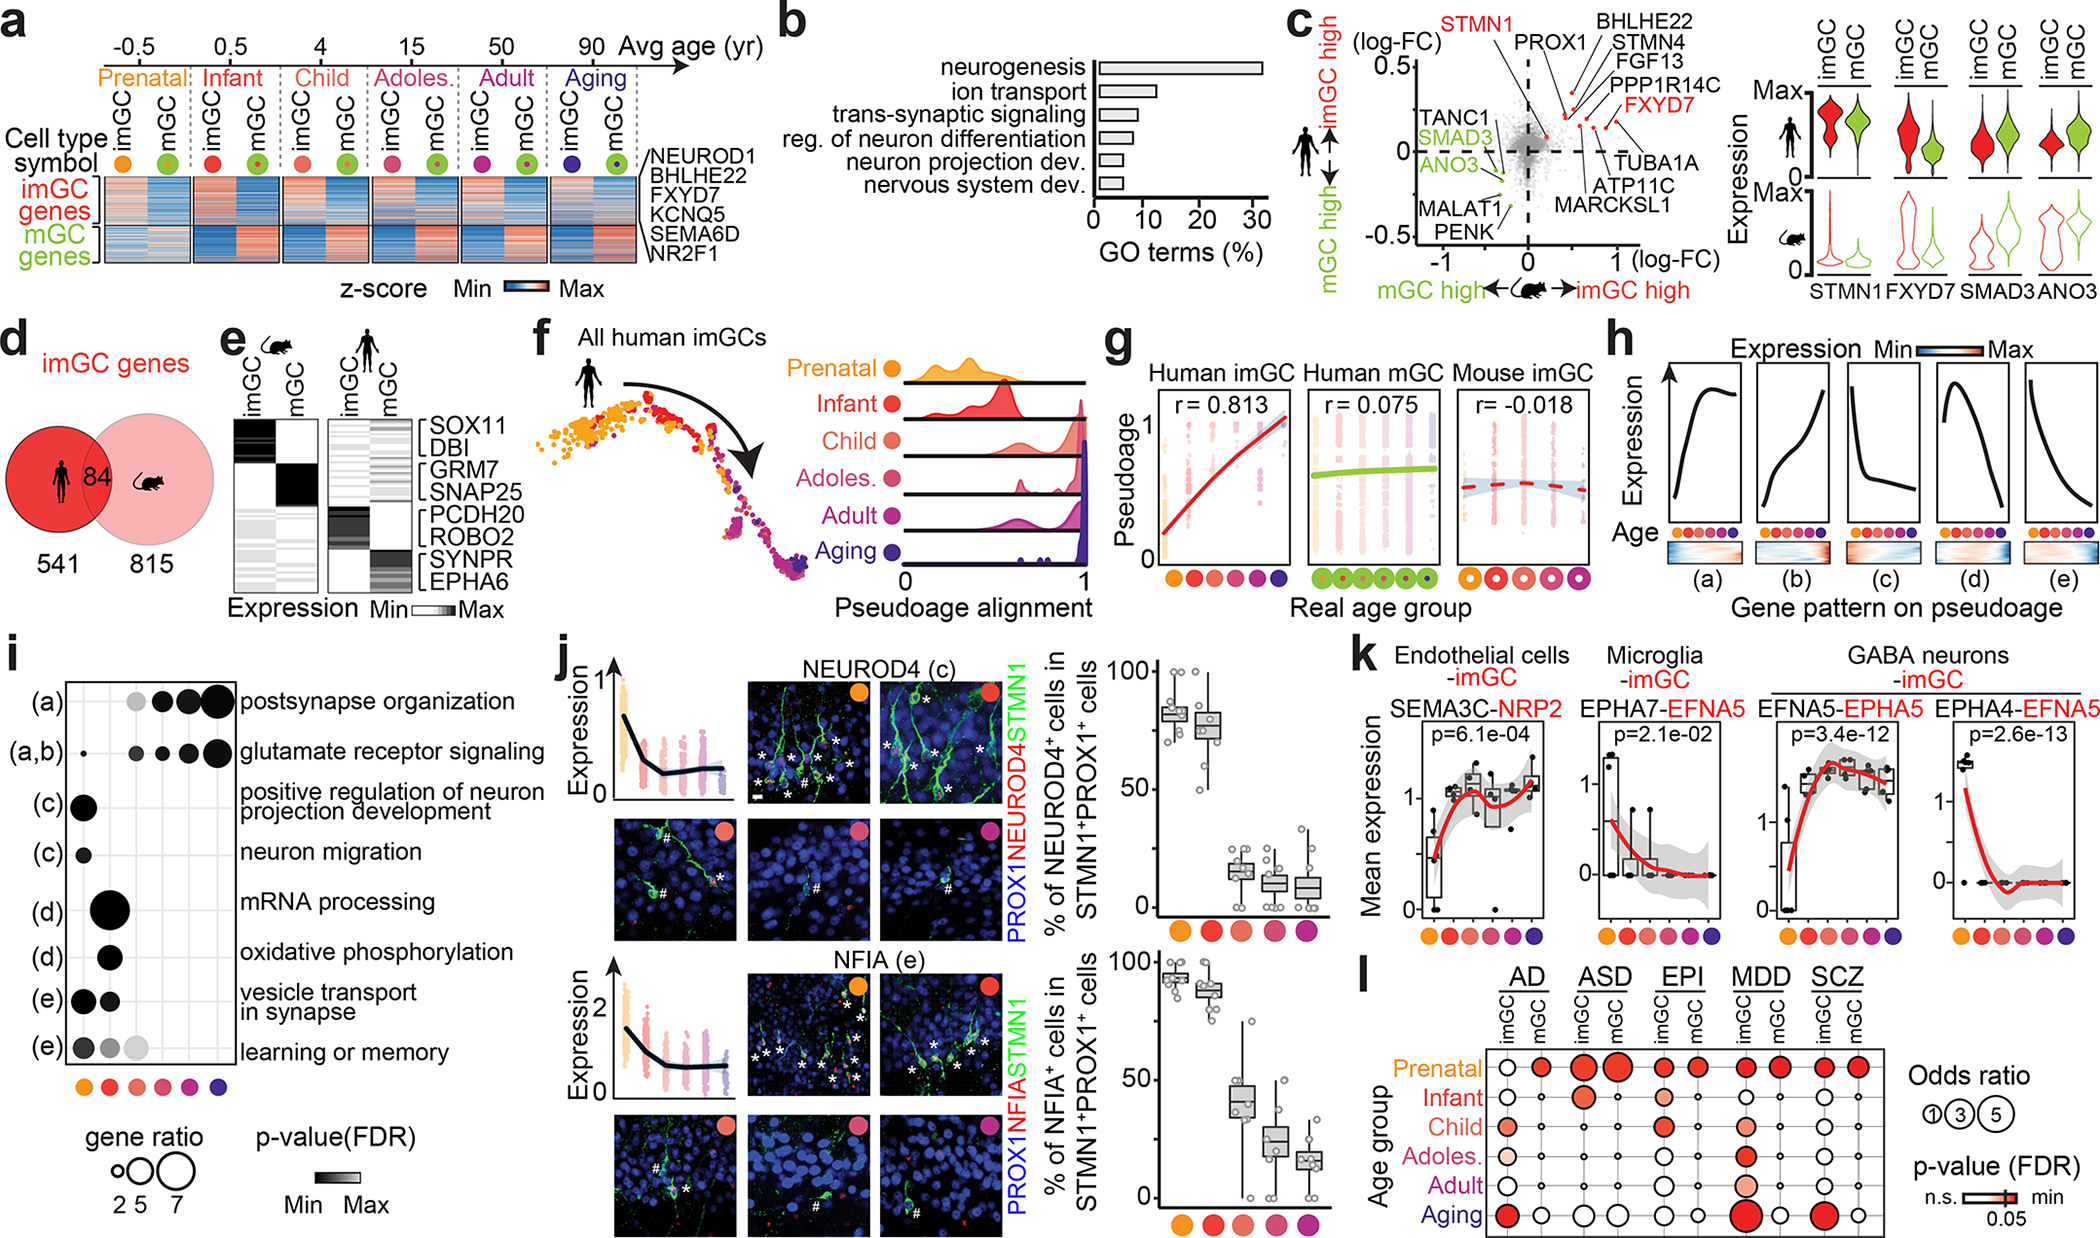
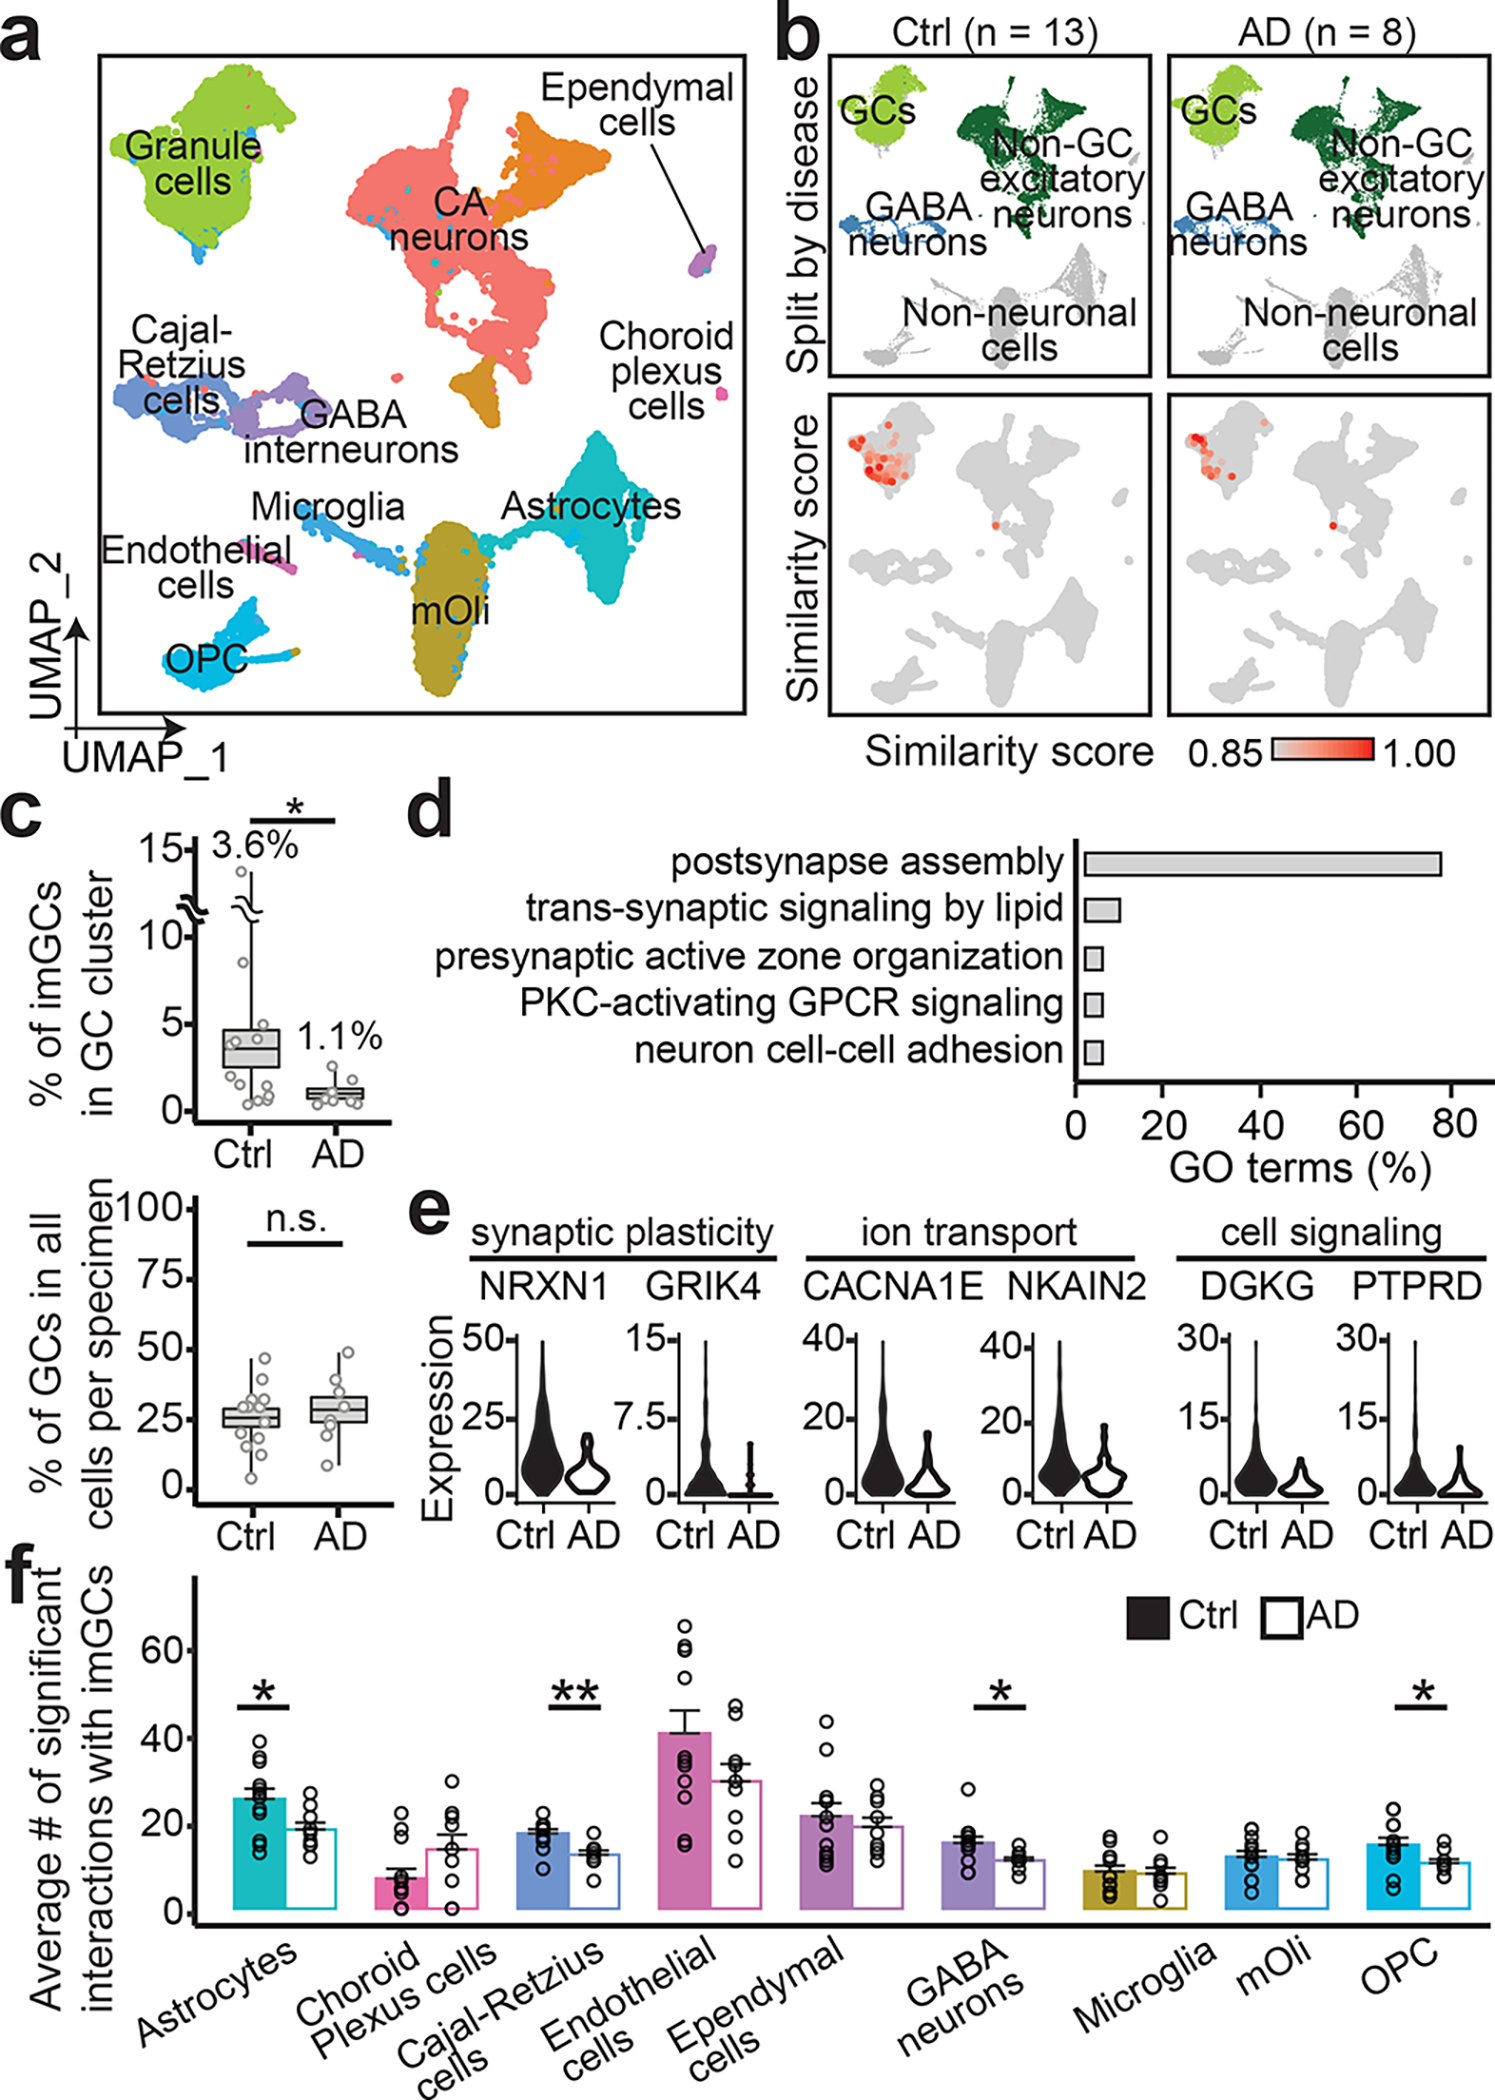
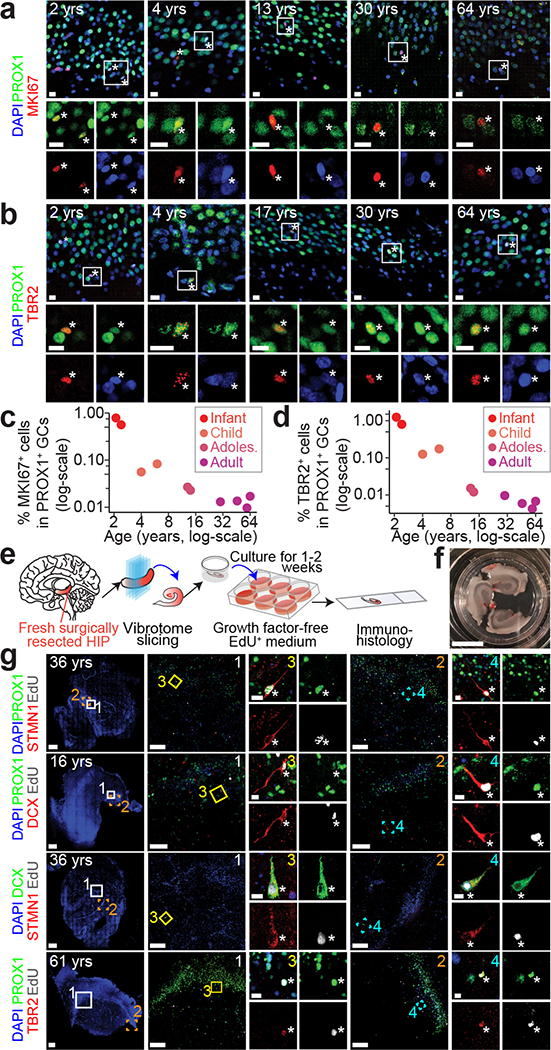
Immature dentate granule cells (imGCs) arising from adult hippocampal neurogenesis contribute to plasticity and unique brain functions in rodents1,2 and are dysregulated in multiple human neurological disorders3-5. Little is known about the molecular characteristics of adult human hippocampal imGCs, and even their existence is under debate1,6-8. Here we performed single-nucleus RNA sequencing aided by a validated machine learning-based analytic approach to identify imGCs and quantify their abundance in the human hippocampus at different stages across the lifespan. We identified common molecular hallmarks of human imGCs across the lifespan and observed age-dependent transcriptional dynamics in human imGCs that suggest changes in cellular functionality, niche interactions and disease relevance, that differ from those in mice9. We also found a decreased number of imGCs with altered gene expression in Alzheimer's disease. Finally, we demonstrated the capacity for neurogenesis in the adult human hippocampus with the presence of rare dentate granule cell fate-specific proliferating neural progenitors and with cultured surgical specimens. Together, our findings suggest the presence of a substantial number of imGCs in the adult human hippocampus via low-frequency de novo generation and protracted maturation, and our study reveals their molecular properties across the lifespan and in Alzheimer's disease.


Conflict of interest statement

Competing interests

The authors declare no competing interests.

Figures

Extended Data Fig. 1 |
Extended Data Fig. 1 |. Characteristics of the snRNA-seq dataset of the infant human hippocampus.
a, Expression patterns of marker genes used to determine cluster identities. Ex.: excitatory; OPC: oligodendrocyte precursor cells. b, Uniform Manifold Approximation and Projection (UMAP) visualization of all cells from the four infant hippocampi (0–2 years) colored by specimen. HIP: hippocampus; yrs: years. c, UMAP plots of nuclei from four human infant hippocampal specimens by marker gene expression. The dentate granule cell cluster is highlighted with a dashed line circle.
Extended Data Fig. 2 |
Extended Data Fig. 2 |. Machine learning model trained with the mouse early postnatal hippocampal scRNA-seq dataset.
a, b, Unsupervised clustering and t-distributed Stochastic Neighbor Embedding (t-SNE) visualization of all cells from the mouse postnatal (P5) hippocampus colored by cluster (a) and marker gene expression (b). imGC: immature dentate granule cell; GC: dentate granule cell; IPC: intermediate progenitor cell; OPC: oligodendrocyte precursor cell. RGL: radial glia-like cell; VLMC: vascular and leptomeningeal cell. c, A schematic illustration of the machine learning-aided analysis using the mouse hippocampal scRNA-seq datasets, mirroring our analysis pipeline in human studies (Fig. 1a). In brief, Dcx+Calb1Prox1+ imGCs in the P5 mouse dentate gyrus were selected as prototypes to train a scoring model to comprehensively learn their gene features. The trained model containing an aggregate of weighted features (“gene weights”) was then used to quantitatively evaluate the similarity of each cell to the imGC prototype in query (test) datasets of the early postnatal (P5; self-scoring), the juvenile (P12-35) and the adult (P120-132) hippocampus. To assess the efficacy of our method, we classified cells with high similarity scores to the imGC prototype as imGCs and compared our model classifications to the published annotations based on unsupervised clustering (Shown in Extended Data Fig. 3). d, Measuring performance of the machine learning model. Line plot showing the accuracy score of the machine learning classifier varying with decreasing regularization strength as estimated by cross-validation. Red line shows 95% confidence interval on the estimation of the accuracy score. #Sum abs (coeffs): sum of the absolute value of regression coefficients. e, Heatmap showing expression of top-weighted genes in top-scoring cells of each prototype determined by the machine learning model. Genes listed are the top 25 weights defining mouse imGCs. f, Wheel plot visualizing the scores of each cell to each prototype. Dots represent individual cells whose distance to each prototype is proportional to the score of that prototype. Red and lime green dots represent the prototypical imGCs and all other GCs, respectively. Dotted line indicates a similarity score of 0.85 to each prototypical cell type. Note that unlike in the human system (Fig. 1c), no mature oligodendrocyte (mOli) cluster was present in the P5 mouse hippocampus.
Extended Data Fig. 3 |
Extended Data Fig. 3 |. Validation of prototype-based scoring of mouse imGCs across ages by the trained machine learning model with published annotations based on unsupervised clustering.
a, b, d, e, g, h, t-SNE visualization of previously published mouse hippocampal datasets at postnatal (a), juvenile (d), and adult (g) stages, colored by four broad cell classes and by similarity score to prototypical imGCs (b, e, h). c, f, i, Benchmarking cells with high similarity scores (p ≥ 0.85) with the published annotations. Percentage of cells in the GC lineage clusters (based on published annotations) that are selected as imGCs by our trained machine learning model are indicated in red, bold text.
Extended Data Fig. 4 |
Extended Data Fig. 4 |. Machine learning model performance and feature extraction of gene weights defining human imGCs.
a, Efficacy of the machine-learning approach. Line plot showing the accuracy score of the machine learning model varying with decreasing regularization strength as estimated by cross-validation. Red line shows 95% confidence interval on the estimation of the accuracy score. b, Heatmap showing expression of top gene weights in top-scoring cells of each prototype determined by the machine learning model. Genes listed are the top 15 weights defining human imGCs. c, Gene ontology (GO) network of biological processes of the positive gene weights defining human imGCs, colored by functionally related ontology group. Only significantly enriched nodes are displayed (one-sided hypergeometric test, false-discovery rate-adjust p value (FDR) < 0.05). The node size represents the term enrichment significance. Examples of the most significant terms per group are shown. See also Supplementary Table 5 for the list of GO terms. d, Functional protein-protein association network of the positive gene weights defining human imGCs, highlighting the first-degree neighbors (high-confidence connections) in orange related to DCX. e, Overlap of the positive gene weights defining imGCs in humans and in mice that were generated by separate machine learning models. See Supplementary Table 4 for the lists of genes. f, g, Immunohistological analysis showing Stmn1 enrichment in immature neurons in the adult mouse dentate gyrus. Shown are sample confocal images (f) and quantification (g) of Stmn1 expression in imGCs in the adult mouse hippocampus. Individual dots represent value of quantification for different sections (f). Scale bars, 10 μm. Box plots similar as in Fig. 1g (n = 4 mice) (g).
Extended Data Fig. 5 |
Extended Data Fig. 5 |. Specificity of the machine learning approach for identification of human immature neurons.
The fractions of cells with high similarity scores (p ≥ 0.85) among non-GC excitatory neuron (a), GABA interneuron (b), and non-neuronal cell (c) clusters in various scRNA-seq/snRNA-seq datasets of the human brains. Box plots represent mean ± s.e.m. with whiskers for max and min. See Supplementary Tables 1, 2, 3 for the specimens used in ours and all published datasets.
Extended Data Fig. 6 |
Extended Data Fig. 6 |. Immunohistological analysis of STMN1 enrichment in human imGCs across the lifespan.
a-d, Sample confocal images (a, b) and quantifications (c, d) of imGCs in the human dentate gyrus across the lifespan. Asterisks indicate DCX+ or CALB1 among STMN1+PROX1+ GCs (a, b). Box plots similar as in Fig. 1g (n = 4 subjects each group) (c, d). The immunohistological signal of STMN1 was noticeably more robust than that of DCX in adult specimens. e, f, Sample confocal images showing NEUROD1+, NEUN+ (e), S100B, or OLIG2 (f) among STMN1+PROX1+ imGCs in infant or adult human dentate gyrus, confirming their neuronal identity. Asterisks indicate STMN1+PROX1+ imGCs (n = 1 specimen for each immunostaining). All scale bars, 10 μm.
Extended Data Fig. 7 |
Extended Data Fig. 7 |. Age-dependent transcriptomic dynamics are specific to human imGCs.
a-c, In contrast to human imGCs (Fig. 3f), pseudo-age cell alignment of human mature (a), mouse immature (b), and mouse mature (c) GCs shows very little age-related divergence, visualized as scatter plots. Cells were colored by age group. Distribution of cells within each age group on the pseudo-age trajectory is displayed in the density plots (bottom left). See summary plots in Fig. 3g. d, Summary plot comparing pseudo-age alignment (y-axis) of mouse mGCs to real age groups (x-axis), with each mGC of the different age groups plotted as a data point in the background. Data points are fitted with loess fitting (lines) with 95% confidence interval (grey shades). Pearson’s r was measured for correlation of pseudo-age and real-age groups. Mouse datasets at prenatal (E16.5), neonatal (P0), or early postnatal (P5) stages do not contain mGC populations.
Extended Data Fig. 8 |
Extended Data Fig. 8 |. Consistent expression of Neurod4 and Nfia in imGCs of the postnatal mouse hippocampus across ages.
a, b, Sample confocal immunostaining images (a) and quantification (b) of two exemplary genes that display age-dependent expression patterns in human imGCs (Fig. 3j), but consistent expression in mouse imGCs across ages. Scale bar, 10 μm (a). Box plots similar as in Fig. 1g (n = 3 mice per age group) (b).
Extended Data Fig. 9 |
Extended Data Fig. 9 |. Characterization of the slice culture system.
a, b, Sample confocal images (a) and quantification (b) of cell death and oxidative stress level measured in our human hippocampal slice culture in comparison to the post-mortem tissue, using immunohistological analysis of cleaved Caspase 3 and ATF4 (a marker of oxidative stress), respectively. Dots represent value of quantification for individual sections and boxes represent mean ± s.e.m with whiskers for max and min (n = 2 sections) (b). c, Sample confocal immunostaining images showing baseline cellular composition of slice culture and post-mortem tissue. NEUN+ neurons, IBA1+ microglia, S100B+ astrocytes, and OLIG2+ oligodendrocyte lineage cells were observed. d, Sample confocal images showing EdU-incorporated PROX1+ newborn GCs are absent of the astrocyte marker S100B or the more mature neuron marker CALB1 in slice cultures. Asterisks indicate EdU+PROX1+ GCs. For c, d, n = 1 section for each immunostaining. Scale bars: 50 μm for main panels and 10 μm for insets. e, Quantification of EdU-incorporated newborn imGCs expressing different markers in the postnatal human dentate gyrus. Box plots similar as in Fig. 1g (n = 4 subjects).
Extended Data Fig. 10 |
Extended Data Fig. 10 |. Protracted neuronal maturation leads to accumulation of immature neurons in the presence of low frequency of de novo new neuron generation.
a, Process of adult hippocampal neurogenesis,. Proliferating intermediate progenitor cells (IPCs) and neuroblasts (brown) arising from activated neural stem cells (NSCs, grey) generate new post-mitotic immature dentate granule cells (imGCs, red), which develop over time into mature dentate granule cells (mGCs, lime-green). b, An “imGC protracted maturation” model explaining how low-rate, continuous IPC generation can lead to a large number of imGCs as a reservoir, as opposed to a “fast maturation” model. The size of the imGC reservoir in the adult hippocampus depends on a number of factors at the cellular level, such as the rate of stem cell activation and IPC generation, the number of progeny each IPC generates, the percentage of progeny that survives, and the duration of imGCs remaining in the immature state, and these parameters may vary tremendously across species and ages. Here we illustrate side-by-side two schematic models showing how changing one factor, the length of imGC maturation duration, alone while keeping all other parameters the same can lead to significant differences in the outcome on the number of imGCs at a given time. For IPCs in a newly generated cohort at a given time t, they go through stereotypical developmental stages to become imGCs and then mGCs (x-axis). At time t+1, a new IPC cohort is generated (y-axis). With all other parameters the same, if the imGCs mature fast, very few imGCs will be observed at any given time (left model). In contrast, if the average length of imGC maturation duration is substantially longer, imGCs in various maturation stages accumulate over time and are present as a large population in any “snapshot” (right model). Prolonged maturation duration of new neurons in the hippocampus has been demonstrated in non-human primates using nucleotide analog tracing analysis to be at least six months and over a year. Furthermore, human induced pluripotent stem cell-derived transplanted neurons display significantly slower maturation compared to those of three non-human primates. c, d, An indifference curve qualitatively depicting different combinations of two factors, the average rate of new neuron generation (r̅g) and the average duration of imGC maturation (t̅d), to achieve an equal size of imGC reservoirs (c). Hypothetical examples shown in d. A significantly longer t̅d in the adult human hippocampus spares the system from high demand of r̅g to maintain the same size of imGC reservoir, which is a potential model to explain the seemingly counterintuitive discrepancy between the few IPCs and a large number of imGCs in our results.
Fig. 1 |
Fig. 1 |. snRNA-seq and immunohistological analyses of imGCs in the human infant hippocampus.
a, A schematic illustration of the experimental design. HIP: hippocampus; NSC: neural stem cell; IPC: intermediate neural progenitor cell; NB: neuroblast; imGC: immature granule cell; mGC: mature granule cell; CTX: cortex; OLF: olfactory epithelium; FrCTX: frontal cortex; VisCTX: visual cortex; CBL: cerebellum; MTG: middle temporal gyrus of cortex. b, UMAP visualization of 15,434 nuclei from four human infant hippocampal specimens, colored by cluster. The GC cluster is highlighted with a dashed line cicle. mOli: mature oligodendrocyte; OPC: oligodendrocyte precursor cell; Astro: astrocyte. c, Wheel plot visualizing scores of each cell to each prototype by the machine learning model. Dots represent individual cells whose distance to each prototype is proportional to the similarity score of that prototype. Each black line indicates a similarity score of 0.85 to each prototypical cell type. d, Transcriptional congruence between the corresponding mouse and human cell types measured by a multi-class random forest classifier, trained on different human cell types. Confusion matrix plot indicates the percentage of cells of a given mouse cell cluster (row, based on published annotations) assigned to a corresponding human cell type (column, classified by the machine learning model). e, Comparison of positive gene weights defining imGCs in humans and mice generated by separate machine learning models. f, g, Sample confocal immunostaining images (f) and quantification (g) of STMN1 enrichment in imGCs in the human infant hippocampus. Scale bars, 10 μm. Asterisks indicate DCX+ or CALB1 among STMN1+PROX1+ cells (f). Dots represent data from individual sections and box values represent mean ± s.e.m. with whiskers for max and min (n = 4 subjects) (g).
Fig. 2 |
Fig. 2 |. snRNA-seq analysis of human imGCs across ages.
a, UMAP plots showing scRNA-seq/snRNA-seq datasets of human brain specimens colored by four broad cell classes (top rows) and by similarity score to prototypical imGCs (bottom rows). Datasets named in bold were integrated and are shown in aggregate for each age group (with 4 or 5 subjects for each age). GW: gestational week; yrs: years. b, Quantification of proportions of imGCs (with similarity scores p ≥ 0.85) among all GCs in each human hippocampal specimen across ages. Prenatal and postnatal data points are fitted separately with generalized linear model fitting (two black lines) with 95% confidence interval (grey shades). Datasets of 40 to 92 years-old specimens are highlighted in the inset. c, Pearson correlation of gene expression of the corresponding mouse and human imGCs and mGCs.
Fig. 3 |
Fig. 3 |. Common and divergent molecular features of imGCs across lifespan and between humans and mice.
a, Common enriched genes in human imGCs or mGCs across ages (two-sided Wilcoxon rank-sum test, false-discovery rate (FDR)-adjust p-value < 0.05). b, Top GO term groups for common human imGC-enriched genes. reg.: regulation; dev.: development. c. Scatter plot (left) of log2 fold-change (FC) between imGCs and mGCs and violin plots (right) of exemplary genes. d, Venn diagram of imGC-enriched genes in humans and mice. e, Unique features of imGC- and mGC-enriched genes in humans and mice. f, g, Pseudo-age alignment of human imGCs colored by age group, in scatter (left) or density (right) plots (f) and summarized (g). Dots representing imGCs in each age group are fitted with loess fitting (lines) with 95% confidence interval (grey shades) with Pearson’s r for correlations of pseudo- and real-age groups (g). h, i, Distinct patterns of age-dependent gene expression in human imGCs (h, likelihood ratio test, Benjamini-Hochberg-adjusted p, q < 0.01) and representative GO terms (i, one-sided Fisher’s exact test, p(FDR) < 0.05). j, Sample confocal immunostaining images and quantification of two exemplary genes displaying age-dependent expression in human imGCs. Scale bar, 10 μm. Dot plots showing gene expression values similar as in g. Box plots similar as in Fig. 1g (n = 3 subjects per group). k, Exemplary ligand-receptor pairs of imGCs interacting with neighboring cell types (using CellPhoneDB) with age-dependent gene expression changes (two-sided Moran’s I test, p (Bonferroni) < 0.05; n = 28 specimens). Dots represent mean expression of the ligand-receptor pair for the cell type pair in each specimen with fitting similar as in g. Box plots represent median ± quantiles with whiskers for max and min. l, Enrichment patterns of brain disorder risk gene expression in human imGCs and mGCs across the lifespan (one-sided Fisher’s exact test; p(FDR) < 0.05). EPI: epilepsy; MDD: major depressive disorder; SCZ: schizophrenia.
Fig. 4 |
Fig. 4 |. Reduced number and altered gene expression of imGCs in AD patients.
a, b, UMAP plots of the integrated dataset of AD patients and controls (Ctrl) colored by cluster (a) and broad cell class (top row) and similarity score to prototypical imGCs (bottom row) (b). c, Quantifications of proportions of imGCs among GCs (top) and GCs among total cells obtained per specimen (bottom). Each dot represents data from one specimen and boxes represent mean ± s.e.m. with whiskers for max and min (n = 8 and 13 subjects for AD and control, respectively; *: p = 0.0197; n.s., not significant; one-tailed Mann-Whitney test). d, e, GO terms (d) and examples (e) of genes downregulated in imGCs in AD. f, Quantifications of numbers of significant ligand-receptor pairs of imGCs interacting with neighboring cell types (using CellPhoneDB). Each dot represents data from one specimen. Values represent mean + s.e.m. (n = 8 and 13 subjects from AD and controls, respectively; *p < 0.05; **p < 0.005; p-value of significant pairs from left to right: 0.013, 0.001, 0.017, and 0.012; one-tailed Mann-Whitney test).
Fig. 5 |
Fig. 5 |. Capacity for neurogenesis in the postnatal human hippocampus across ages.
a-d, Sample confocal immunostaining images (a, b) and quantifications (c, d) of PROX1+ neuronal progenitors in the human dentate gyrus across ages. Scale bars, 10 μm. Asterisks indicate MKI67+ or TBR2+ among PROX1+ GCs (a, b). Each dot represents the sum value of quantification of multiple sections from one specimen (n = 10 specimens) (c, d). e-g, A slice culture system demonstrating capacity for neurogenesis in the adult human dentate gyrus. Shown are a schematic illustration of the experimental procedure (e), a sample image of a well containing three slices (f; scale bar, 1 cm), and sample confocal staining images (g) of EdU-incorporated newborn imGCs expressing different markers in the postnatal human dentate gyrus. Scale bars, 100 μm (low-magnification images) and 10 μm (insets 3, 4) (g).

References

    1. Gage FH Adult neurogenesis in mammals. Science 364, 827–828, doi: 10.1126/science.aav6885 (2019). - DOI - PubMed
    1. Ming GL & Song H Adult neurogenesis in the mammalian brain: significant answers and significant questions. Neuron 70, 687–702, doi: 10.1016/j.neuron.2011.05.001 (2011). - DOI - PMC - PubMed
    1. Terreros-Roncal J et al. Impact of neurodegenerative diseases on human adult hippocampal neurogenesis. Science 0, doi:: 10.1126/science.abl5163 (2021). - DOI - PMC - PubMed
    1. Christian KM, Song H & Ming GL Functions and dysfunctions of adult hippocampal neurogenesis. Annual review of neuroscience 37, 243–262, doi: 10.1146/annurev-neuro-071013-014134 (2014). - DOI - PMC - PubMed
    1. Moreno-Jimenez EP et al. Adult hippocampal neurogenesis is abundant in neurologically healthy subjects and drops sharply in patients with Alzheimer’s disease. Nature medicine 25, 554–560, doi: 10.1038/s41591-019-0375-9 (2019). - DOI - PubMed

MeSH terms