. 2022 Jul;607(7919):540-547.
doi: 10.1038/s41586-022-04918-4. Epub 2022 Jul 6.

Single-cell roadmap of human gonadal development

Affiliations

Single-cell roadmap of human gonadal development

Luz Garcia-Alonso et al. Nature. 2022 Jul.

Abstract

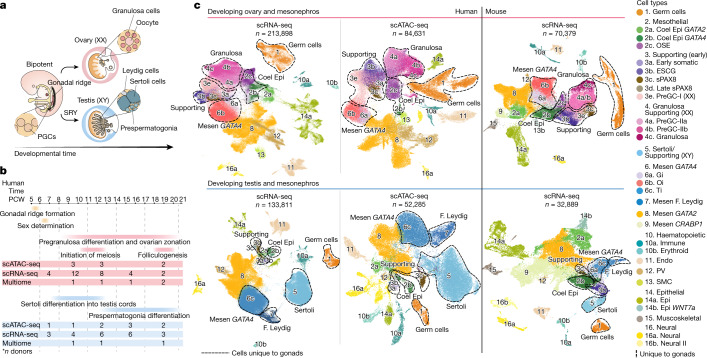
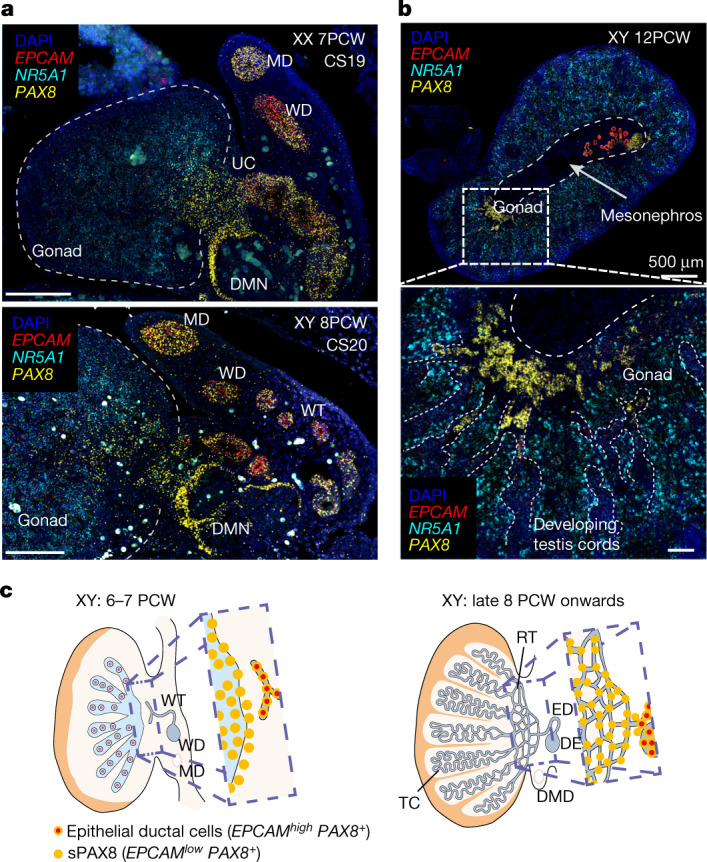
Gonadal development is a complex process that involves sex determination followed by divergent maturation into either testes or ovaries1. Historically, limited tissue accessibility, a lack of reliable in vitro models and critical differences between humans and mice have hampered our knowledge of human gonadogenesis, despite its importance in gonadal conditions and infertility. Here, we generated a comprehensive map of first- and second-trimester human gonads using a combination of single-cell and spatial transcriptomics, chromatin accessibility assays and fluorescent microscopy. We extracted human-specific regulatory programmes that control the development of germline and somatic cell lineages by profiling equivalent developmental stages in mice. In both species, we define the somatic cell states present at the time of sex specification, including the bipotent early supporting population that, in males, upregulates the testis-determining factor SRY and sPAX8s, a gonadal lineage located at the gonadal-mesonephric interface. In females, we resolve the cellular and molecular events that give rise to the first and second waves of granulosa cells that compartmentalize the developing ovary to modulate germ cell differentiation. In males, we identify human SIGLEC15+ and TREM2+ fetal testicular macrophages, which signal to somatic cells outside and inside the developing testis cords, respectively. This study provides a comprehensive spatiotemporal map of human and mouse gonadal differentiation, which can guide in vitro gonadogenesis.


Conflict of interest statement

The authors declare no competing interests.

Figures

Fig. 1
Fig. 1. Human–mouse harmonized single-cell atlases of gonadal and extragonadal tissue.
a, Schematic illustration of gonadal development showing the main structures of the XX and XY gonads. b, Diagram summarizing the stage and sex composition of our sample cohort along with main events occurring during gonadogenesis. c, Top shows the UMAP of cell lineages (colour) in the human female scRNA-seq (n = 213,898), human female scATAC-seq (n = 84,631) and mouse female scRNA-seq (n = 70,379) datasets. Bottom shows UMAP projections of cell lineages (colour) in the human male scRNA-seq (n = 133,811), human male scATAC-seq (n = 52,285) and mouse male scRNA-seq (n = 32,889) datasets. Clusters for mesothelial, supporting and gonadal mesenchymal LHX9+ cells were defined in an independent per-lineage reanalysis and projected onto this dataset (Fig. 3). Dashed lines outline the cell populations unique to the gonads. Doublets and low-quality control cells were removed. CoelEpi, coelomic epithelium; Endo, endothelial; Epi, epithelial; F. Leydig, fetal Leydig; Gi, gonadal interstitial; Mesen, mesenchymal; Oi, ovarian interstitial; OSE, ovarian surface epithelium; preGC, pregranulosa cells; PV, perivascular; sPAX8, supporting PAX8 +; Ti, testicular interstitial; SMC, smooth muscle cell.
Fig. 2
Fig. 2. New gonadal somatic cells during sex determination in humans and mice.
a, UMAP of somatic cell states (colour) in the human scRNA-seq (n = 191,230), human scATAC-seq (n = 74,592) and mouse scRNA-seq (n = 45,468) datasets. Doublets and low-quality control cells were removed. b, Dot plots show the variance-scaled, log-transformed expression of genes (x-axis) characteristic of the first wave of somatic cells (y-axis) in humans and mice. c, UMAP of somatic cells overlaid with RNA velocity maps in two humans (7 PCW testis; 7.5 PCW ovary) and two mice (E11.5 testis, E12.5 ovary) gonadal samples, analysed independently. d, Relative proportions of human and mouse somatic cell states (colour) profiled with scRNA-seq, classified by sex and developmental stage. Black arrows highlight the ESGCs. e, Dot plot showing the variance-scaled, log-transformed expression of human-specific early somatic and ESGC markers (x-axis) in the first wave of human supporting cells (y-axis). CoelEpi, coelomic epithelium; Gi, gonadal interstitial; Oi, ovarian interstitial; preGC, pregranulosa cells; sPAX8, supporting PAX8; Ti, testicular interstitial.
Fig. 3
Fig. 3. Supporting-like PAX8+ (sPAX8) gonadal lineage forms the rete testis.
a, High-resolution large-area imaging of representative gonadal sections (transverse) of a human ovary (7 PCW, CS19; top) and testis (8 PCW, CS20; bottom), with intensity proportional to smFISH signal for EPCAM (red, epithelial), NR5A1 (cyan, gonadal somatic) and PAX8 (yellow, sPAX8 and epithelial) (n = 2); red blood cells appear as bright autofluorescent cells. b, High-resolution large-area imaging of representative gonadal sections of one human testis (12 PCW, transverse section), with intensity proportional to smFISH signal for EPCAM (red, epithelial), NR5A1 (cyan, gonadal somatic) and PAX8 (yellow, sPAX8 and epithelial) (n = 2). White dashed rectangles highlight enlarged gonadal regions with PAX8high EPCAMlow expression. c, Schematic representation of sPAX8 cells in the human testis at two developmental stages. DE, ductus epididymidis; DMD, degenerating Müllerian duct; DMN, degenerating mesonephric nephron; ED, efferent ductule; MD, Mullerian duct; RT, rete testis; TC, testis cords; UC, urogenital connection; WD, Wolffian duct; WT, Wolffian tubules; scale bars, 100 µm unless otherwise specified.
Fig. 4
Fig. 4. Transcriptional, spatiotemporal and paracrine signatures of human pregranulosa cells.
a, Dot plots show the variance-scaled, log-transformed expression of genes (x-axis) characteristic of ovarian supporting cells (y-axis) in human scRNA-seq data. Top layer groups marker genes by categories. b, Spatial mapping of granulosa cell types from the scRNA-seq human dataset to spatial transcriptomics slide of 11, 14, 17 and 19 PCW ovaries using cell2location; n = 2. Estimated cell abundance (colour intensity) for OSE, preGC-I, preGC-IIa, preGC-IIb and developing granulosa cells (colour) in each Visium spot shown over the haematoxylin and eosin (H&E) images. The black rectangles highlight enlarged ovarian regions with forming follicles (top right). Schematic representation of the spatial organization of pregranulosa cell states in the human ovary (bottom right). Scale bars 1 mm (left) and 50 µm in magnified regions (right). c, Heatmaps showing expression of selected TFs across human, macaque and mouse ovarian supporting cells. Colour proportional to scaled log-transformed expression. For human ovarian supporting cells only, 'o' denotes TF whose binding motifs are differentially accessible (that is, TF can bind their potential targets); 'a' denotes TF whose targets are also differentially expressed (that is, differentially activated TF) and asterisk denotes TF that meets both 'o' and 'a' conditions. Conservation heatmap (right) highlights significant overexpression (log2 fold change > 0 and FDR < 0.05) in each species. TFs whose upregulation is conserved across species are highlighted with bold/coloured labels. d, Dot plots showing scaled z scored expression of genes coding for interacting ligand–receptor proteins (CellPhoneDB) in supporting and germ cell states in the outer cortex, inner cortex and primordial follicles. Specific interacting partners are linked with a matching symbol. CoelEpi, coelomic epithelium; Expr, expressed; FGC, fetal germ cells; preGC, pregranulosa cells; granulosa, developing granulosa.
Fig. 5
Fig. 5. Tissue-resident macrophages in the developing testes.
a, UMAP of immune cell states (colour) in the human scRNA-seq data (n = 20,556). Doublets and low-quality control cells were removed. Eleven samples were enriched for immune (CD45+) cells. Zoomed-in UMAPs show SIGLEC15+ and TREM2+ fetal testicular macrophages (ftMs) labelled by sex. b, Dot plot showing variance-scaled, log-transformed expression of marker genes (y-axis) for the identified macrophage subsets (x-axis). c, UMAP projections of integrated myeloid cells (colour) from several embryonic/fetal tissues (n = 58,948). Zoomed-in UMAPs show osteoclast and microglia signature macrophages labelled by tissue of origin. d, High-resolution imaging of representative human gonadal sections with intensity proportional to smFISH signal for RNA markers. Left, 12 PCW testis and ovary stained for CD68 (yellow, macrophages), F13A1 (red, tissue-repair macrophages) and NR2F2 (cyan, mesenchymal) (n = 2). Middle, 12 PCW testis stained for PDGFRA (green, mesenchymal), CDH5 (cyan, endothelial), CD68 (red, macrophages) and SIGLEC15 (yellow, SIGLEC15+ ftMs). SIGLEC15+ ftMs (white arrows) are outside the testis cords in proximity to endothelial cells (n = 5). Right, 8 PCW testis stained for SOX9 (magenta, Sertoli (n = 5)), POU5F1 (magenta, PGCs (n = 2)), CD68 (red, macrophages), P2RY12 (yellow, TREM2+ ftMs) and PDGFRA (cyan, mesenchymal). TREM2+ ftMs (white arrows) are adjacent to the germ and Sertoli cells. White dashed rectangles highlight gonadal regions magnified; scale bars, 100 and 10 µm in magnified regions; testicular developing cords are delineated with dashed lines. e, Schematics illustrating the spatial location of the distinct testicular macrophage populations. cDC, conventional dendritic cells; ftM, fetal testicular macrophages; ILC, innate lymphoid cells; mega, megakaryocytes; MEMP, megakaryocyte-erythroid-mast cell progenitors; mono, monocytes; neutro, neutrophils; NMP, neutrophil-myeloid progenitors; NK, natural killer cells; pDC, plasmacytoid dendritic cell; prec, precursor; Pre-B, pre-B cells; Pre-pro-B, pre-pro-B cells; Pro-B, pro-B cells; prog, progenitor; T, T cells.
Extended Data Fig. 1
Extended Data Fig. 1. Quality control of scRNA-seq data of the human developing ovaries and testes.
a, Schematic representation of the computational workflow used to analyse scRNA-seq data. b, UMAP (uniform manifold approximation and projection) of the male and female human (left) and mouse (right) scRNA-seq datasets labelled by donor and sample. Dots from the same donor or sample share a colour. For female mouse scRNA-seq data, an additional UMAP is coloured by the study of origin. c, Barplot showing the proportions of human (top) and mouse (bottom) cells profiled with scRNA-seq coloured by lineage and classified by sex and developmental stage (indicated in post-conceptional weeks (PCW) or embryonic (E) / postnatal (P) days). d, Dot plots showing the variance-scaled, log-transformed expression of genes (X-axis) characteristic of the main lineages (Y-axis) detected in male and female human (top) and mouse (bottom) scRNA-seq datasets. Top-layer groups marker genes by categories. Lineages unique to developing ovaries and testes are highlighted with "*". e, Predicted cell annotations from Li et al. 2017 scRNA-seq analysis of human gonads on our human scRNA-seq dataset. Labels were transferred using scmap separately for females (left) and males (right), with a cutoff of 0.5. Cells that do not pass the 0.5 cutoff are labelled as “unassigned”. Colour legend for the main lineages match those in Extended Data Fig. 1c. f, Boxplot showing the predicted probabilities of human cell types transferred with a Support Vector Machine (SVM) model onto manually annotated mouse cell types around the time of sex determination (n = 29,297 cells; left) for both females and males, or considering all developmental stages combined for ovaries (n = 70,379 cells; middle) and testes (n = ; 32,889; right) separately. The box extends from the lower to upper quartile values of the data, with a line at the median. The whiskers extend from the box to show the range of the data. Flyer points are those past the end of the whiskers. CoelEpi = coelomic epithelium; E = embryonic day; Endo = endothelial; Epi = epithelial; FGC = fetal germ cells; P = postnatal day; PCW = post-conceptional weeks; SMC = smooth muscle cells; Soma = somatic; PV = perivascular; Mese = mesenchymal. Source data
Extended Data Fig. 2
Extended Data Fig. 2. Analysis of the chromatin accessibility landscape of the human developing ovaries and testes.
a, Schematic representation of the computational workflow used to analyse human scATAC-seq data. b, UMAP (uniform manifold approximation and projection) of female (top) and male (bottom) human scATAC-seq datasets labelled by donor and post-conceptional weeks (PCW). Dots from the same donor share a colour. c, Heatmap reporting label transfer scores from human scRNA-seq to scATAC-seq female (left) and male (right) data of matched individuals. Colour intensity corresponds to the average of the label transfer scores for all cells in each annotated cell type. d, UMAP projections of female (left) and male (right) human scATAC-seq datasets labelled by the cell lineage identified in snRNA-seq data from the cell-coupled snRNA-seq/snATAC-seq profiling. Only gonadal tissue was included in the combined snRNA-seq/scATAC-seq assay. CoelEpi = coelomic epithelium; ESGC = early supporting gonadal cells; GC = germ cells; Mesen = mesenchymal; OSE = ovarian surface epithelium; PCW = post-conceptional weeks; PGC = primordial germ cells; preGC = pregranulosa cells; PV = perivascular; SMC = smooth muscle cell; sPAX8 = supporting PAX8.
Extended Data Fig. 3
Extended Data Fig. 3. Gonadal and extragonadal location of mesenchymal and mesothelial cells.
a, UMAP (uniform manifold approximation and projection) of human (left) and mouse (right) scRNA-seq datasets labelled by cell lineage and tissue location. b, Spatial mapping of mesenchymal cell types from the human scRNA-seq dataset to a spatial transcriptomics slide of a late 8 post-conceptional weeks (PCW) testis, a 12 PCW testis and an 11 PCW ovary with cell2location. Estimated abundance for cell types (colour intensity) contributed by each mesenchymal subpopulation to each Visium spot (colour) shown over the H&E images. Scale bars = 1 mm; n = 2. c, High-resolution imaging of a representative gonadal section (sagittal) of a human XY fetal gonad (Carnegie stage, (CS)17). Intensity proportional to smFISH signal for UPK3B (red, coelomic epithelium), GATA4 (yellow, intra-gonadal) and GATA2 (cyan, extra-gonadal); n = 5. The white dashed rectangles (left) highlight the enlarged sample region (right). Scale bars = 100 µm (left) and 10 µm in magnified regions (right). d, Dot plot showing the variance-scaled, log-transformed expression of transcription factors (TFs) with mutually exclusive expression in gonadal and extragonadal mesenchymal and mesothelial cells in human and mouse scRNA-seq data. e, Spatial plot showing the variance-scaled, log-transformed expression of TF with mutually exclusive expression in gonadal and extragonadal mesenchymal cells over the H&E images of a late 8 PCW testis, a 12 PCW testis and an 11 PCW ovary; n = 2. Scale bars = 1 mm. CoelEpi = coelomic epithelium; Endo = endothelial; Epi = epithelial; G = gonad; Gi = gonadal interstitial; M = mesonephros; Mese = mesenchymal; Oi = ovarian interstitial; PV = perivascular cell; SMC = smooth muscle cell; Ti = testicular interstitial.
Extended Data Fig. 4
Extended Data Fig. 4. Characterisation of germ cell states.
a, UMAP (uniform manifold approximation and projection) of germ cell in the human (top; n = 10,993), mouse (middle; n = 10,411) and external macaque (bottom: n = 2,685) scRNA-seq datasets labelled by germ cell states, sex, donor/sample identity and developmental stage indicated in post-conceptional weeks (PCW) or embryonic (E) / postnatal (P) days). Doublets and low QC cells removed. b, Downsampled UMAP for human germ cells to account for up to 50 cells per donor (colour) for confirmatory visualisation. c, Dot plots showing the variance-scaled, log-transformed expression of genes characteristic of fetal oogenesis in the human (top), mouse (middle) and macaque (bottom) germ cells scRNA-seq data. d, Relative proportion of human germ cell states (colour) profiled with scRNA-seq, classified by sex and developmental stage. e, t-SNE (t-distributed stochastic neighbour embedding) projection of scRNA-seq data of human germ cells coloured by Palantir pseudo-time and probability of cells to progress from the PGC status. Germ cells are downsampled to account for 500 cells for each germ cell state. E = embryonic day; FGC = fetal germ cells; P = postnatal day; PCW = post-conceptional weeks; PGC = primordial germ cells.
Extended Data Fig. 5
Extended Data Fig. 5. Cross species TF comparison of germ cells.
a, UMAP of germ cell states (colour) in the human scATAC-seq (n = 8,901) dataset. Doublets and low QC cells removed. b, Heatmap reporting label transfer scores from human scRNA-seq to scATAC-seq germ cell data of matched individuals. c, UMAP of germ cells in the human scATAC-seq dataset labelled by cell state identified in snRNA-seq data from the cell-coupled snRNA-seq/snATAC-seq profiling. d, Hierarchical clustering of transcription factor (TF) binding activity scores in each human germ cell type estimated from scATAC-seq data. e, Heatmaps showing the expression of human-relevant transcription factors (TF) in human, macaque and mouse germ cells. Colour proportional to scaled log-transformed expression. For human germ cells only: “o” = TF whose binding motifs are differentially accessible (i.e. TF can bind their potential targets); “a” = TF whose targets are differentially expressed (i.e. differentially activated TF); and asterisk (*) = TF that meets both “o” and “a” conditions. Conservation heatmap (right) highlights significant overexpression (log2-fold change > 0 and FDR < 0.05) in each species. TFs whose upregulation is conserved across species are highlighted with bold/coloured labels. f, High-resolution imaging of a representative transverse section of a human ovary at 21 post-conceptional weeks (PCW), with intensity proportional to smFISH signal for POU5F1 (green, primordial germ cells), DDX4 (red, fetal germ cells), STRA8 (cyan, pre-meiotic germ cells) and FIGLA (yellow, oocytes); n = 4. The white dashed rectangle highlights the enlarged gonadal region. Scale bars = 100 µm. g, cell2location estimated cell abundance (colour intensity) contributed by each germ cell to each Visium spot (colour) shown over the H&E image of a 19 PCW ovary; n = 2. Scale bars = 1 mm. E = embryonic day; Expr = expressed, FGC = fetal germ cells; P = postnatal day; PCW = post-conceptional weeks; PGC = primordial germ cells.
Extended Data Fig. 6
Extended Data Fig. 6. Human-mouse comparison and trajectory inference of early gonadal somatic cells.
a, UMAP (uniform manifold approximation and projection) of gonadal somatic cells in the human (top) and mouse (bottom) scRNA-seq datasets coloured by sample of origin, sex and developmental stage (indicated in post-conceptional weeks (PCW) or embryonic (E) / postnatal (P) day). Dots from the same donor or sample share a colour. b, UMAP projections of the fate probabilities of each cell ending up in one of the terminal states (scRNA-seq). Coloured symbols indicate the initial and terminal cell states predicted by CellRank. Top UMAPs depict two human (7 post-conceptional weeks, PCW testis; 7.5 PCW ovary) gonadal samples while bottom UMAPs depict two mouse (E11.5 testis and E12.5 ovary) gonadal samples, analysed independently. c, t-SNE (t-distributed stochastic neighbour embedding) projection of somatic cells coloured by Palantir pseudo-time and probability of cells to progress from the gonadal coelomic epithelium GATA4+ in humans between 6-8.5 PCW (left) and mice at E10.5-E11.5 (right). Somatic cells are downsampled to account for 150 cells for each cell state in each sex in both species. d, (left) UMAP projections of the predicted probability of ESGC from our dataset onto Guo et al., 2021 somatic cells manifold using a Support Vector Machine (SVM) classifier. (right) UMAP projections on the validation dataset of human fetal testis, re-analysed from Guo et al., 2021, labelled by somatic cell state. e, Barplot showing the proportions of somatic cells in the Guo et al., 2021 dataset coloured by cell state and classified by PCW. f, Dot plots showing the variance-scaled, log-transformed expression of genes characteristic of human ESGC in the Guo et al., 2021 dataset of human fetal testis. g, Dot plot showing the variance-scaled, log-transformed expression of genes in the WNT4/RSPO1 pathway in ESGC (split in male and female), preGC-I and Sertoli cells in the human (top) and mouse (bottom) scRNA-seq dataset. h, Dot plots showing the variance-scaled, log-transformed expression of human-specific markers of ESGC in the mouse scRNA-seq dataset. i, High-resolution, imaging of representative human gonadal sections with intensity proportional to smFISH signal for RNA markers. (top) Carnegie stage 19 (CS19) ovary stained for LGR5 (red, ESGC), TSPAN8 (yellow, ESGC), RIMS4 (magenta, 1st wave somatic cells), OSR1 (cyan, preGC-I). The white dashed line outlines the ovary; the white dashed rectangle highlights the enlarged gonadal region. ESGCs nuclei have been marked with dashed circles. (bottom) CS19 testis stained for LGR5 (red, ESGC), TSPAN8 (yellow, ESGC), SRY (magenta, ESGC), SOX9 (cyan, Sertoli). The white dashed line outlines the testis. The white dashed rectangle highlights the enlarged gonadal region. White arrows in the magnified areas mark ESGC nuclei; n = 2. Scale bars = 100 µm and 10 µm in magnified regions. CoelEpi = coelomic epithelium; E = embryonic day; ESGC = early supporting gonadal cells; Gi = gonadal interstitial; P = postnatal day; PCW = post-conceptional week; preGC = pre-granulosa cells; sPAX8 = supporting PAX8; Ti = testicular interstitial.
Extended Data Fig. 7
Extended Data Fig. 7. Gonadal supporting PAX8+ cells define gonadal boundaries.
a, Spatial mapping of somatic cell types from the scRNA-seq human dataset to three consecutive spatial transcriptomics slides of a 14 PCW testis using cell2location. Estimated abundance for cell types (colour intensity) contributed by each cell population to each spot (colour) shown over the H&E image; n = 3. Scale bars = 1 mm. b, UMAP (uniform manifold approximation and projection) showing mesothelial, first wave supporting and epithelial cells in human first trimester (left) and mouse embryonic day (E) E10.5-E12.5 (right) scRNA-seq data labelled by cell type, location of the tissue, sex, donor or sample and post-conceptional weeks (PCW) or stage. c, Dot plot showing the variance-scaled, log-transformed expression of genes characteristic of the mesothelial, supporting and epithelial subpopulations in human first trimester (top) and mouse E10.5-E12.5 (bottom) scRNA-seq data. d, High-resolution large-area imaging of representative gonadal section (sagittal) of a human fetal testis (7PCW, Carnegie Stage CS17) with intensity proportional to smFISH signal for GATA4 (green, gonadal), PAX8 (red, sPAX8 population) and GATA2 (cyan, extragonadal); n = 5. This sample is also shown in Extended Data Fig. 3c. e, High-resolution large-area imaging of a representative section of a mouse fetal ovary (E13.5) with intensity proportional to smFISH signal for Lgr5 (yellow, cortical pre-granulosa), Pax8 (red, sPAX8), Hmgcs2 (green, medullary pre-granulosa) and Gng13 (magenta, cortical pre-granulosa); n = 2. f, High-resolution large-area imaging of representative sections of three human fetal testes (sagittal late 8, transverse 11 and transverse 12 PCW; n = 3) with intensity proportional to smFISH signal for PAX8 (yellow, sPAX8 population), NR5A1 (cyan, interstitial Fetal Leydig), EPCAM (red, low in supporting cells, high in epithelial cells of the reproductive tubules) and KLK11 (green; coelomic epithelium). g, High-resolution large-area imaging of representative sections of two human fetal ovaries (9 and 11 PCW; n = 2) with intensity proportional to smFISH signal for the same panel in “f”. h, (left) Dot plot showing the scaled log-transformed expression of upregulated genes coding for sPAX8 ligands or receptor proteins in the supporting testis cells. (right) Dot plots showing the scaled log-transformed expression of genes coding for cognate ligand or receptor proteins in the supporting epithelial, endothelial and germ cells. Interacting partners (i.e., with binding specificity) are linked with a matching symbol. CoelEpi = coelomic epithelium; E = embryonic day; Epi = epithelial; ESGC = early supporting gonadal cells; FGC = fetal germ cells; Gi = gonadal interstitial; M = mesonephros; PCW = post-conceptional week; PGC = primordial germ cells; preGC = pre-granulosa cells; sPAX8 = supporting PAX8; Ti = testicular interstitial. For all smFISH panels, unless otherwise specified, white dashed rectangles highlight gonadal regions magnified; scale bars = 100 µm and 10 µm in magnified regions.
Extended Data Fig. 8
Extended Data Fig. 8. Second wave of fetal pre-granulosa.
a, Boxplots of the predicted probabilities (Y-axis) of the label transfer from human to mouse supporting cells (X-axis) in the ovaries around the time of the second wave of pre-granulosa cells (8-16 post-conceptional weeks (PCW) human, embryonic day (E) 12.5-E16.5 mouse, n = 10,042 cells; left) and around the time of folliculogenesis (17-21 PCW human, E18.5- postnatal day (P)5 mouse, n = 5,296 cells; right). The box extends from the lower to upper quartile values of the data, with a line at the median. The whiskers extend from the box to show the range of the data. Flyer points are those past the end of the whiskers. b, Heatmap reporting label transfer scores from human scRNA-seq to scATAC-seq somatic cell data of matched individuals. c, UMAP (uniform manifold approximation and projection) of somatic cells in the human scATAC-seq dataset labelled by the cell state identified in snRNA-seq data from the cell-coupled snRNA-seq/snATAC-seq profiling. d, Hierarchical clustering of z-scores for each cis-co-accessibility network (CCAN) identified in human ovarian supporting cells in the human scATAC-seq dataset. e, UMAP projections of somatic cells in the macaque scRNA-seq dataset re-analysed from Zhao et al., 2020 labelled by cell type and stage. f, Dot plots showing the variance-scaled, log-transformed expression of genes (X-axis) characteristic of ovarian supporting cells (Y-axis) in mouse (left) and macaque (right) scRNA-seq data. Top-layer groups marker genes by categories. g, (top) Diagram showing the information added in the updated version of CellPhoneDB database (CellPhoneDB v4), which includes: (i) 534 novel (1,852 total) ligand-receptor interactions; (ii) 194 novel interactions mediated by small molecules; (iii) 186 novel curated links between ligand-receptor and transcription factors (CellSign module). (bottom) Diagram showing the new statistical framework to infer active cell-cell interaction partners. It includes an additional step to indicate active ligand-receptor partners in our data based on the activation of downstream signals on the receiver cell (CellSign module). Downstream signals are calculated based on TF expression and TF activity from scRNA-seq and scATAC-seq data. h, Heatmap showing the expression of TF downstream the receptors (CellSign) upregulated in germ and supporting cells (shown in Fig. 4d). Colour proportional to scaled log-transformed expression. Symbols highlight TF status, as in (Fig. 4b). Specificity between receptors and the corresponding downstream TF are indicated with a symbol matching the upstream receptors in Fig. 4d. i, Dot plots showing scaled log- transformed expression of genes coding for interacting extra-cellular matrix (ECM) proteins in supporting (top) and germ (bottom) cells states. j, High-resolution imaging of representative gonadal section of a human fetal ovary (19PCW), with intensity proportional to smFISH signal for NTN1 (green, granulosa), FIGLA (yellow, oocytes), DCC (red, oocyte), FOXL2 (magenta, granulosa); n = 2. White dashed rectangles highlight follicles and the enlarged gonadal region. Scale bars = 100 µm and 10 µm in the magnified region. k, Schematic illustration of main TFs, receptors, ligands and extracellular molecules regulating germ cell differentiation influenced by the granulosa lineage. New molecules identified in our study are highlighted in green. CoelEpi = coelomic epithelium; E = embryonic day; ESGC = early supporting gonadal cells; FGC = fetal germ cells; Gi = gonadal interstitial; Oi = ovarian interstitial; OSE = ovarian surface epithelium; P = postnatal day; PCW = post-conceptional week; PGC = primordial germ cells; preGC = pre-granulosa cells; TF = transcription factor; Ti = testicular interstitial; sPAX8 = supporting PAX8. Source data
Extended Data Fig. 9
Extended Data Fig. 9. Tissue-resident macrophages in the developing testes.
a, Schematics illustrating the CD45+ enrichment strategy for gonadal and extragonadal samples. The 11 samples that were sorted with the pan-leukocyte marker CD45 are from the following developmental stages: 6, 11, 12 PCW males, and 7.5, 8.4, late 8, 9, 11, 11, 14, 17 PCW females. b, Gating strategy to sort immune cells in gonadal samples for a representative donor (F93). Cells were gated on live, singlets and CD45+. c, UMAP projections of immune cells labelled by sex, PCW and donor. d, Heatmap showing label transfer scores from the fetal liver hematopoiesis dataset (Popescu et al., 2019) to our gonadal immune dataset using a Support Vector Machine (SVM) classifier. Low probabilities assigned to neutrophils, which were not defined in the liver dataset, and to macrophages e, Dot plot showing variance-scaled, log-transformed expression of marker genes expressed in the identified immune subsets. f, Barplot showcasing the proportions of immune cells labelled by cell state and classified by sex and developmental stage. g, Barplot showcasing the proportion of cells belonging to each identified macrophage population in females and males. h, Dot plot showing the variance-scaled, log-transformed expression of microglia markers in the cluster of TREM2+ ftM in both sexes reveals that the few female cells that belong to this cluster do not express the key markers. i, Predicted probability of bone marrow osteoclasts from Jardine et al., 2021 (left) and brain microglia cells from Bian et al., 2020 (right) onto our gonadal immune manifold using a SVM classifier. j, UMAP (uniform manifold approximation and projection) of the multi-organ integrated fetal myeloid dataset labelled by tissue and donor. k, Dot plot showing variance-scaled, log-transformed expression of marker genes expressed in the identified cell populations from the multi-organ integrated fetal myeloid dataset. l, Dot plots showing variance-scaled, log-transformed expression of interacting ligands and receptors in the SIGLEC15+ and TREM2+ ftM and gonadal cell populations. Interacting partners (CellPhoneDB) are indicated with a matching symbol. m, Dot plot showing variance-scaled, log-transformed expression of immunoregulatory markers in human gonadal macrophages. cDC = conventional Dendritic cells; ECM = extracellular matrix; ESGC = early supporting gonadal cells; ftM = fetal testicular macrophages; Gi = gonadal interstitial; ILC prec = innate lymphoid cell precursors; Mac = macrophages; Mast = mast cells; Mega = megakaryocytes; MEMP = megakaryocyte-erythroid-mast cell progenitors; Mono = monocytes; Neutro = neutrophil; NMP = neutrophil-myeloid progenitors; NK = Natural Killer cells; pDC = plasmacytoid Dendritic cell; PV = perivascular; PCW = post-conceptional week; Prec = precursor; Pre_B = pre-B cells; Pre_pro_B = pre-pro-B cells; Pro_B = pro-B cells; Prob_ = probability; sPAX8 = supporting PAX8; Gi = gonadal interstitial; T = T cells; Ti = testicular interstitial.
Extended Data Fig. 10
Extended Data Fig. 10. Macrophages smFISH panels.
a, High-resolution imaging of representative sections of a fetal testes, with intensity proportional to smFISH signal for RNA markers. (left) 11 PCW testis stained for CD68 (green, macrophages), SIGLEC15 (red, SIGLEC15+ ftM), ATP6V0D2 (magenta, SIGLEC15+ ftM), ACP5 (cyan, SIGLEC15+ ftM); n = 5. (middle) 10 PCW testis stained for CD68 (green, macrophages), P2RY12 (red, TREM2+ ftM), SALL1 (yellow, TREM2+ ftM); n = 4. (right) 8 PCW testis stained for CD68 (red, macrophages), SIGLEC15 (yellow, SIGLEC15+ ftM) and P2RY12 (green, TREM2+ ftM); n = 3. b, High-resolution imaging of representative sections of two fetal testes (11 and 12 PCW), with intensity proportional to smFISH signal for EPCAM (cyan, high = epithelial cells; low = Sertoli and germ cells), PDGFRA (green, mesenchymal cells), CD68 (red, macrophages), SIGLEC15 (yellow, SIGLEC15+ ftM); n = 7. c, (top left) UMAP (uniform manifold approximation and projection) of myeloid cells from Guo et al., 2021 labelled by PCW. (bottom left) Predicted probability of SIGLEC15+ ftM from our data onto myeloid cells from Guo et al., 2021 using a Support Vector Machine classifier. (right) UMAP projections of myeloid cells from Guo et al., 2021 showing the expression of SIGLEC15+ ftM marker genes. d, High-resolution large-area imaging of a representative section of a full male embryo (Carnegie Stage CS19), with intensity proportional to smFISH signal for CD68 (green, macrophages), P2RY12 (red, TREM2+ ftM and microglia), ELAVL3 (cyan, neural cells). White dashed rectangles highlight the magnified regions from the following organs: testis (top), skin (middle), spinal cord (labelled as CNS = central nervous system) (bottom); n = 1 e, High-resolution imaging of representative gonadal sections of two fetal testes (12 and 14 PCW), with intensity proportional to smFISH signal to SOX9 (cyan, Sertoli cells), CD68 (red, macrophages), P2RY12 (yellow, TREM2+ ftM); n = 5. ftM = fetal testicular macrophages; PCW = post-conceptional week; prob_ = probability. For all smFISH panels, unless otherwise specified, white dashed rectangles highlight gonadal regions magnified; scale bars = 100 µm and 10 µm in magnified regions; developing testis cords are delineated with dashed lines.

Comment in

References

    1. Hanley, N. A. et al. SRY, SOX9, and DAX1 expression patterns during human sex determination and gonadal development. Mech. Dev.91, 403–407 (2000). - PubMed
    1. Albrecht, K. H. & Eicher, E. M. Evidence that Sry is expressed in pre-Sertoli cells and Sertoli and granulosa cells have a common precursor. Dev. Biol.240, 92–107 (2001). - PubMed
    1. Nef, S., Stévant, I. & Greenfield, A. Characterizing the bipotential mammalian gonad. Curr. Top. Dev. Biol.134, 167–194 (2019). - PubMed
    1. Maheshwari, A. & Fowler, P. A. Primordial follicular assembly in humans – revisited. Zygote16, 285–296 (2008). - PubMed
    1. Niu, W. & Spradling, A. C. Two distinct pathways of pregranulosa cell differentiation support follicle formation in the mouse ovary. Proc. Natl Acad. Sci. USA117, 20015–20026 (2020). - PMC - PubMed

MeSH terms