

Birch pollen, air pollution and their interactive effects on airway symptoms and peak expiratory flow in allergic asthma during pollen season - a panel study in Northern and Southern Sweden
- PMID: 35794604
- PMCID: PMC9258213
- DOI: 10.1186/s12940-022-00871-x
Birch pollen, air pollution and their interactive effects on airway symptoms and peak expiratory flow in allergic asthma during pollen season - a panel study in Northern and Southern Sweden
Abstract
Background: Evidence of the role of interactions between air pollution and pollen exposure in subjects with allergic asthma is limited and need further exploration to promote adequate preventive measures. The objective of this study was to assess effects of exposure to ambient air pollution and birch pollen on exacerbation of respiratory symptoms in subjects with asthma and allergy to birch.
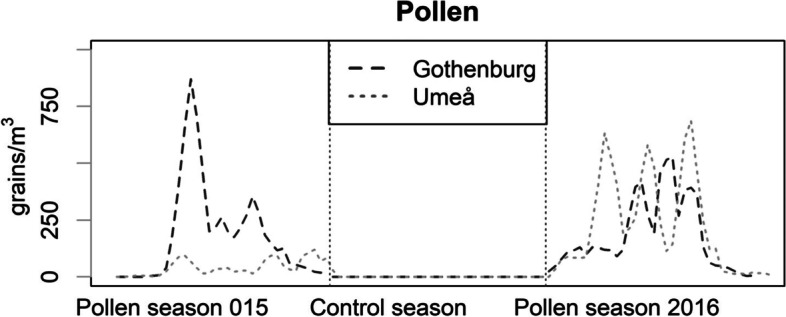
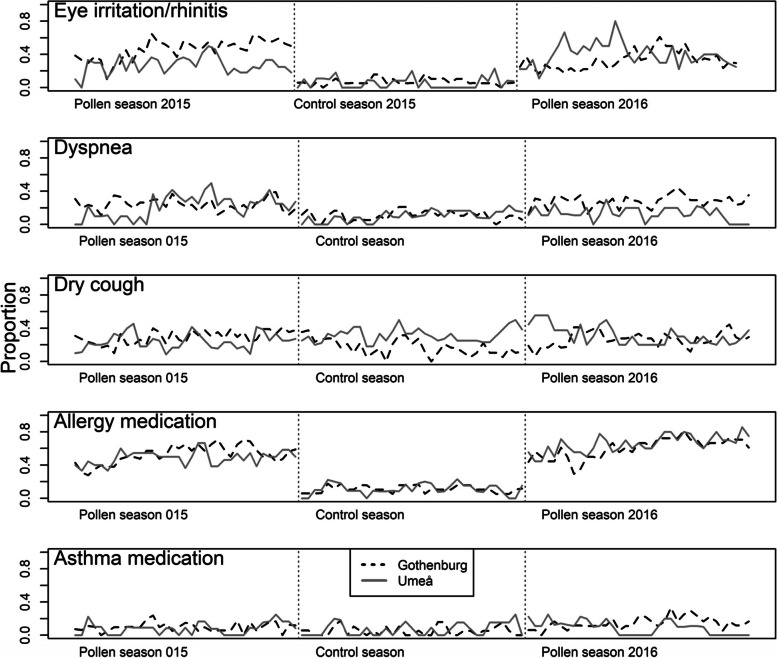
Methods: Thirty-seven subjects from two Swedish cities (Gothenburg and Umeå) with large variation in exposure to both birch-pollen and air pollutants, participated in the study. All subjects had confirmed allergy to birch and self-reported physician-diagnosed asthma. The subjects recorded respiratory symptoms such as rhinitis or eye irritation, dry cough, dyspnoea, the use of any asthma or allergy medication and peak respiratory flow (PEF), daily for five consecutive weeks during two separate pollen seasons and a control season without pollen. Nitrogen oxides (NOx), ozone (O3), particulate matter (PM2.5), birch pollen counts, and meteorological data were obtained from an urban background monitoring stations in the study city centres. The data were analysed using linear mixed effects models.
Results: During pollen seasons all symptoms and medication use were higher, and PEF was reduced in the subjects. In regression analysis, exposure to pollen at lags 0 to 2 days, and lags 0 to 6 days was associated with increased ORs of symptoms and decreased RRs for PEF. Pollen and air pollution interacted in some cases; during low pollen exposure, there were no associations between air pollution and symptoms, but during high pollen exposure, O3 concentrations were associated with increased OR of rhinitis or eye irritation, and PM2.5 concentrations were associated with increased ORs of rhinitis or eye irritation, dyspnea and increased use of allergy medication.
Conclusions: Pollen and air pollutants interacted to increase the effect of air pollution on respiratory symptoms in allergic asthma. Implementing the results from this study, advisories for individuals with allergic asthma could be improved, minimizing the morbidities associated with the condition.
Keywords: Allergic asthma; Betula; Birch; O3; PM2.5; Panel study; Pollen season.
© 2022. The Author(s).
Conflict of interest statement
The authors declare no competing interests.
Figures

References
Publication types
MeSH terms
Substances
LinkOut - more resources
Full Text Sources
Medical
