. 2022 Jul 6;15(1):85.
doi: 10.1186/s13045-022-01306-3.

Long noncoding RNA Smyca coactivates TGF-β/Smad and Myc pathways to drive tumor progression

Affiliations

Long noncoding RNA Smyca coactivates TGF-β/Smad and Myc pathways to drive tumor progression

Hsin-Yi Chen et al. J Hematol Oncol. .

Abstract

Background: Metastasis and chemoresistance are major culprits of cancer mortality, but factors contributing to these processes are incompletely understood.

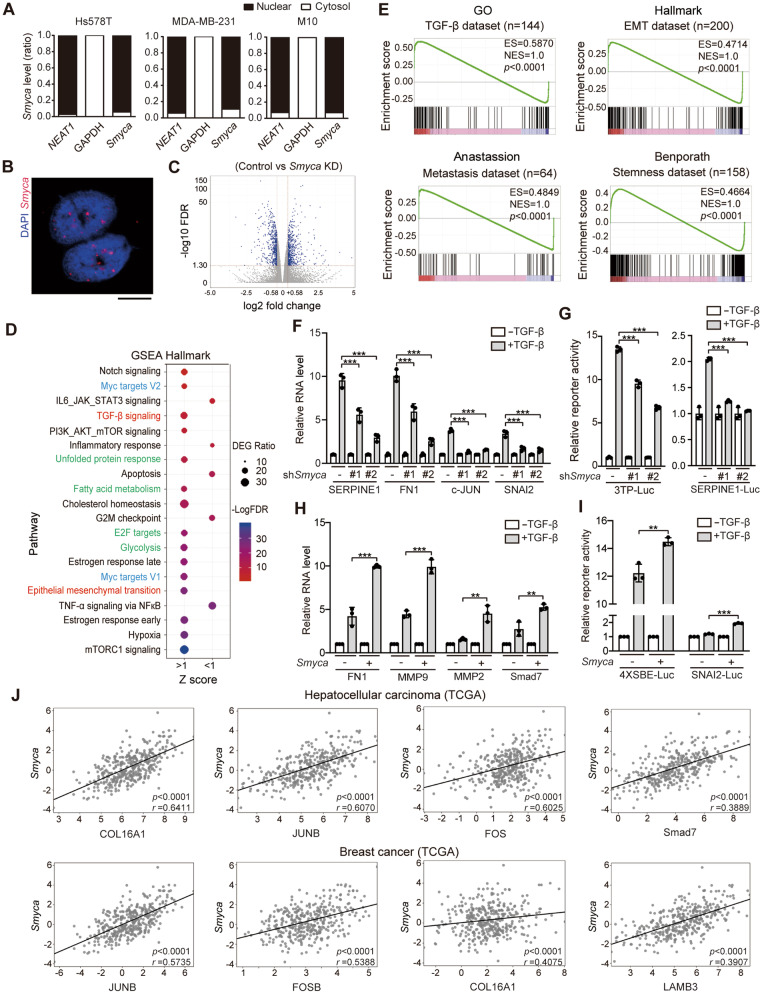
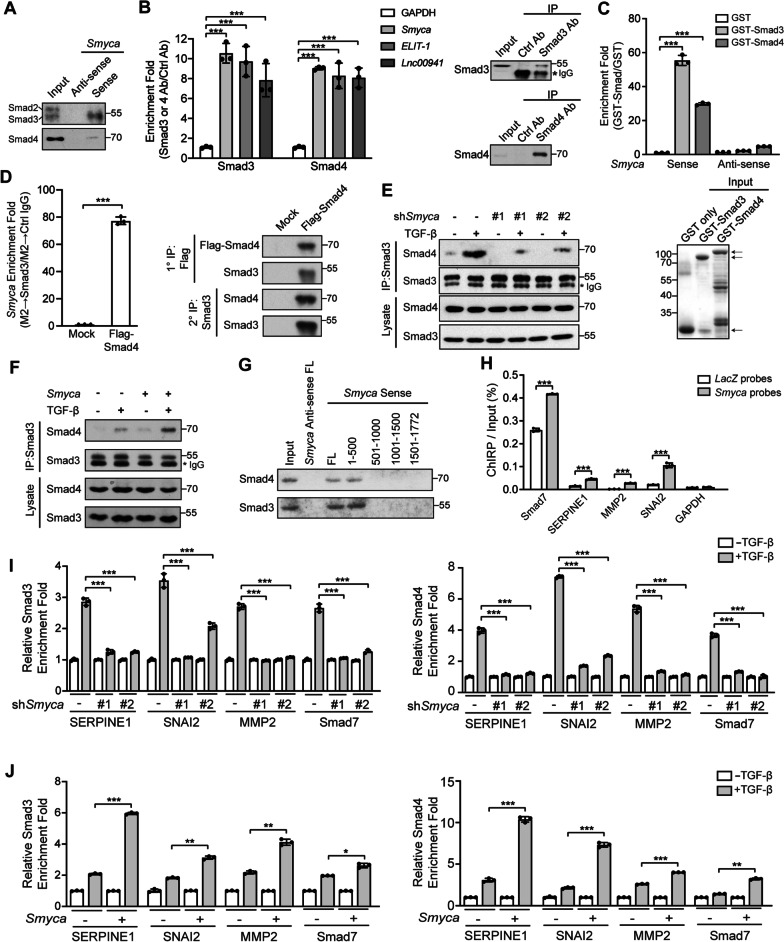
Methods: Bioinformatics methods were used to identify the relations of Smyca expression to clinicopathological features of human cancers. RNA-sequencing analysis was used to reveal Smyca-regulated transcriptome. RNA pull-down and RNA immunoprecipitation were used to examine the binding of Smyca to Smad3/4 and c-Myc/Max. Chromatin immunoprecipitation and chromatin isolation by RNA purification were used to determine the binding of transcription factors and Smyca to various gene loci, respectively. Real-time RT-PCR and luciferase assay were used to examine gene expression levels and promoter activities, respectively. Xenograft mouse models were performed to evaluate the effects of Smyca on metastasis and chemoresistance. Nanoparticle-assisted gapmer antisense oligonucleotides delivery was used to target Smyca in vivo.

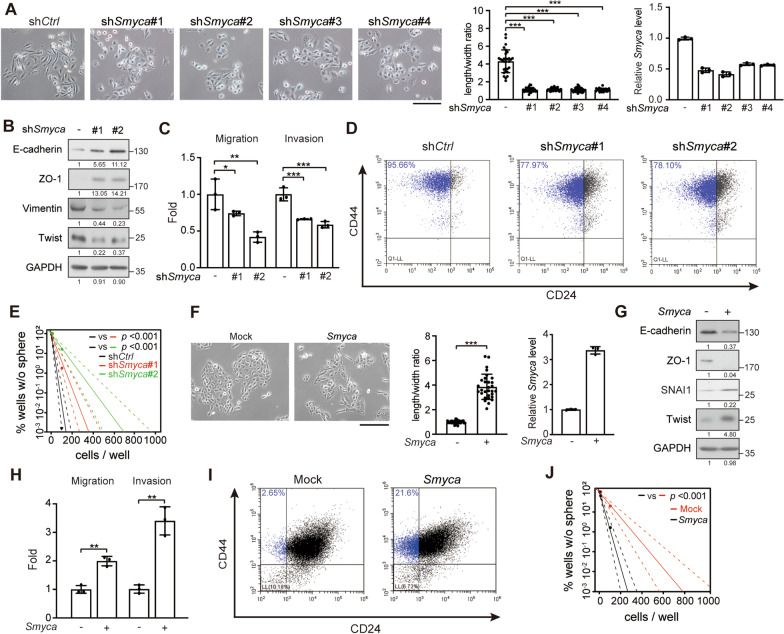
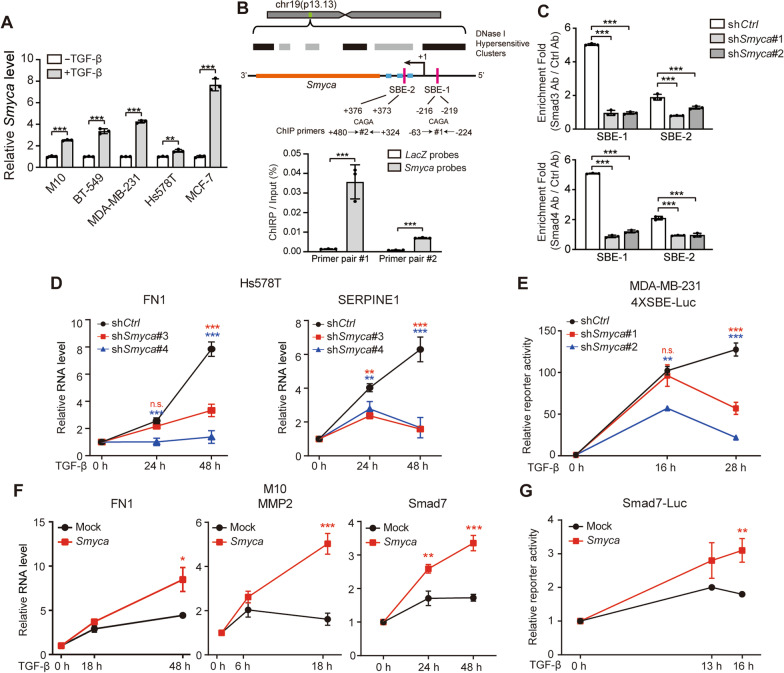
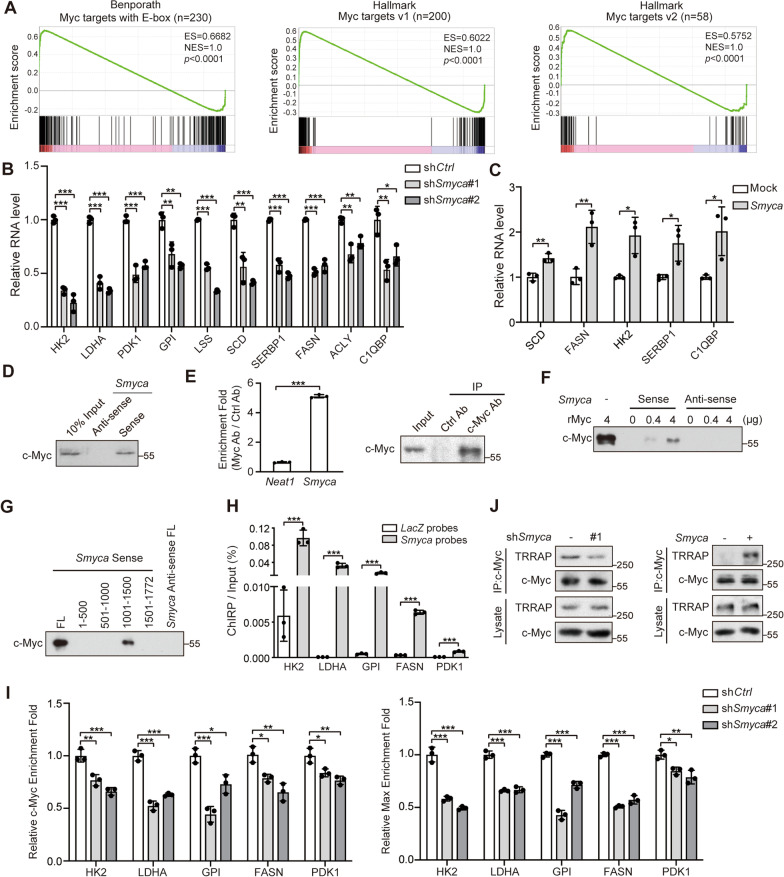
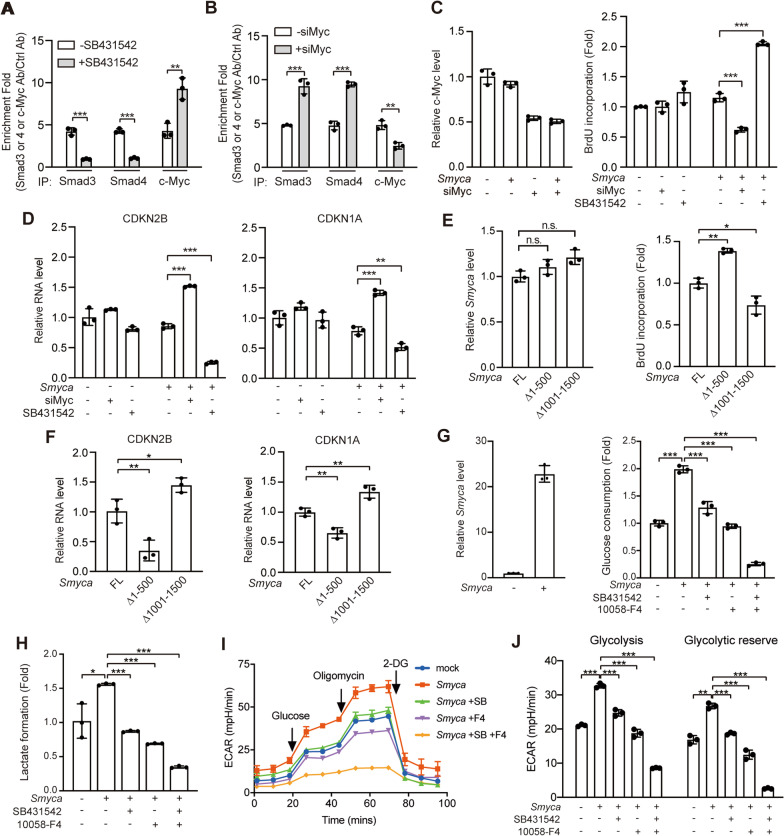
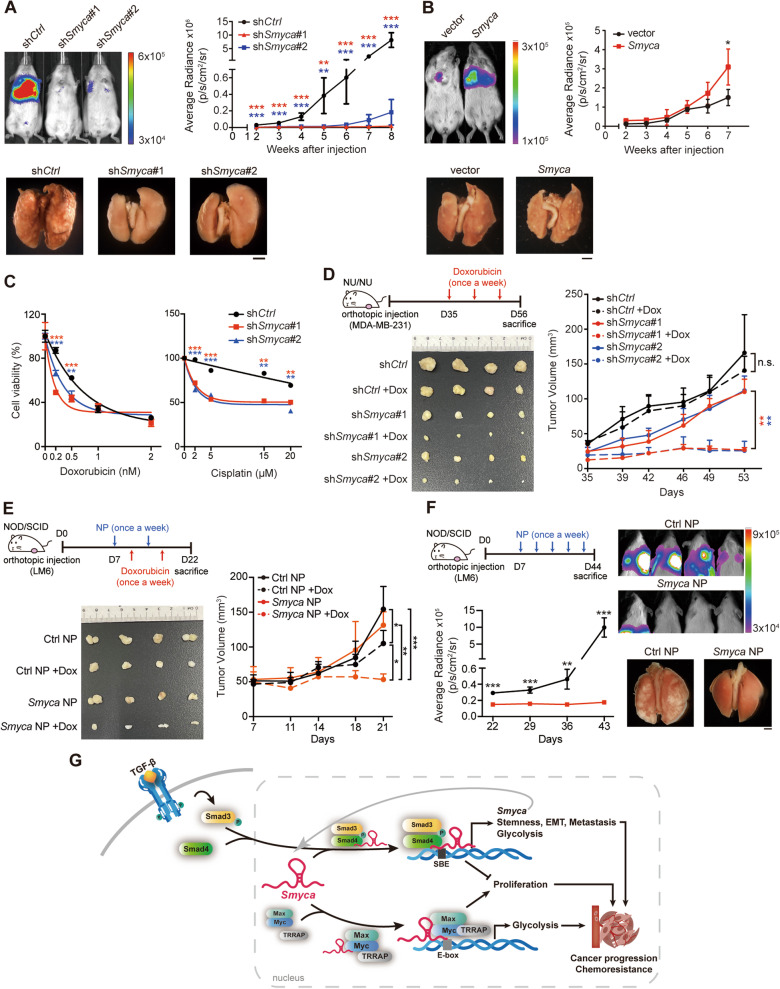
Results: We identify lncRNA Smyca for its association with poor prognosis of many cancer types. Smyca potentiates metabolic reprogramming, migration, invasion, cancer stemness, metastasis and chemoresistance. Mechanistically, Smyca enhances TGF-β/Smad signaling by acting as a scaffold for promoting Smad3/Smad4 association and further serves as a Smad target to amplify/prolong TGF-β signaling. Additionally, Smyca potentiates c-Myc-mediated transcription by enhancing the recruitment of c-Myc/Max complex to a set of target promoters and c-Myc binding to TRRAP. Through potentiating TGF-β and c-Myc pathways, Smyca synergizes the Warburg effect elicited by both pathways but evades the anti-proliferative effect of TGF-β. Targeting Smyca prevents metastasis and overcomes chemoresistance.

Conclusions: This study uncovers a lncRNA that coordinates tumor-relevant pathways to orchestra a pro-tumor program and establishes the clinical values of Smyca in cancer prognosis and therapy.

Keywords: Chemoresistance; EMT; LncRNA; Metastasis; Smad; TGF-β; c-Myc.


Conflict of interest statement

The authors declare no competing interests.

Figures

Fig. 1
Fig. 1
Smyca promotes EMT, migration, invasion and stemness. (A) Morphological assessment of MDA-MB-231 cells stably expressing four different Smyca shRNAs. Bar, 100 μm. Cell length/width ratios and Smyca expression levels (normalized to the control group) are shown in the middle and right panels, respectively. Data are mean ± SD, n = 30 (middle) or 3 (right). P values are determined by one-way ANOVA with Tukey’s post hoc test, *** P < 0.001. (B, G) Western blot analysis of EMT markers in MDA-MB-231 cells stably expressing Smyca shRNAs (B) or M10 cells stably overexpressing Smyca (G). The amounts of each protein in relation to the control cells are indicated under the bands. (C, H) Migration and invasion assays of MDA-MB-231 cells stably expressing Smyca shRNAs (C) or M10 cells stably overexpressing Smyca (H). Data are mean ± SD from three independent experiments. P values are determined by one-way ANOVA with Tukey’s post hoc test (C) or unpaired t test (H), *P < 0.05, **P < 0.01, *** P < 0.001. (D, I) Flow cytometry analysis of the expression of breast cancer stem cell markers in MDA-MB-231 cells stably expressing Smyca shRNAs (D) or M10 cells stably overexpressing Smyca (I). Stem cell populations are marked by blue and the percentages are indicated. (E, J) Sphere formation assay of MDA-MB-231 cells stably expressing Smyca shRNAs (E) or M10 cells stably overexpressing Smyca (J). Solid and dashed lines are derived from means and standard deviations, respectively. Data are mean ± SD from three independent experiments. P values are determined by Chi-square test. (F) Morphological assessment of M10 cells stably overexpressing Smyca. Bar, 100 μm. Cell length/width ratios and Smyca expression levels (normalized to the control group) are shown in the middle and right panels, respectively. Data are mean ± SD, n = 30 (middle) or 3 (right). P values are determined by unpaired t test, *** P < 0.001
Fig. 2
Fig. 2
Smyca enhances TGF-β signaling. (A) qRT-PCR analysis of the ratios of nuclear and cytoplasmic Smyca from indicated cells. NEAT1 and GAPDH were used as controls. (B) Representative image for Smyca subcellular distribution analyzed by in situ hybridization on MDA-MB-231 cells. Bar, 10 μm. (C) Comparison of RNA-seq data derived from MDA-MB-231 cells expressing control shRNA and Smyca shRNA #1. DEGs are marked by blue dots. (D) GSEA Hallmark Pathway analysis of DEGs shown in (C). The top enriched and depleted hallmarks are shown by the order of FDR (bottom to top). (E) Representative GSEA plots for the match of Smyca signature with the indicated signatures. Enrichment score (ES) and normalized enrichment score (NES) are indicated. The full set of GSEA data is shown in Additional file 1: Fig. S3A. (F, H) qRT-PCR analysis of indicted genes in MDA-MB-231 cells stably expressing Smyca shRNAs (F) or M10 cells stably expressing Smyca (H) and treated with or without 5 ng/ml TGF-β for 24 h. Data are normalized with that of untreated group in each cell. (G, I) Luciferase reporter assay on MDA-MB-231 cells stably expressing Smyca shRNAs (G) or M10 cells stably expressing Smyca (I), transfected with indicated reporters and treated with or without 5 ng/ml TGF-β for 24 h. Data in (F), (G), (H), and (I) are normalized with that of untreated control and expressed as mean ± SD from three independent experiments. P values are determined by one-way ANOVA with Tukey’s post hoc test (F, G) or unpaired t test (H, I), **P < 0.01, ***P < 0.001. (J) Representative correlation plots of Smyca expression with the expression of indicated TGF-β target genes by analyzing HCC or breast cancer data sets from TCGA (n = 369 for HCC and 1099 for breast cancer). Pearson’s coefficients and P values are indicated. Additional correlative data are shown in Additional file 1: Fig. S3F
Fig. 3
Fig. 3
Smyca enhances Smad3/Smad4 complex formation and promoter recruitment. (A, G) RNA pull-down assay using MDA-MB-231 nuclear extracts and biotinylated sense or antisense Smyca or Smyca deletion fragments. Antibodies that recognize Smad2/3 and Smad3 only were used in (A) and (G), respectively. (B) RIP analysis for the enrichment of indicated lncRNAs in Smad3 or Smad4 immunoprecipitates derived from MDA-MB-231 cells. Data are normalized with that from the control antibody. The presence of Smad3 or Smad4 in the immunoprecipitates is shown on the right. (C) Bacterially purified GST-Smad3 or GST-Smad4 bound on beads was incubated with sense or antisense Smyca. The bound Smyca was analyzed by qRT-PCR and normalized with that from the GST only group. The input GST fusion proteins are shown on the bottom and marked by arrows. (D) Smad4-associated complex was immunoprecipitated from MDA-MB-231 cells transfected with Flag-Smad4 and treated with 5 ng/ml TGF-β for 2 h. The immunocomplex was eluted and further precipitated with anti-Smad3 antibody to isolate the Smad3/Smad4 complex. Smyca enrichment in this complex was analyzed by qRT-PCR. (E, F) Immunoprecipitation analysis of Smad3 and Smad4 interaction in MDA-MB-231 cells stably expressing Smyca shRNAs (E) or M10 cells stably expressing Smyca (F) and treated with or without 5 ng/ml TGF-β for 1 h. (H) ChIRP assay for Smyca occupancy on the indicated Smad target loci. GAPDH was used as a control. Tilling biotinylated oligonucleotides complementary to LacZ or Smyca were used to pull down the RNA-associated chromatins from MDA-MB-231 cells treated with 5 ng/ml TGF-β for 2 h, followed by qRT-PCR analysis. Data are normalized with the inputs. (I, J) ChIP analysis of the recruitment of Smad3 or Smad4 to the indicated promoters in MDA-MB-231 cells stably expressing Smyca shRNAs (I) or Smyca (J) and treated with or without 5 ng/ml TGF-β for 2 h. The enrichment folds are normalized with that from untreated group. Data in (B), (C), (D), (H), (I), and (J) are mean ± SD, n = 3. P values are determined by one-way ANOVA with Tukey’s post hoc test (B, C, I) or unpaired t test (D, H, J), *P < 0.05, **P < 0.01, ***P < 0.001
Fig. 4
Fig. 4
Smyca governs a positive feedback regulation of TGF-β signaling. (A) qRT-PCR analysis of Smyca expression in indicated cell lines treated with 5 ng/ml TGF-β for 6 h. Data are normalized with that of untreated group. (B) Upper panel: Smyca gene architecture. The transcription starting site (+ 1), regions corresponding to miR-23a ~ 27a ~ 24–2 clusters (blue), Smyca (orange) and locations of the two SBEs (red) and two sets of PCR primers covering the SBEs are indicated. The corresponding chromosome location of Smyca gene (green) and the DNase I hypersensitive clusters (gray and black) are shown on the top. Bottom panel: ChIRP assay for Smyca occupancy on its own promoter. Tilling biotinylated oligonucleotides complementary to LacZ or Smyca were used to pull down the RNA-associated chromatins from MDA-MB-231 cells treated with 5 ng/ml TGF-β for 2 h, followed by qRT-PCR analysis. Data are normalized with the inputs. The locations of two sets of PCR primers covering the two SBE regions of Smyca promoter are shown on the top. (C) ChIP analysis of the recruitment of Smad3 and Smad4 to the indicated SBEs in MDA-MB-231 cells stably expressing control or Smyca shRNAs and treated with 5 ng/ml TGF-β for 2 h. (D, F) qRT-PCR analysis of indicated genes in Hs578T cells stably expressing Smyca shRNAs (D) or M10 cells stably expressing Smyca (F) and treated with or without 5 ng/ml TGF-β for indicated time points. Data are normalized with that of untreated group (0 h). (E, G) Luciferase reporter assay on MDA-MB-231 cells stably expressing Smyca shRNAs (E) or M10 cells stably expressing Smyca (G) and treated with or without 5 ng/ml TGF-β for indicated time points. Data are normalized with that of untreated group (0 h). Data in all panels are mean ± SD, n = 3. P values are determined by unpaired t test (A, B, F, G) or one-way ANOVA with Tukey’s post hoc test (C, D, E), *P < 0.05, **P < 0.01, ***P < 0.001
Fig. 5
Fig. 5
Smyca promotes c-Myc/Max complex recruitment to its target promoters and c-Myc/TRRAP binding. (A) GSEA plots for the match of Smyca signature with Myc signature from indicated sources. (B, C) qRT-PCR analysis of indicated c-Myc targets in MDA-MB-231 cells stably expressing Smyca shRNAs (B) or MCF7 cells stably expressing Smyca (C). Data are normalized with that derived from control cells. (D, F, G) RNA pull-down analysis by incubating MDA-MB-231 nuclear extracts (D, G) or indicated amounts of recombinant c-Myc protein (F) with biotinylated sense or antisense Smyca (D, F) or its deletion mutants (G). (E) RIP assay for the enrichment of Smyca in c-Myc immunoprecipitates derived from MDA-MB-231 cells. Data are normalized with that derived from Neat1. The presence of c-Myc in the immunoprecipitates is shown on the right panel. (H) ChIRP assay for detecting Smyca occupancy on indicated c-Myc target loci. Tilling biotinylated oligonucleotides complementary to LacZ or Smyca were used to pull down the RNA-associated chromatins from MDA-MB-231 cells, followed by qRT-PCR analysis. Data are normalized with that of inputs. (I) ChIP analysis of the recruitment of c-Myc or Max to indicated promoters in MDA-MB-231 cells stably expressing Smyca shRNAs. The enrichment folds are normalized with that from control cells. Data in (B), (C), (E), (H) and (I) are mean ± SD, n = 3. P values are determined by one-way ANOVA with Tukey’s post hoc test (B, I) or unpaired t test (C, E, H), *P < 0.05, **P < 0.01, ***P < 0.001. (J) Immunoprecipitation analysis of c-Myc binding to TRRAP in MDA-MB-231 cells stably expressing Smyca shRNA or Smyca
Fig. 6
Fig. 6
Smyca coordinates with TGF-β and c-Myc pathways for stimulating glycolysis and preventing growth inhibition. (A, B) RIP assays for the enrichment of Smyca in Smad3, Smad4 or c-Myc immunoprecipitates derived from MCF7 cells stably expressing Smyca and treated with or without 5 µM SB431542 for 24 h (A), or MCF7 cells stably expressing Smyca and transfected with c-Myc siRNA (B). (C, D) Cell proliferation (C) and qRT-PCR analysis (D) of MCF7 cells stably expressing Smyca, transfected with c-Myc siRNA, and/or treated with 5 µM SB431542 for 24 h. Validation of c-Myc knockdown efficiency is shown on the left panel in (C). (E, F) Cell proliferation (E) and qRT-PCR analysis (F) of MCF7 cells transfected with indicated Smyca constructs. The expression levels of Smyca and mutants are shown on the left panel in (E). (G, H) Glucose consumption (G) and lactate formation (H) in BT-549 cells transfected with Smyca and treated with 10 µM SB431542 and/or 150 µM 10058-F4 for 24 h (G) or 48 h (H). Validation of Smyca overexpression is shown on the left panel in (G). (I, J) Glycolysis stress profile (I) and glycolysis and glycolytic reserve rates (J) were measured using MDA-MB-231 cells transfected and treated as in (G). Data in all panels are mean ± SD, n = 3. P values are determined by unpaired t test (A, B), one-way (C, D, E, F) or two-way (G, H, J) ANOVA with Tukey’s post hoc test, *P < 0.05, **P < 0.01, ***P < 0.001; ns, not significant
Fig. 7
Fig. 7
Smyca serves as a therapeutic target to prevent metastasis and chemoresistance. (A, B) Experimental metastasis assay for MDA-MB-231 cells stably expressing Smyca shRNAs (A) or Smyca (B). Representative images of the bioluminescence analysis at 8 weeks (A) or 7 weeks (B) after injection and the kinetics of metastasis at indicated time points are shown on the top left and right panels, respectively. The lung images at 8 weeks (A) and 7 weeks (B) after injection are shown on the bottom. Bar, 2 mm. (C) Cell viability assay of MDA-MB-231 cells stably expressing Smyca shRNAs and treated with Dox or cisplatin at indicated doses. (D) Nude mice orthotopically implanted with MDA-MB-231 cells stably expressing control or Smyca shRNAs and treated with Dox or DMSO as indicated (top left panel). Tumor volumes were measured at indicated days and plotted on the right. Tumors were surgically removed at the killing day and their sizes are shown on the bottom left panel. (E) NOD/SCID mice orthotopically implanted with LM6 cells were injected with NPs and/or Dox as indicated (top left panel). Tumor volumes at indicated days are shown on the right. Tumors were surgically removed at the killing day and their sizes are shown on the bottom left panel. (F) NOD/SCID mice orthotopically implanted with LM6 cells were injected with NPs as indicated (top left panel). Representative images of the bioluminescence analysis at 6 weeks after transplantation and the kinetics of metastasis at indicated time points are shown on the top right and bottom left panels, respectively. The lung images at 6 weeks after transplantation are shown on the bottom right. Bar, 2 mm. Data in (A), (B), (C), (D), (E), and (F) are mean ± SD, n = 5 (A), n = 4 (B, D, E, F), or n = 3 (C). P values are determined by one-way (A, C) or two-way (D, E) ANOVA with Tukey’s post hoc test or unpaired t test (B, F), *P < 0.05, **P < 0.01, ***P < 0.001; ns, not significant. (G) Schematic presentation of the roles of Smyca in coactivating TGF-β/Smad and Myc pathways to promote tumor progression

References

    1. Derynck R, Weinberg RA. EMT and cancer: more than meets the eye. Dev Cell. 2019;49:313–316. doi: 10.1016/j.devcel.2019.04.026. - DOI - PMC - PubMed
    1. Lu W, Kang Y. Epithelial-mesenchymal plasticity in cancer progression and metastasis. Dev Cell. 2019;49:361–374. doi: 10.1016/j.devcel.2019.04.010. - DOI - PMC - PubMed
    1. Hao Y, Baker D, Ten Dijke P. TGF-beta-mediated epithelial-mesenchymal transition and cancer metastasis. Int J Mol Sci. 2019;20:2767. doi: 10.3390/ijms20112767. - DOI - PMC - PubMed
    1. Lamouille S, Xu J, Derynck R. Molecular mechanisms of epithelial-mesenchymal transition. Nat Rev Mol Cell Biol. 2014;15:178–196. doi: 10.1038/nrm3758. - DOI - PMC - PubMed
    1. Heldin CH, Miyazono K, ten Dijke P. TGF-beta signalling from cell membrane to nucleus through SMAD proteins. Nature. 1997;390:465–471. doi: 10.1038/37284. - DOI - PubMed

Publication types

Substances