[Preprint]. 2023 Jul 31:2022.06.24.497555.
doi: 10.1101/2022.06.24.497555.

SPLASH: a statistical, reference-free genomic algorithm unifies biological discovery

Affiliations

SPLASH: a statistical, reference-free genomic algorithm unifies biological discovery

Kaitlin Chaung et al. bioRxiv. .

Update in

Abstract

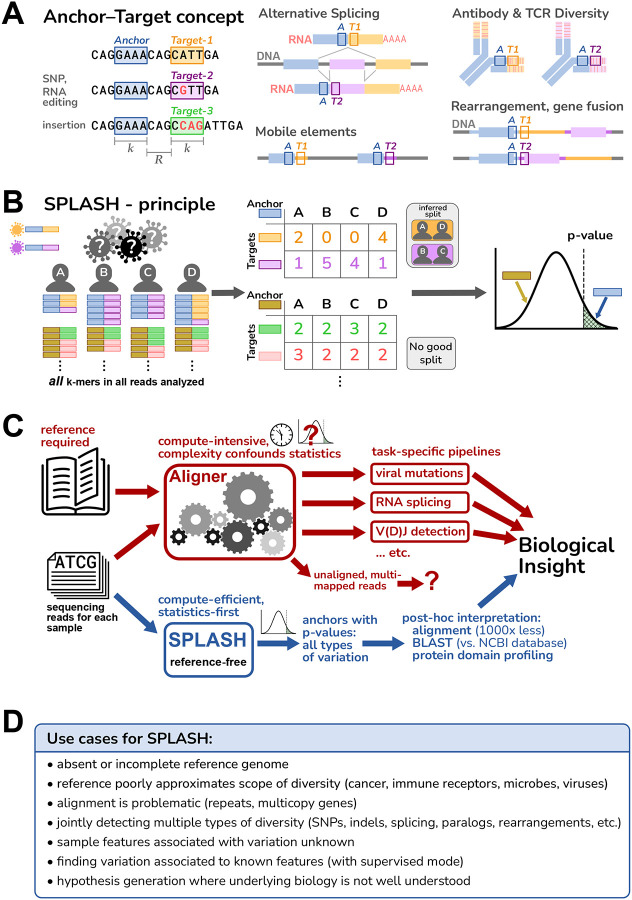
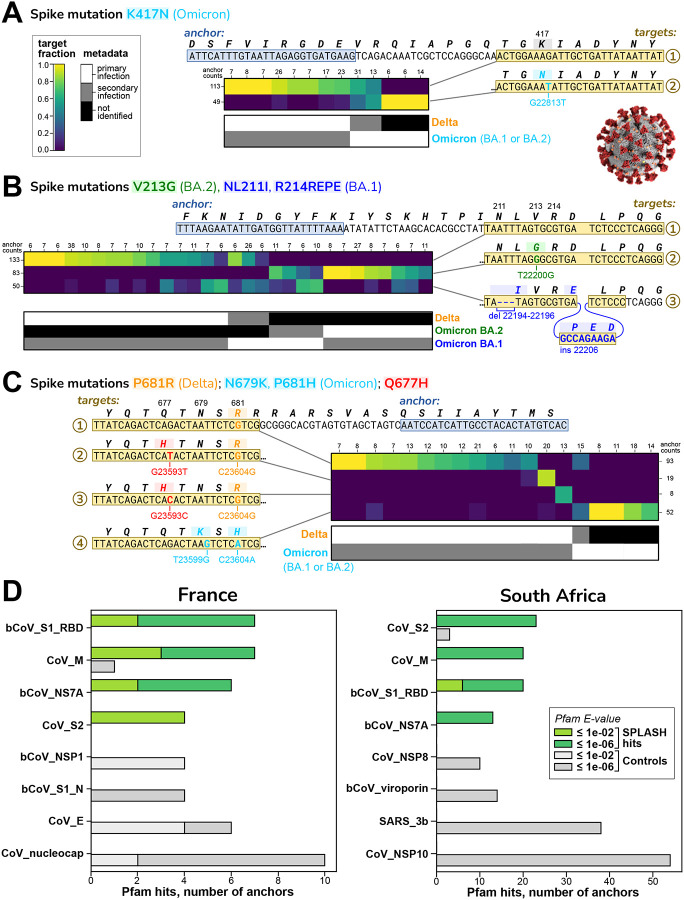
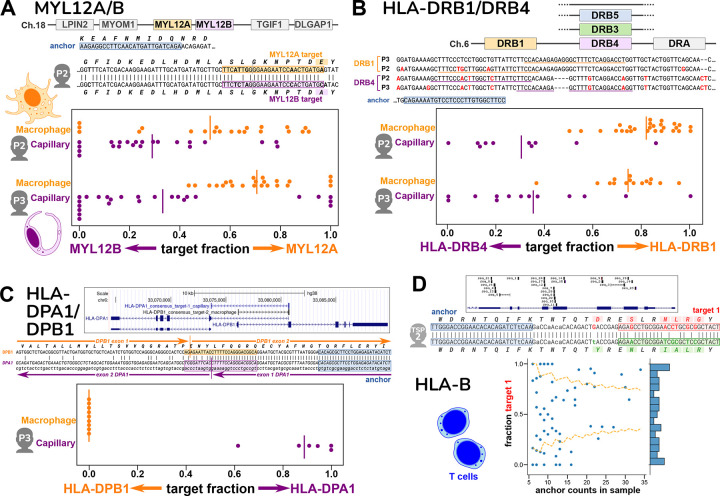
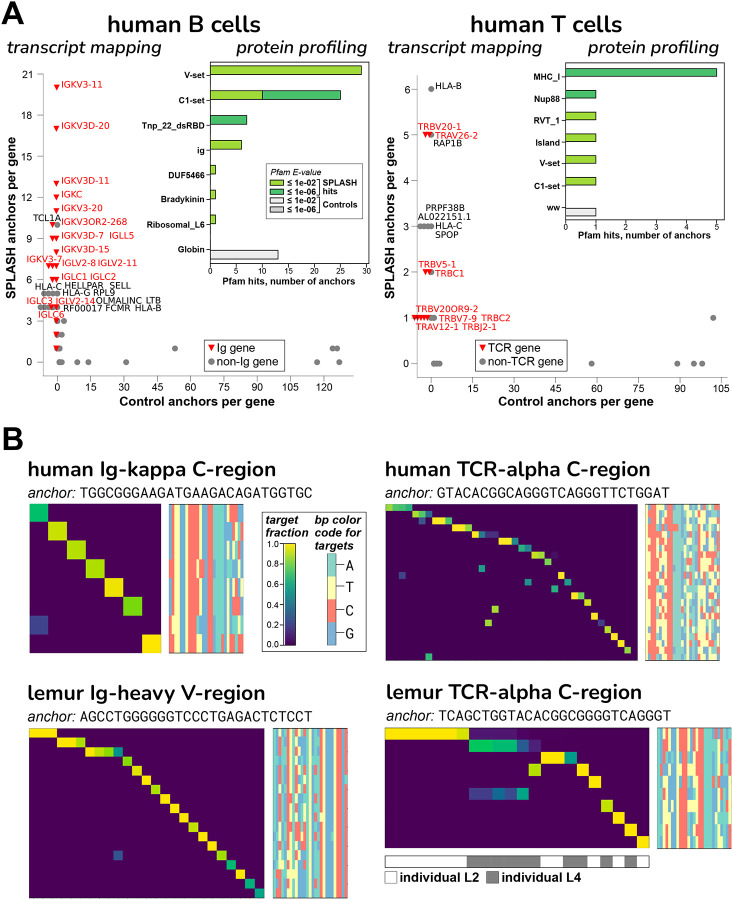
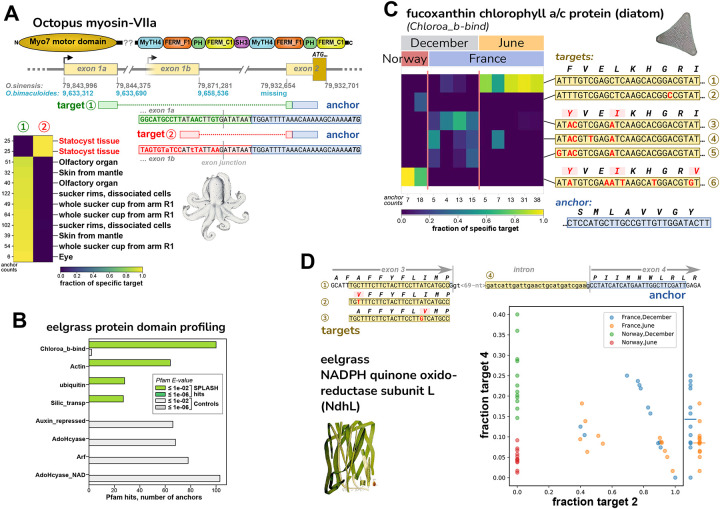
Today's genomics workflows typically require alignment to a reference sequence, which limits discovery. We introduce a new unifying paradigm, SPLASH (Statistically Primary aLignment Agnostic Sequence Homing), an approach that directly analyzes raw sequencing data to detect a signature of regulation: sample-specific sequence variation. The approach, which includes a new statistical test, is computationally efficient and can be run at scale. SPLASH unifies detection of myriad forms of sequence variation. We demonstrate that SPLASH identifies complex mutation patterns in SARS-CoV-2 strains, discovers regulated RNA isoforms at the single cell level, documents the vast sequence diversity of adaptive immune receptors, and uncovers biology in non-model organisms undocumented in their reference genomes: geographic and seasonal variation and diatom association in eelgrass, an oceanic plant impacted by climate change, and tissue-specific transcripts in octopus. SPLASH is a new unifying approach to genomic analysis that enables an expansive scope of discovery without metadata or references.


Conflict of interest statement

Competing interests K.C., T.Z.B. and J.S. are inventors on provisional patents related to this work. The authors declare no other competing interests.

Figures

Figure 1.
Figure 1.. Overview of SPLASH
A. An anchor is a sequence of length k (k-mer) in a read; its target is defined as the k-mer that follows it after a fixed offset of length R. An anchor may occur with different targets, and this can capture many types of variation, ranging from single-nucleotide changes to alternative exon splicing; other examples are depicted schematically, with anchor as a blue box and targets as orange or violet boxes. B. SPLASH compiles a table for each anchor, where the columns are samples and the rows are targets, and entries are the respective occurrence counts. In its default unsupervised mode, SPLASH iterates over multiple random splits of the samples, calculating a test statistic that measures the deviations between each sample’s target distribution and the average target distribution over all samples, searching for the most discriminating split. For the best split identified, SPLASH reports a p-value bound (which is non-asymptotic, controlling Type I error for any number of observations). Anchors with low p-values have target distributions that vary significantly between samples. C. Standard alignment-based pipelines are limited by the need for a reference genome, are compute-intensive, and difficult to model statistically due their complexity. SPLASH was designed to detect variation directly from raw reads with rigorous statistics, is very compute-efficient, and can detect many kinds of variation at once. D. Some considerations of when SPLASH may be most useful, which reflect its design characteristics.
Figure 2.
Figure 2.. SPLASH identifies strain-defining and other variation in SARS-Cov2
In A-C, sets of targets that distinguish between SARS-CoV-2 strains are shown; all are in the spike protein (S) gene. Each heatmap has columns for different patients and rows for different targets; the coloring indicates the fraction of the given target observed in the given patient. Summary anchor counts are given for rows and columns, simply to give context of how many observations are summarized. Also shown is a map of the categorical metadata of what strains (primary and secondary) were identified in each patient in the original study; this data was not used by SPLASH, but there is evident agreement between the expression in the heatmap and the strain assignment in the metadata. We give binomial p-values to quantify the distinctions in the plots (per Note S7). A. Mutation K417N, identified by SPLASH in target 2, distinguishes at the major strain level: it is not found in Delta but is in all Omicron (both BA.1 and BA.2 sub-strains). Patients classified as Delta all express target 1; two patients co-infected with Delta and Omicron show both targets. (p = 6.4E-07) B. An anchor with three targets identified by SPLASH distinguish at the sub-strain level: target 1 with no mutations matches Delta, target 2 with V213G is specific for BA.2, and target 3 has both a deletion mutation (NL211I) and insertion mutation (R214REPE) characteristic of BA.1. Target 1 and 2 associate inversely with Delta and BA.2; target 3 is more mixed, due to all samples with this anchor expressing some level of BA.1. (p = 1.0E-13) C. An anchor with four main targets identifies mutations that are not associated to a specific strain: targets 2 and 3 encode Q677H (with different mutations) together with the Delta-specific mutation P681R, and each target is predominant in a different patient. Target 1 has only P681R and lacks Q677H. Target 4 has the Omicron-specific mutations N679K and P681H. SPLASH can identify complicated mutation patterns. (p = 4.9E-12) D. Protein domain profiling in SARS-CoV-2. The top four protein domain types found by Pfam for translated extended sequences for SPLASH significant anchors (green bars) and Control anchors (highest abundance but generally without significant p-values; gray bars) are shown. S1 Receptor binding domain (RBD) and S2 domain, known to be under strong selective pressure, show high variation by SPLASH in both datasets. Other abbreviations used in the Pfam short-names are: bCoV = beta-coronavirus; CoV = coronavirus, nucleocap = nucleocapsid N = N-terminal domain, SARS = Severe acute respiratory syndrome coronavirus; M, NS7A, NSP1, NSP8, 3b, NSP10 are viral protein names.
Figure 3.
Figure 3.. Cell-type specific expression of paralogs and HLA from single-cell data
Figures A-C show spread plots, with each dot representing the relative isoform expression in a single cell; a bar marks the average relative expression across all the cells. A. Human MYL12A and MYL12B lie adjacent on chromosome 18; this region is syntenic in mammals, chickens, and reptiles. The two genes are very similar in the coding region, as seen in the sequence alignment that also shows the locations of the anchor and two targets for individual P2 (anchor is distinct for P3). Macrophages express relatively more MYL12A and capillary cells more MYL12B, based on target fractions; this result is consistent in two different individuals. B. The HLA-DRB locus occurs as several different haplotypes, all of which contain a DRB1 gene but differ in presence of a paralog (DRB3, DRB4, DRB5, or none; hg38 reference has DRB5). The anchor and targets lie in the somewhat similar 3’ untranslated regions of DRB1 and DRB4; however the two individuals have distinct alleles at both DRB1 and DRB4. Macrophages express mainly DRB1 and capillary cells mainly DRB4, based on target fractions. C. The HLA-DPA1 and HLA-DPB1 genes overlap in a head-to-head arrangement as shown in the UCSC Genome Browser plot, which also shows the BLAT alignment of the consensus sequences for the DPA1 and DPB1 anchors. These lie on opposite strands of the genome. This is also depicted in the alignment of the two consensuses (which represent mRNA); the targets are best assigned to opposite strands, and the location of splice junctions corroborates the strandedness. An anchor reporting simultaneously on DPA1 and DPB1 was only found for individual P3; its targets show that macrophages exclusively express DPB1, while capillary cells express DPA1. D. T cells from one individual showed a large number of anchors across the polymorphic HLA-B gene, as depicted in the UCSC Browser plot. We investigated one HLA-B anchor, which lies in exon 2. The hg38 reference is the B*07:02 allele, whereas alleles of this individual match best by BLAST to B*08 and B*51 (consensus 1 and 2). In the alignment, differences from hg38 in the anchor and lookahead region are shown in lowercase. Individual T cells show a wide range of expression ratios between the two HLA-B alleles (different target 1 fractions), as shown in the scatterplot. The yellow lines mark a 98% confidence interval for a distribution based on the population average (confidence depends on observation depth = anchor counts); the observed pattern differs (binomial p = 1.73E-25), and some cells express almost exclusively one allele over the other.
Figure 4.
Figure 4.. B and T cell receptor diversity from human and lemur single cell data
A. The “transcript mapping” plots show the number of anchors that align to a given gene name, for SPLASH on y-axis and Controls on x-axis, with immune receptor genes highlighted in red. For B cells, Ig genes (kappa = IGK and lambda = IGL) are by far the most predominant mapping among SPLASH anchors, but are not found at all in Control anchors (those with the highest counts). For T cells, TCR genes (alpha = TRA, beta = TRB) predominate, and are also not found in Controls. The inset histograms show that, in B cells and T cells, immunoglobulin-type “V-set” and “C1-set” are among the top protein domain annotations identified by Pfam on anchor consensuses, without using a reference genome. Mobile element activity is suggested by Pfam domains Tnp_22_dsRBD (“L1 transposable element dsRBD-like domain”) in B cells and RVT_1 (“Reverse transcriptase”) in T cells. B. Targets associated with Ig/TCR anchors are clonotypically expressed, in both human and lemur: heatmaps show that most targets (rows) are expressed only in a single cell (columns). The anchors shown have among the highest target entropy scores for their gene type (Figure S5B illustrates an extreme example with 97 targets, for lemur Ig-lambda.) Target sequences are shown as bp color-maps (rows are targets, matching those in the heatmap; columns are bp positions, colored by base), giving a quick visualization of the sequence diversity. For lemur, NKT cells were studied, and show significant shared TCR usage – see top two rows; interestingly, the shared target sequence is different in the two individuals. There is similar sharing for lemur TCR-gamma and -beta chains (Figure S5C and D).
Figure 5.
Figure 5.. Discovery of regulated variation in non-model organisms: octopus and eelgrass
A. SPLASH identified alternative transcripts in the O. bimaculoides Myo-VIIa motor protein that are expressed mutually exclusively; the target 2 isoform is only found in statocyst, a sound-responsive tissue. The transcripts have different first exons, presumably due to alternative transcription start sites; the start codon lies in the shared second exon. The sequence of the anchor and exon 2 are missing from the current O. bimaculoides genome assembly, but are in the closely related O. sinensis genome. Sequences for targets 1 and 2 are in both genomes, but the statocyst-specific transcript is not annotated. The O. sinensis assembly has the Myo-VIIa gene in two inverted pieces (at the point marked by ‘??’ in protein domain schematic; Note S5). B. Two of the top domains identified from SPLASH anchors by protein domain profiling in eelgrass (Z. marina) samples are chlorophyll A-B binding protein (Chloroa_b-bind) and silicon transporter (Silic_transp); these derive from diatoms, based on BLAST protein alignment (Figure S7; Data S7). The other two top SPLASH domains, actin and ubiquitin, do not appear to derive from diatoms nor eelgrass, so may be from other epiphytic species. C. A Chloroa_b-bind anchor, more specifically identified by protein BLAST as a fucoxanthin chlorophyll a/c protein from diatoms (Figure S7C), has several targets that are differentially abundant: the most common target (top row) is mainly found in France/June samples; three targets that encode the same protein sequence (middle) are found in France/December samples; and one target (bottom row) is only found in Norway/December samples. D. An anchor from eelgrass, in the photosynthetic gene NdhL, has four major targets. Targets 1–3 are allelic coding variants (within a transmembrane region). Target 4 represents intron retention and would result in a shortened protein. The scatterplot shows that Norway samples of June vs. December (red vs. green) are perfectly segregated by the fraction of target 4 (intron retention). A similar but less marked trend is seen for France samples of June vs. December (yellow vs. blue) – at the right edge, fraction target 4 values are collapsed to one dimension, with averages marked by bars. The scatterplot also shows that Norway samples do not express target 2 at all (they express target 1 and 3, data not shown).

References

    1. Sherman R.M., Forman J., Antonescu V., Puiu D., Daya M., Rafaels N., Boorgula M.P., Chavan S., Vergara C., Ortega V.E., et al. (2019). Assembly of a pan-genome from deep sequencing of 910 humans of African descent. Nat. Genet. 51, 30–35. 10.1038/s41588-018-0273-y. - DOI - PMC - PubMed
    1. Domingo E., and Perales C. (2019). Viral quasispecies. PLoS Genet. 15, e1008271. 10.1371/journal.pgen.1008271. - DOI - PMC - PubMed
    1. Tettelin H., and Medini D. eds. (2020). The Pangenome. - PubMed
    1. Nurk S., Koren S., Rhie A., Rautiainen M., Bzikadze A.V., Mikheenko A., Vollger M.R., Altemose N., Uralsky L., Gershman A., et al. (2022). The complete sequence of a human genome. Science 376, 44–53. 10.1126/science.abj6987. - DOI - PMC - PubMed
    1. Romano Y., Sesia M., and Candès E. (2019). Deep Knockoffs. J. Am. Stat. Assoc., 1–27. 10.1080/01621459.2019.1660174. - DOI - PubMed

Publication types

LinkOut - more resources