[Preprint]. 2022 Jul 2:2022.06.29.22276868.
doi: 10.1101/2022.06.29.22276868.

Accelerated SARS-CoV-2 intrahost evolution leading to distinct genotypes during chronic infection

Affiliations

Accelerated SARS-CoV-2 intrahost evolution leading to distinct genotypes during chronic infection

Chrispin Chaguza et al. medRxiv. .

Update in

Abstract

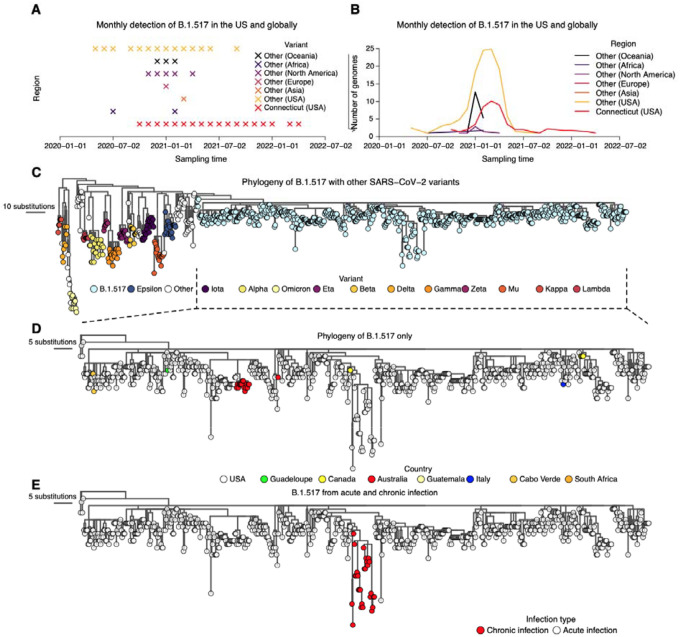
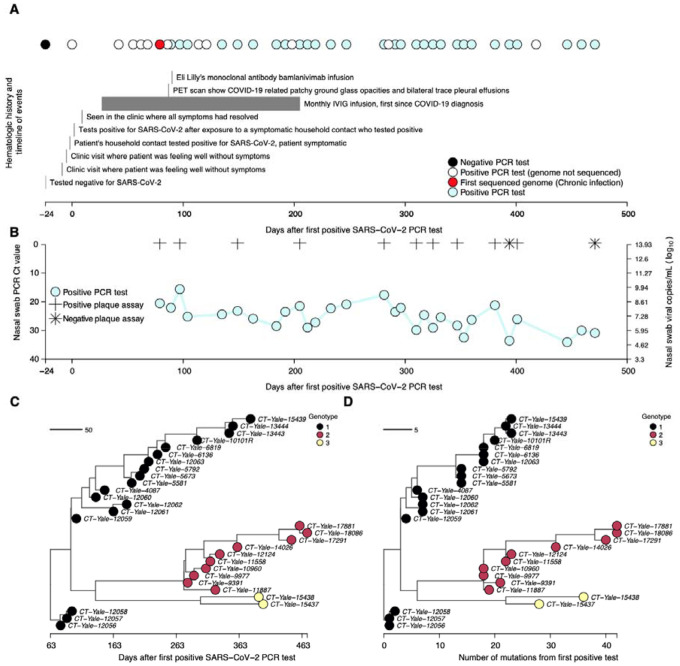
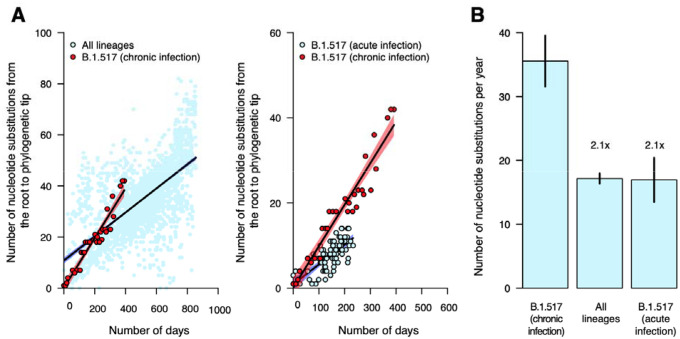
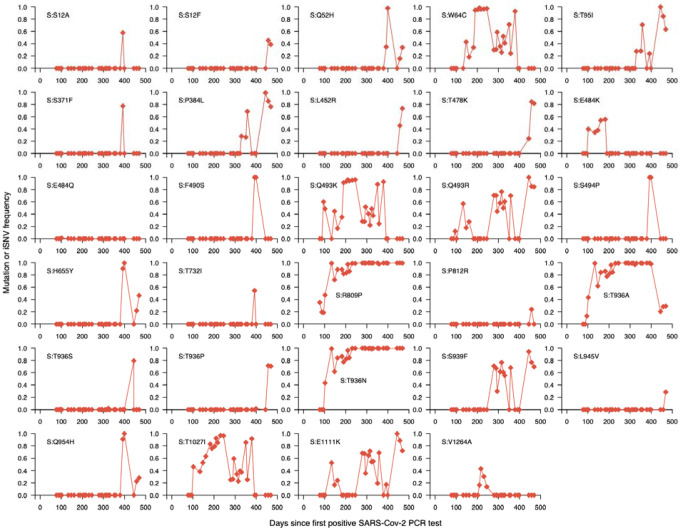
The chronic infection hypothesis for novel SARS-CoV-2 variant emergence is increasingly gaining credence following the appearance of Omicron. Here we investigate intrahost evolution and genetic diversity of lineage B.1.517 during a SARS-CoV-2 chronic infection lasting for 471 days (and still ongoing) with consistently recovered infectious virus and high viral loads. During the infection, we found an accelerated virus evolutionary rate translating to 35 nucleotide substitutions per year, approximately two-fold higher than the global SARS-CoV-2 evolutionary rate. This intrahost evolution led to the emergence and persistence of at least three genetically distinct genotypes suggesting the establishment of spatially structured viral populations continually reseeding different genotypes into the nasopharynx. Finally, using unique molecular indexes for accurate intrahost viral sequencing, we tracked the temporal dynamics of genetic diversity to identify advantageous mutations and highlight hallmark changes for chronic infection. Our findings demonstrate that untreated chronic infections accelerate SARS-CoV-2 evolution, ultimately providing opportunity for the emergence of genetically divergent and potentially highly transmissible variants as seen with Delta and Omicron.


Conflict of interest statement

Conflicts of interest

NDG is a consultant for Tempus Labs and the National Basketball Association for work related to COVID-19 but is outside the submitted work. UNC is pursuing intellectual property protection for Primer ID sequencing and RS has received nominal royalties from licensing.

Figures

Figure 1:
Figure 1:. Genomic surveillance and phylogeny shows continued detection and genetic divergence of B.1.517 from chronic infection.
(A) Monthly detection of B.1.517 (B.1.517 and B.1.517.1) variants in Connecticut (USA), other USA states, and elsewhere. (B) Total number of sequence genomes for the B.1.517 (B.1.517 and B.1.517.1) variants in Connecticut (USA), the rest of the USA, and elsewhere. (C) Maximum likelihood phylogeny of B.1.517 in the context of selected genomes from other variants. (D) Maximum likelihood phylogeny of all sequenced B.1.517 genomes showing country of origin. (E) Maximum likelihood phylogeny of all sequenced B.1.517 samples highlighting the genomes associated with the chronic infection and other contextual genomes from acute infection (although some could have been sampled from unknown chronic infections).
Figure 2:
Figure 2:. Molecular and virological assays showing isolation of infectious viruses with high copy numbers and the emergence and coexistence of distinct genotypes during the chronic infection.
(A) Timeline showing clinical history of the patient from the earliest time they tested negative for SARS-CoV-2, the first positive test following household exposure by a symptomatic household contact who tested positive two days prior, until the last sampling point. Note that collection of samples was stopped due to the deteriorating condition of the patient, but the infection had not yet cleared. (B) Nasal swab RT-PCR cycle threshold (Ct) values for the samples available for whole genome sequencing showing high viral RNA copy numbers. Additionally, virus infectivity assays performed for selected samples revealed infectious virus at most sampling points. Additional information for the samples, including plaque assay results, are provided in Table S1. (C) Time-resolved phylogeny of the chronic infection samples with branch lengths scaled by the number of days since the first positive RT-PCR SARS-CoV-2 test. (D) Maximum-likelihood phylogeny of the chronic B.1.517 samples showing branch lengths scaled by the genetic divergence expressed as the number of accrued subsitutions over time. The phylogeny shows the intrahost emergence and persistence of multiple divergent genotypes.
Figure 3:
Figure 3:. Nucleotide substitution rates are faster during chronic infection than acute infection and the global evolutionary rate.
(A) Scatter plots showing relationship between phylogenetic root to tip distances, expressed as the number of nucleotide substitutions per site, and time as the number of days from the first sampled genome for the B.1.517 from chronic infection versus all SARS-CoV-2 lineages and other B.1.517 from acute infections. The data points associated with the chronic infection are coloured in red while those representing other variants are coloured in sky blue. The lines and shaded bands surrounding them represent the linear regression models fitted to the data points for the chronic infection data and other variants. (B) Bar graph showing the average mutation rates, expressed as the number of nucleotide substitutions per year for the chronic infection samples and other variants based on the regression coefficients (β) generated from the plots in panel A. Specific values for the evolutionary rates are shown in Table S2.
Figure 4:
Figure 4:. Increasing intrahost genetic diversity during chronic infection.
(A) Number of intrahost single nucleotide variants (iSNVs) >3% frequency across all the samples and genotypes detected during the infection (see Figure 2C, D). (B) Number of iSNVs accumulated over time during the chronic infection. The black solid line represents a fitted linear regression. The regression coefficient (β), i.e., slope of the fitted line, represents the number accrued iSNVs per day while β* represents the number of iSNVs per year. (C) The effective population size (Ne) per day during the chronic infection, estimated based on the consensus genomes shown in Figure 2C, D. (D) Proportion of iSNVs binned at different frequencies, and stratified by variant or mutation type (intergenic, synonymous, and non-synonymous). (E) Number of unique iSNVs at different codon positions. (F) Proportion of unique iSNVs grouped by variant type to highlight potential selection across different SARS-CoV-2 genes. (G) Number of unique iSNVs per gene normalized by the gene length, to highlight variability in selection independent of gene size. (H) Mutation spectra showing the relative mutation rate across the SARS-CoV-2 genome stratified variant type. Additional information for all the identified mutations (intergenic, synonymous, and non-synonymous) are provided in Data S1.
Figure 5:
Figure 5:. Several intrahost single nucleotide variants repeatedly detected during chronic infection.
(A) Number of samples containing each unique intrahost single nucleotide variant (iSNV) and its position on the Wuhan-Hu-1 SARS-CoV-2 reference genome (GenBank: MN908937.3 or NC_045512.2). (B) The y-axis on the right side of the graph shows the number of iSNVs per gene and location of the gene in the reference genome. The y-axis labels represent iSNVs corresponding to specific nucleotide substitutions and position in the genome while the information within the blankets shows the specific amino acid changes, gene, and position in the gene. All the iSNVs are coloured by the variant or mutation type based on the Wuhan-1 SARS-CoV-2 genome sequence feature annotations (GenBank accession: MN908937.3). Additional information for all the identified mutations (intergenic, synonymous, and non-synonymous) are provided in Data S1.
Figure 6:
Figure 6:. Fluctuating dynamics of intrahost single nucleotide variants in the spike gene during chronic infection.
Temporal frequencies of twenty-nine non-synonymous intrahost single nucleotide variants (iSNVs) identified in the spike gene. Additional information for all the identified mutations (intergenic, synonymous, and non-synonymous) are provided in Data S1.

References

    1. Aggarwal D., Warne B., Jahun A., Hamilton W., Fieldman T., Plessis L., Hill V., Blane B., Watkins E., Wright E., et al. Genomic epidemiology of SARS-CoV-2 in a UK university identifies dynamics of transmission. 10.21203/rs.3.rs-520627/v1. - DOI - PMC - PubMed
    1. Andrews N., Stowe J., Kirsebom F., Toffa S., Rickeard T., Gallagher E., Gower C., Kall M., Groves N., O’Connell A.-M., et al. (2022). Covid-19 Vaccine Effectiveness against the Omicron (B.1.1.529) Variant. N. Engl. J. Med. 386, 1532–1546.. - PMC - PubMed
    1. Avanzato V.A., Matson M.J., Seifert S.N., Pryce R., Williamson B.N., Anzick S.L., Barbian K., Judson S.D., Fischer E.R., Martens C., et al. (2020). Case Study: Prolonged Infectious SARS-CoV-2 Shedding from an Asymptomatic Immunocompromised Individual with Cancer. Cell 183, 1901–1912.e9.. - PMC - PubMed
    1. Borges V., Isidro J., Cunha M., Cochicho D., Martins L., Banha L., Figueiredo M., Rebelo L., Trindade M.C., Duarte S., et al. (2021). Long-Term Evolution of SARS-CoV-2 in an Immunocompromised Patient with Non-Hodgkin Lymphoma. mSphere 6. 10.1128/msphere.00244-21. - DOI - PMC - PubMed
    1. Bradley R.E., Ponsford M.J., Scurr M.J., Godkin A., Jolles S., and Immunodeficiency Centre for Wales (2022). Persistent COVID-19 Infection in Wiskott-Aldrich Syndrome Cleared Following Therapeutic Vaccination: a Case Report. J. Clin. Immunol. 42, 32–35.. - PMC - PubMed

Publication types