. 2022 Jun 20:13:875865.
doi: 10.3389/fendo.2022.875865. eCollection 2022.

Basal and Stress-Induced Network Activity in the Adrenal Medulla In Vivo

Affiliations

Basal and Stress-Induced Network Activity in the Adrenal Medulla In Vivo

Jose R Lopez Ruiz et al. Front Endocrinol (Lausanne). .

Abstract

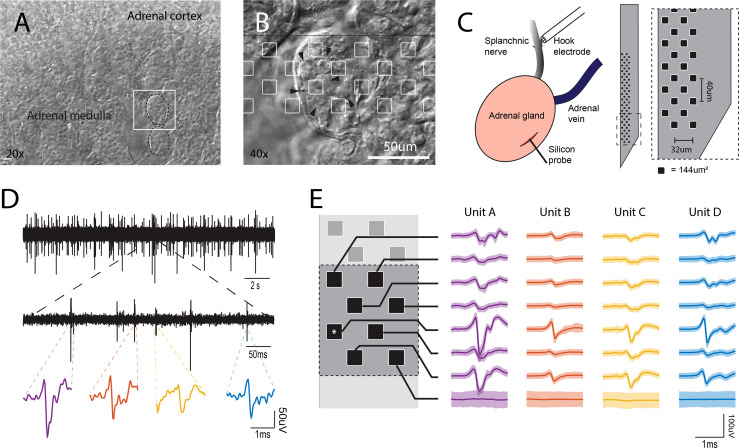
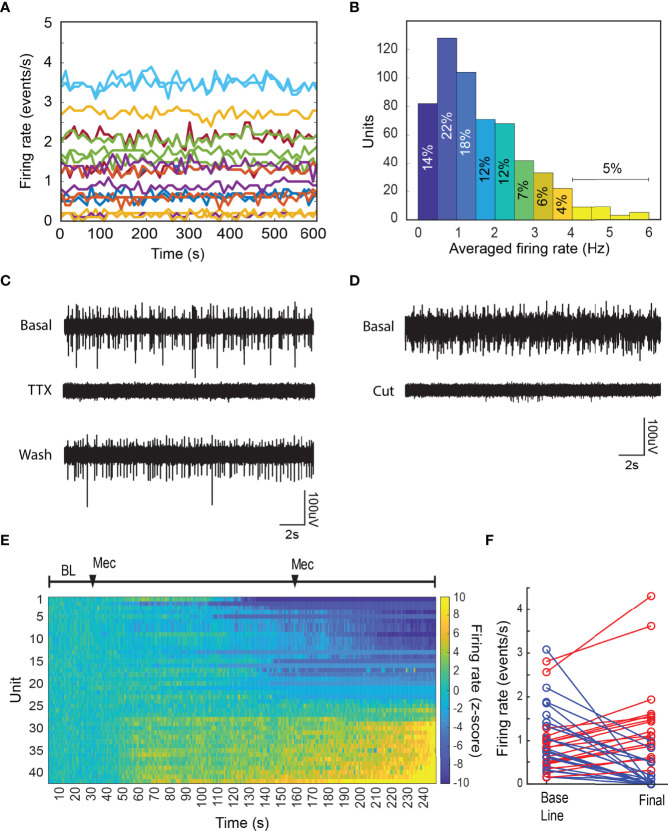
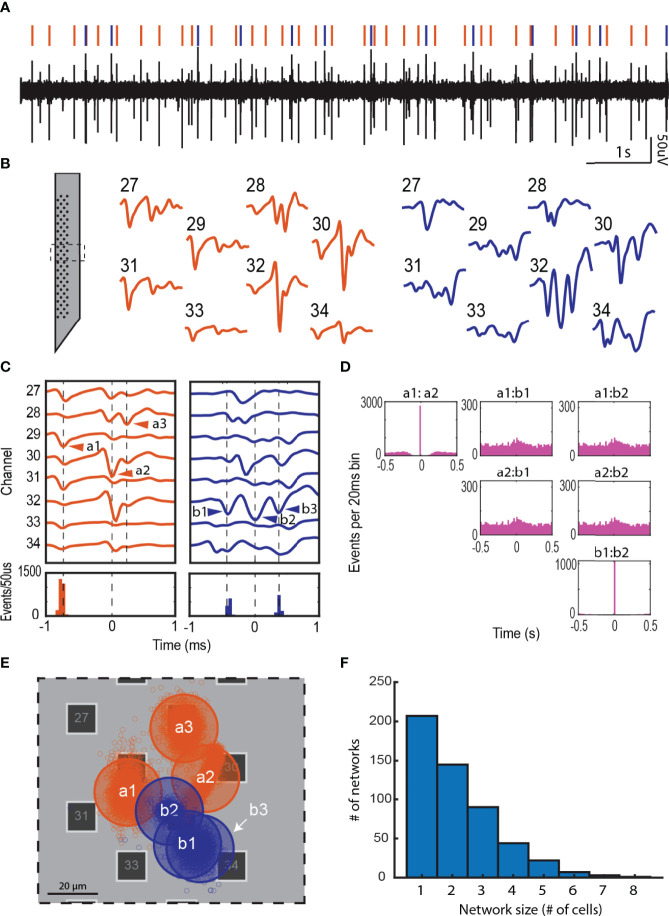
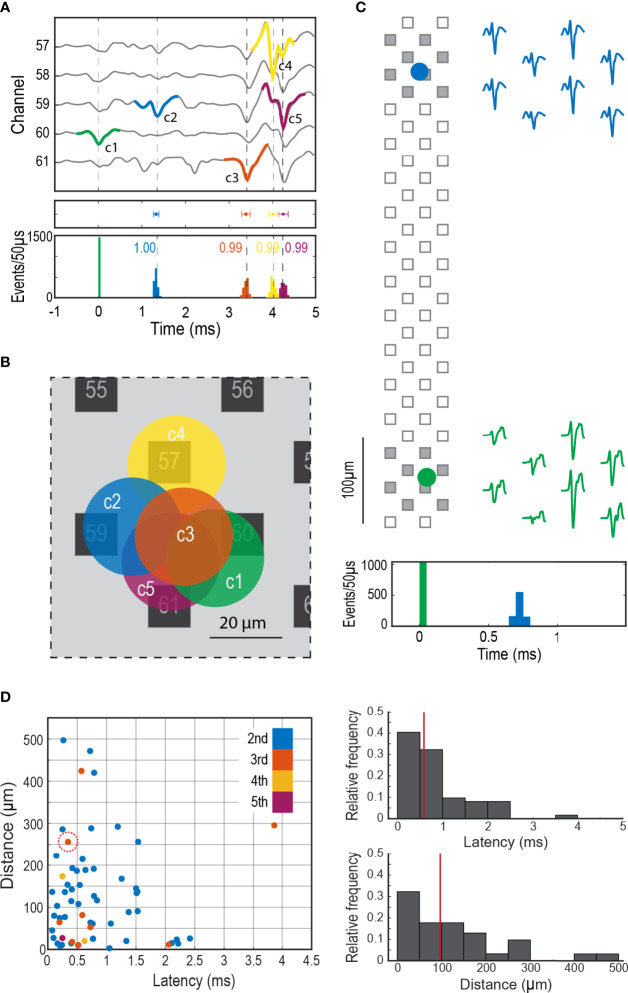
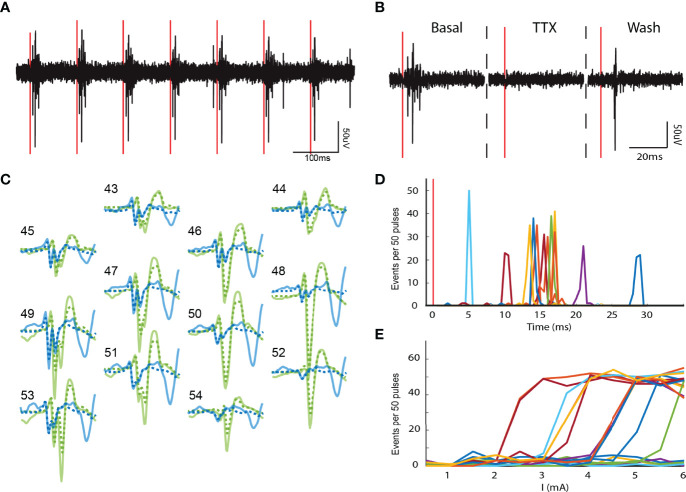
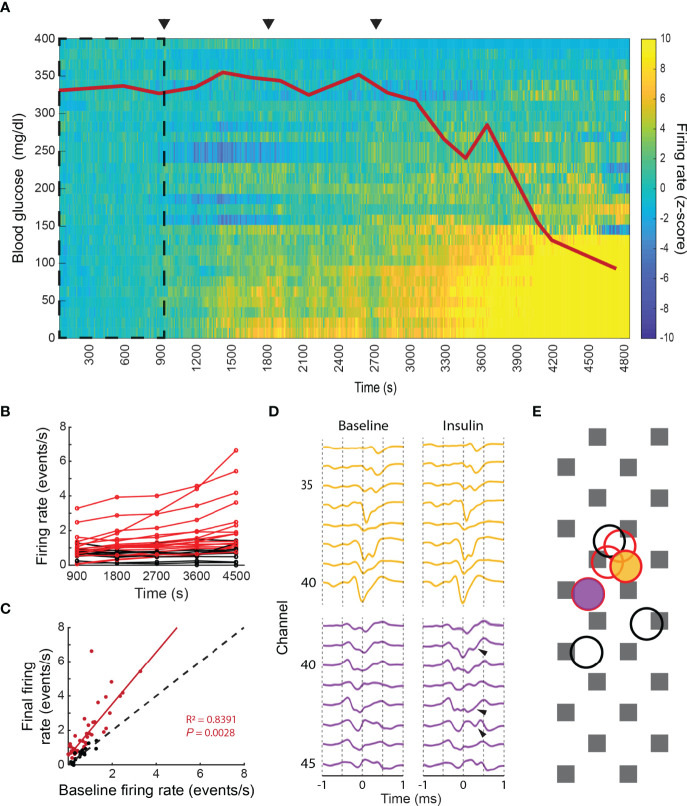
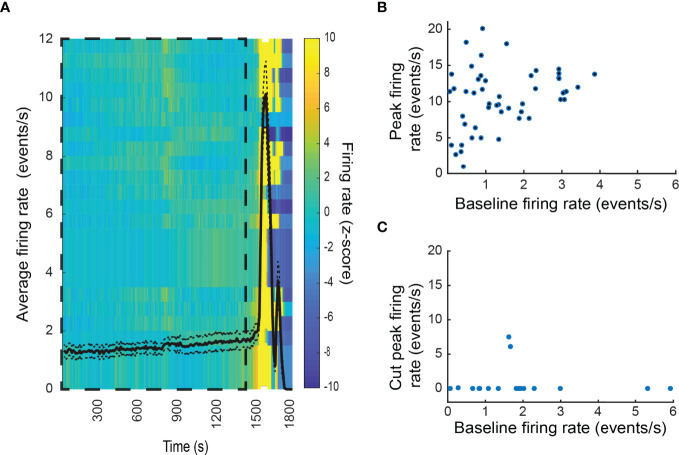
The adrenal medulla plays a critical role in mammalian homeostasis and the stress response. It is populated by clustered chromaffin cells that secrete epinephrine or norepinephrine along with peptides into the bloodstream affecting distant target organs. Despite been heavily studied, the central control of adrenal medulla and in-situ spatiotemporal responsiveness remains poorly understood. For this work, we continuously monitored the electrical activity of individual adrenomedullary chromaffin cells in the living anesthetized rat using multielectrode arrays. We measured the chromaffin cell activity under basal and physiological stress conditions and characterized the functional micro-architecture of the adrenal medulla. Under basal conditions, chromaffin cells fired action potentials with frequencies between ~0.2 and 4 Hz. Activity was almost completely driven by sympathetic inputs coming through the splanchnic nerve. Chromaffin cells were organized into independent local networks in which cells fired in a specific order, with latencies from hundreds of microseconds to a few milliseconds. Electrical stimulation of the splanchnic nerve evoked almost exactly the same spatiotemporal firing patterns that occurred spontaneously. Hypoglycemic stress, induced by insulin administration resulted in increased activity of a subset of the chromaffin cells. In contrast, respiratory arrest induced by lethal anesthesia resulted in an increase in the activity of virtually all chromaffin cells before cessation of all activity. These results suggest a stressor-specific activation of adrenomedullary chromaffin cell networks and revealed a surprisingly complex electrical organization that likely reflects the dynamic nature of the adrenal medulla's neuroendocrine output during basal conditions and during different types of physiological stress.

Keywords: adrenal medulla; chromaffin cell; electrophysiology; in-vivo; stress response.


Conflict of interest statement

The authors declare that the research was conducted in the absence of any commercial or financial relationships that could be construed as a potential conflict of interest.

Figures

Figure 1
Figure 1
In vivo electrophysiological recordings from the intact adrenal medulla. (A) Low power bright field micrograph showing the adrenal cortex and the adrenal medulla. The white square represents the area shown in panel (B) B. Bright field micrograph showing the clustered architecture of the adrenal medulla (arrowhead = individual chromaffin cell). The silicon probe layout is shown in scale with the tissue, recording sites are presented as white squares. (C) Left, preparation in the anesthetized rat for simultaneous stimulation to the splanchnic nerve and the recording of the electrical activity in the adrenal medulla. Right, 64 channel silicon probe layout covering an area of 48x620 um (0.02976 mm2), the area of each individual recording site is 144µm2. (D) Spontaneous extracellular action potentials. Shown are recordings at low, medium and high expanded time scales. The most expanded recordings (bottom traces) show the waveforms of individual events. (E) A cell’s action potential projects distinct waveforms depending on its position to each recording site in the neighborhood (the asterisk represents the channel shown in (D), the set of these slightly different waveforms define a unit’s template and it is unique for each cell (solid line ± 2SD).
Figure 2
Figure 2
Basal chromaffin cell activity is driven by the splanchnic nerve. (A) Firing rate in 10 s bins from a set of units recorded for 10 minutes under basal conditions in a single preparation. (B) Averaged firing rate distribution from 576 units recorded during 40 preparations. (C) The local application of the sodium channel blocker TTX, reversibly blocks the activity in the adrenal medulla. The effect was seen in all recording sites. (D) Severing the splanchnic nerve proximally to the adrenal gland, irreversibly abolishes the electrical activity in the adrenal medulla. Basal activity was monitored for ten minutes prior to the cut, and the shown cut recording was done within a minute. (E) The systemic application of the nicotinic antagonist mecamylamine hydrochloride inhibits a subset of the chromaffin cells population in the adrenal medulla. The firing rate was estimated in 10 s bins and the normalized firing rate (z-score, see Methods) was calculated by considering the first 5 minutes of the recording as baseline. After the baseline period two 2 mg intraperitoneal doses of mecamylamine were administered at 5 and 25 minutes. (F) Shows the averaged firing rate from each unit during the baseline period vs. the final 5 minutes of the recording (blue=inhibited, red=increased).
Figure 3
Figure 3
Local network activity in the adrenal medulla. (A) Single channel recording showing multiple spikes (downward deflections). (B) Waveforms from multiple electrodes from the experiment in panel A were sorted to derive two distinct templates shown in orange and blue. The corresponding waveforms in the single channel recording in panel A are indicated by orange and blue vertical lines. The templates displayed complex waveforms comprised of multiple spikes occurring in fixed succession. (C) Some of these spikes were identified as units on their own by the sorting algorithm (e.g. a1 and a2, and b1, b2 and b3), and others were manually identified from other templates derived from another unit (e.g. a3). A temporal histogram aligned to the reference unit in the template (time = 0 ms), shows a precise firing pattern of the units (a3 was excluded from this analysis). (D) A lower time resolution temporal histogram (20 ms per bin) shows a 1 to 1 correlation between a1:a2 and b1:b2, but no correlation between a and b (the total number of events for each unit are: a1 = 2818, a2 = 2875, b1 = 1061 and b2 = 1061). (E) Shows the approximate location of the cells associated with each network in (C) The small empty circles represent the result of the triangulation calculation for each action potential the cell fired. Transparent large circles represent 20 µm diameter cells centered at the centroids of the clouds of points associated with a particular unit. (F) Network size distribution from a total of 40 preparations.
Figure 4
Figure 4
Synchronized firing in the adrenal medulla. (A) Firing sequence of a group of clustered cells, Top panel shows an extended template of the first unit (c1 in green) displaying the firing sequence of the later units (c2 to c5, blue, orange, yellow and purple), middle panel shows the mean latency ± SD (mean ± 2SD, c2 = 1.33 ± 0.06 ms, c3 = 3.39 ± 0.10 ms, c4 = 4.01 ± 0.10 ms and c5 = 4.26 ± 0.11 ms) in reference to c1, bottom panel shows the histograms in 50 µs bins of the firing distribution between the first cell and the subsequent cells in the network. (B) Shows the approximate location of the synchronized cells in A, the circles represent a 20 µm in diameter cell. (C) Firing synchronization between two distant cells, the circles represent the theoretical location of each cell over the probe, the filled squares correspond to the recording sites shown in the 2 ms templates on the right. The histogram at the bottom shows the firing distribution in 50 µs bins of the second cell (blue) in relationship to the first cell (green). (D) Left panel shows the relationship between latency and distance in coupled cells. The different colors indicate the order of appearance of each cellular component in the firing sequence. The abscissa for each dot is the latency from the previous action potential in the sequence; the ordinate is the distance between the calculated positions for the two cells. For example, the circled dot represents the 3rd component of a firing sequence. In this case this cell fired approximately 0.4 ms after the second cell in that sequence and the calculated distance between this cell and its predecessor in the sequence was ~250 µm. The most frequent sequence had action potentials from only two cells (blue dots). Top right histogram shows the relative frequency distribution of the latency between consecutive cell pairs (n=62, the color code matches previous panels), bottom right histogram shows the relative frequency of the distance between cell pairs. The red vertical lines mark the median, 0.59 ms for latency and 97 µm for distance.
Figure 5
Figure 5
Electrically evoked chromaffin cell activity. (A) Electrical stimulation of the splanchnic nerve evokes activity in the adrenal medulla. Representative recording of a single phase 10Hz-3.5mA stimulation train (red vertical lines). (B) The local application of TTX to the splanchnic nerve reversibly blocked the evoked action potentials in the adrenal medulla. (C) Evoked templates (solid lines) from two units. The evoked templates are identical to their spontaneous counterparts (dotted lines). (D) The evoked units present distinct latencies that range from 5 to 30 ms after the stimulus (red vertical line). The data are from the same experiments as in panel (C). (E) Distinct networks have different stimulus thresholds. The stimulus intensity was gradually increased from 0 to 6 mA in 0.5 mA steps.
Figure 6
Figure 6
Physiological stress response in the intact adrenal medulla. (A) The intraperitoneal administration of 3 increasing doses of insulin, 10, 100 and 1000 µg/kg (arrowheads), induced a decrease in the blood glucose levels (red line) that correlated with a significant increase in the firing frequency of a subpopulation of chromaffin cells. The z-score was calculated per unit in 10s bins by taking the first 900s as baseline (dashed square). The experiment was divided into five 15 minutes periods: baseline (1-900s), 10 µg/kg (901-1800s), 100 µg/kg (1801-2700s), 1000 µg/kg (2701-3600s) and final (3601-4500s) (B) Individual averaged firing rate for the different periods (red indicates units whose final averaged firing rate increased by more than 2 times its baseline’s SD or averaged z-score above 2, black indicates the units that presented no change between its baseline firing rate and final firing rate or an averaged z-score between ±2). (C) Linear regression between the baseline firing rate vs. final firing rate for 64 units recorded from 3 preparations. The coefficients for the linear fitting are 1.523 (1.265, 1.78 with 95% confidence bounds), the 45-degree dashed line represent no change between the two evaluated periods. (D) Waveform changes during hypoglycemia. Top template (yellow) displayed no changes between the baseline and the 1000 µg/kg periods, whilst additional spikes (arrows) were found in the bottom unit in comparison to its baseline template, both units presented a statistically significant increase in their firing rate between the two periods. (E) Firing rate change does not correlate with the spatial localization of the cells. The yellow and purple filled circles indicate the localization of the units shown in (D), which had increased firing rates upon hypoglycemia. The red and black unfilled circles represent the localization of additional units. Red circles represent cells whose firing rate increased; black circles represent cells whose firing rate decreased.
Figure 7
Figure 7
Physiological stress response to respiratory arrest in the intact adrenal medulla. (A) Generalized increase in the firing rate of the chromaffin cells was observed at the moment of respiratory arrest due to anesthesia overdose. Shown are the results of an individual experiment. Firing rates from 25 cells were analyzed. The black line corresponds to the average firing rate over time ± SEM (left axis). A normalized firing rate (Z-score) over time for each unit (row) is indicated by the color code (right axis). The baseline period is indicated by the dashed box. (B) Relation between the baseline firing rate and the peak firing rate after respiratory arrest. The combined results from three experiment are presented. The frequency 47 of 48 units increased following respiratory arrest. (C) Denervation virtually abolished the increase in firing rate upon respiratory arrest.

Similar articles

Cited by

References

    1. Moser T, Neher E. Estimation of Mean Exocytic Vesicle Capacitance in Mouse Adrenal Chromaffin Cells. Proc Natl Acad Sci USA (1997) 94(13):6735–40. doi: 10.1073/pnas.94.13.6735 - DOI - PMC - PubMed
    1. Moser T. Low-Conductance Intercellular Coupling Between Mouse Chromaffin Cells in Situ. J Physiol (1998) 506(Pt 1):195–205. doi: 10.1111/j.1469-7793.1998.195bx.x - DOI - PMC - PubMed
    1. Guerineau NC. Gap Junction Communication Between Chromaffin Cells: The Hidden Face of Adrenal Stimulus-Secretion Coupling. Pflugers Arch (2018) 470:89–96. doi: 10.1007/s00424-017-2032-9 - DOI - PubMed
    1. Colomer C, Martin AO, Desarmenien MG, Guerineau NC. Gap Junction-Mediated Intercellular Communication in the Adrenal Medulla: An Additional Ingredient of Stimulus-Secretion Coupling Regulation. Biochim Biophys Acta (2012) 1818:1937–51. doi: 10.1016/j.bbamem.2011.07.034 - DOI - PubMed
    1. Martin AO, Mathieu MN, Chevillard C, Guerineau NC. Gap Junctions Mediate Electrical Signaling and Ensuing Cytosolic Ca2+ Increases Between Chromaffin Cells in Adrenal Slices: A Role in Catecholamine Release. J Neurosci (2001) 21:5397–405. doi: 10.1523/JNEUROSCI.21-15-05397.2001 - DOI - PMC - PubMed

LinkOut - more resources