. 2022 Jun 26:2022:8400496.
doi: 10.1155/2022/8400496. eCollection 2022.

Salvianolic Acid B Attenuates Iopromide-Induced Renal Tubular Epithelial Cell Injury by Inhibiting the TLR4/NF- κ B/NLRP3 Signaling Pathway

Affiliations

Salvianolic Acid B Attenuates Iopromide-Induced Renal Tubular Epithelial Cell Injury by Inhibiting the TLR4/NF- κ B/NLRP3 Signaling Pathway

Ming Xin Pei et al. Evid Based Complement Alternat Med. .

Abstract

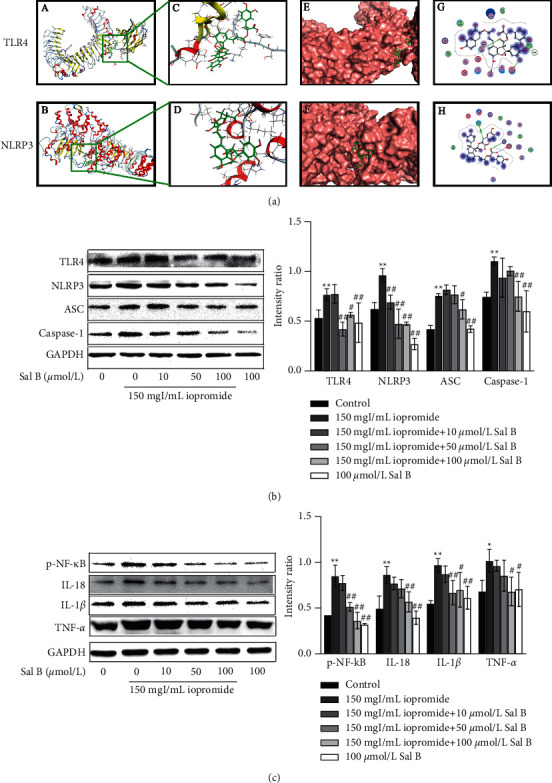
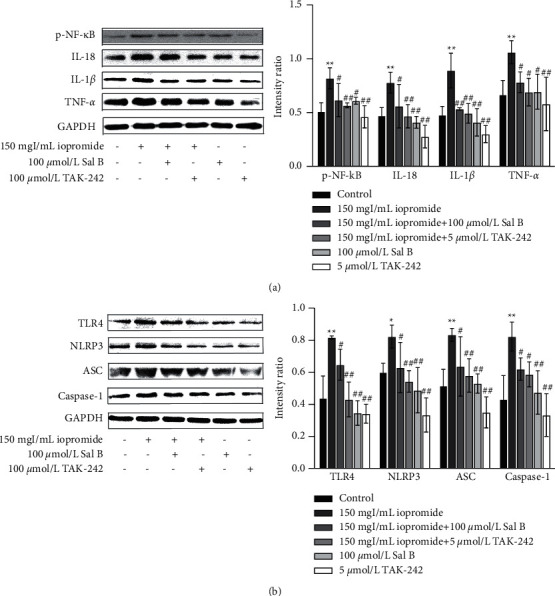
Postcontrast acute kidney injury (PC-AKI) is directly caused by the use of contrast, indicating a clear causal relationship between the contrast and the injury. Salvianolic acid B (Sal B), a water-soluble compound of Salvia miltiorrhiza, has a potent anti-inflammatory effect. We conducted a study to explore whether the protective effect of Sal B on iopromide-induced injury in human proximal tubular epithelial cells (HK-2 cells) is related to inhibition of the TLR4/NF-κB/NLRP3 signal pathway. The results showed that 100 μmol/L Sal B counteracted the decrease in cell viability, the increase of ROS and the number of apoptotic cells, and the decrease of mitochondrial membrane potential (ΔΨm) induced by iopromide. Molecular docking analysis showed that Sal B binds TLR4 and NLRP3 proteins. Moreover, 100 μmol/L Sal B also decreased the expression of TLR4, NLRP3, ASC, Caspase-1, IL-18, IL-1β, TNF-α, p-NF-κB, cleaved caspase-3, and the ratio of Bax/Bcl-2 induced by iopromide. TAK-242, a TLR4 antagonist, was added to further explore the mechanism of Sal B. However, the cotreatment group with TAK-242 and Sal B had no significant difference in cell viability and apoptosis rate compared to the treatment group with TAK-242 or Sal B alone. These results indicated that Sal B can inhibit the TLR4/NF-κB/NLRP3 signal pathway, resulting in the alleviation of iopromide-induced HK-2 cell injury.


Conflict of interest statement

The authors declare that the research was conducted in the absence of any commercial or financial relationships that could be construed as potential conflicts of interest.

Figures

Figure 1
Figure 1
Effect of iopromide and Sal B in HK-2 cell viability. (a) Several doses of iopromide were found to cause a significant decrease in cell viability n = 5. Data are the mean ± SD. P < 0.05, ∗∗P < 0.01 vs. control group. (b) Different doses of Sal B were found to reduce HK-2 cells against iopromide-induced injury. n = 5. Data are the mean ± SD. ∗∗P < 0.01 vs. control group; #P < 0.05, ##P < 0.01 vs. 150 mgI/mL iopromide group. Several concentrations of Sal B counteracted iopromide-induced apoptosis, Bax/Bcl-2, and cleaved caspase-3 protein levels in HK-2 cells. (c, d) Sal B counteracted the iopromide-induced apoptosis. n = 6. Data are the mean ± SD. ∗∗P < 0.01 vs. control group; ##P < 0.01 vs. iopromide group. (e) The protein levels of Bax/Bcl-2 and cleaved caspase-3 were significantly increased in iopromide-treated cells. These changes were lowered in the 100 μmol/L Sal B group n = 3. Data are the mean ± SD. P < 0.05, ∗∗P < 0.01 vs. control group; #P < 0.05, ##P < 0.01 vs. iopromide group.
Figure 2
Figure 2
Effect of Sal B on iopromide-induced ROS generation and loss of ΔΨm. (a) Compared with the iopromide-treated group, Sal B lowered the decrease in ROS generation. (b, c) Similar results were obtained by flow cytometry n = 3. Data are the mean ± SD. ∗∗P < 0.01 vs. control group; ##P < 0.01 vs. iopromide group. (d) ΔΨm levels in iopromide-treated cells were lower than those in the control cells. However, Sal B increased the ΔΨm level, indicating that it had a protective effect on iopromide-induced acute kidney injury. (e, f) Similar results were obtained using flow cytometry. n = 3. Data are the mean ± SD. ∗∗P < 0.01 vs. control group; #P < 0.05, ##P < 0.01 vs. iopromide group.
Figure 3
Figure 3
(a) Schematic diagram of the molecular docking between Sal B and target proteins. A, B: conformation of Sal B (green) and target proteins; C, D: the binding sites of Sal B (green) with TLR4 or NLRP3; E, F: schematic diagram of Sal B binding to TLR4 or NLRP3; G, H: the docking amino acid residues of Sal B and TLR4 or NLRP3. Sal B decreased the protein levels of TLR4, NLRP3, ASC, Caspase-1, p-NF-κB, IL-18, IL-1β, and TNF-α. (b) Iopromide treatment caused a significant increase in TLR4, NLRP3, ASC, and Caspase-1. Sal B counteracted the iopromide-induced increase in these protein levels. n = 3. Data are the mean ± SD. ∗∗P < 0.01 vs. control group; #P < 0.05, ##P < 0.01 vs. iopromide group. (c) The protein levels of p-NF-κB, IL-18, IL-1β, and TNF-α were significantly increased in iopromide-treated cells. These changes were reduced by 100 μmol/L Sal B n = 3. Data are the mean ± SD. P < 0.05, ∗∗P < 0.01 vs. control group; #P < 0.05, ##P < 0.01 vs. iopromide group.
Figure 4
Figure 4
The counteraction of Sal B or TAK-242 on the iopromide-induced apoptosis. (a) TAK-242 was found to protect HK-2 cells against iopromide-induced injury n = 5. Data are the mean ± SD. ∗∗P < 0.01 vs. control group; #P < 0.05, ##P < 0.01 vs. iopromide group. (b) Sal B or TAK-242 increased HK-2 cell viability. n = 5. Data are the mean ± SD. ∗∗P < 0.01 vs. control group; ##P < 0.01 vs. iopromide group. (c, d) Sal B or TAK-242 attenuated the iopromide-induced apoptosis. n = 6. Data are the mean ± SD. ∗∗P < 0.01 vs. control group; ##P < 0.01 vs. iopromide group.
Figure 5
Figure 5
Sal B or TAK-242 counteracted the iopromide-induced apoptosis. (a, b) Sal B or TAK-242 reduced the number of apoptotic cells, as seen in flow cytometry. n = 3. Data are the mean ± SD. ∗∗P < 0.01 vs. control group; ##P < 0.01 vs. iopromide group. (c) Sal B reduced the Bax/Bcl-2 ratio and cleaved caspase-3 n = 3. Data are the mean ± SD. ∗∗P < 0.01 vs. control group. #P < 0.05, ##P < 0.01 vs. iopromide group.
Figure 6
Figure 6
Effect of Sal B or TAK-242 in ROS generation and the levels of ΔΨm. (a) The green fluorescence in iopromide-treated cells was higher than that in control cells. However, Sal B or TAK-242 could reduce the fluorescence intensity. (b, c) Similar results were obtained by flow cytometry n = 3. Data are the mean ± SD. ∗∗P < 0.01 vs. control group; ##P < 0.01 vs. iopromide group. (d) The green fluorescence in iopromide-treated cells was lower than that in control cells. Sal B or TAK-242 treatment increased the fluorescence intensity. (e, f) Similar results were obtained by flow cytometry. n = 6. Data are the mean ± SD. ∗∗P < 0.01 vs. control group; ##P < 0.01 vs. iopromide group.
Figure 7
Figure 7
Effect of Sal B or TAK-242 in the levels of TLR4, NLRP3, ASC, Caspase-1, p-NF-κB, IL-18, IL-1β, and TNF-α proteins induced by iopromide. (a) Sal B reduced the levels of p-NF-κB, IL-18, IL-1β, and TNF-α n = 3. Data are the mean ± SD. ∗∗P < 0.01 vs. control group; #P < 0.05, ##P < 0.01 vs. iopromide group. (b) Sal B decreased the levels of TLR4, NLRP3, ASC, and Caspase-1; n = 3. Data are the mean ± SD. P < 0.05, ∗∗P < 0.01 vs. control group; #P < 0.05, ##P < 0.01 vs. iopromide group.
Figure 8
Figure 8
Effects of Sal B and TAK-242 on cell viability and apoptosis. (a) The cotreatment with Sal B and TAK-242 did not further enhance cell viability. n = 5. Data are the mean ± SD. ∗∗P < 0.01 vs. control group; ##P < 0.01 vs. iopromide group. (b) The effect of cotreatment with Sal B and TAK-242 obtained using flow cytometry. n = 3. Data are the mean ± SD. ∗∗P < 0.01 vs. control group; ##P < 0.01 vs. iopromide group.
Figure 9
Figure 9
Effect of a schematic diagram showing the role of Sal B in the attenuation of iopromide-induced HK-2 cell injury by inhibiting the TLR4/NF-κB/NLRP3 signaling pathway.

References

    1. Wang C., Li G., Liang X., et al. Predictive value of fibrinogen-to-albumin ratio for post-contrast acute kidney injury in patients undergoing elective percutaneous coronary intervention. Medical Science Monitor . 2020;26 doi: 10.12659/msm.924498.e924498 - DOI - PMC - PubMed
    1. Azzalini L., Spagnoli V., Ly H. Q. Contrast-induced nephropathy: from pathophysiology to preventive strategies. Canadian Journal of Cardiology . 2016;32(2):247–255. doi: 10.1016/j.cjca.2015.05.013. - DOI - PubMed
    1. Zhang F., Lu Z., Wang F. Advances in the pathogenesis and prevention of contrast-induced nephropathy. Life Sciences . 2020;259 doi: 10.1016/j.lfs.2020.118379.118379 - DOI - PubMed
    1. Mamoulakis C., Fragkiadoulaki I., Karkala P., et al. Contrast-induced nephropathy in an animal model: evaluation of novel biomarkers in blood and tissue samples. Toxicology Reports . 2019;6:395–400. doi: 10.1016/j.toxrep.2019.04.007. - DOI - PMC - PubMed
    1. Chen Y. H., Fu Y. C., Wu M. J. Does resveratrol play a role in decreasing the inflammation associated with contrast induced nephropathy in rat model? Journal of Clinical Medicine . 2019;8(2):p. 147. doi: 10.3390/jcm8020147. - DOI - PMC - PubMed