A Novel Non-Invasive Approach Based on Serum Ceruloplasmin for Identifying Non-Alcoholic Steatohepatitis Patients in the Non-Diabetic Population
- PMID: 35795637
- PMCID: PMC9252518
- DOI: 10.3389/fmed.2022.900794
A Novel Non-Invasive Approach Based on Serum Ceruloplasmin for Identifying Non-Alcoholic Steatohepatitis Patients in the Non-Diabetic Population
Abstract
Background and aim: Few non-invasive models were established to identify patients with non-alcoholic steatohepatitis (NASH). Liver biopsy remains the gold standard in the clinic. Decreased serum ceruloplasmin (CP) is reported in patients with non-alcoholic fatty liver disease (NAFLD). We aimed to develop a non-invasive model incorporating CP for identifying NASH from NAFLD without type 2 diabetes mellitus (T2DM).
Methods: A total of 138 biopsy-proven patients with NAFLD without T2DM were enrolled. The CP ratio was calculated for standardization as the CP value divided by the lower limit of normal. The clinical, anthropometric, biochemical, and histological parameters were compared between the low and high CP ratio groups divided by the median value. Multivariate logistic regression analysis was performed to develop a model for identifying NASH in patients with NAFLD.
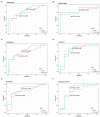
Results: The medians of the high (n = 69) and low (n = 69) CP ratio groups were 1.43 (1.28-1.61) and 1.03 (0.94-1.12), respectively. A comparison of the two groups showed that the severity of steatosis, hepatocellular ballooning, inflammation activity, fibrosis, and liver iron deposition decreased along with the CP ratio (p < 0.05). The median CP ratio of patients with NASH was significantly lower than those with NAFL [1.15 (1.01-1.41) vs. 1.33 (1.24-1.54), p = 0.001]. A novel model which consists of the CP ratio, BMI, and aspartate aminotransferase (AST) was developed. The AUCs of the model in discriminating NASH from NAFLD was 0.796 (0.694-0.899) and 0.849 (0.713-0.984) in the training and validation groups, and 0.836 (0.659-1.000), 0.833 (0.705-0.962), and 0.821 (0.612-1.000) in patients with normal serum alanine aminotransferase, AST, and both levels, respectively.
Conclusions: Decreased CP ratio is associated with more severe histological activity, a diagnosis of NASH, and hepatic iron deposition among patients with NAFLD without T2DM. The CP ratio model could be served as a non-invasive approach to identifying patients with NASH, which might reduce the need for liver biopsy.
Keywords: ceruloplasmin; logistic models; non-alcoholic fatty liver disease; non-alcoholic steatohepatitis; non-invasive diagnosis.
Copyright © 2022 Wang, Zhou, Wang, Zhu, Chen, Li, Lu, Zhang, Shen, Liu and Chen.
Conflict of interest statement
The authors declare that the research was conducted in the absence of any commercial or financial relationships that could be construed as a potential conflict of interest.
Figures


References
LinkOut - more resources
Full Text Sources
Miscellaneous

