

Transient rapamycin treatment during developmental stage extends lifespan in Mus musculus and Drosophila melanogaster
- PMID: 35796299
- PMCID: PMC9442325
- DOI: 10.15252/embr.202255299
Transient rapamycin treatment during developmental stage extends lifespan in Mus musculus and Drosophila melanogaster
Abstract
Lifespan is determined by complex and tangled mechanisms that are largely unknown. The early postnatal stage has been proposed to play a role in lifespan, but its contribution is still controversial. Here, we show that a short rapamycin treatment during early life can prolong lifespan in Mus musculus and Drosophila melanogaster. Notably, the same treatment at later time points has no effect on lifespan, suggesting that a specific time window is involved in lifespan regulation. We also find that sulfotransferases are upregulated during early rapamycin treatment both in newborn mice and in Drosophila larvae, and transient dST1 overexpression in Drosophila larvae extends lifespan. Our findings unveil a novel link between early-life treatments and long-term effects on lifespan.
Keywords: aging; early-life treatment; mTOR; sulfotransferases.
© 2022 The Authors. Published under the terms of the CC BY 4.0 license.
Figures
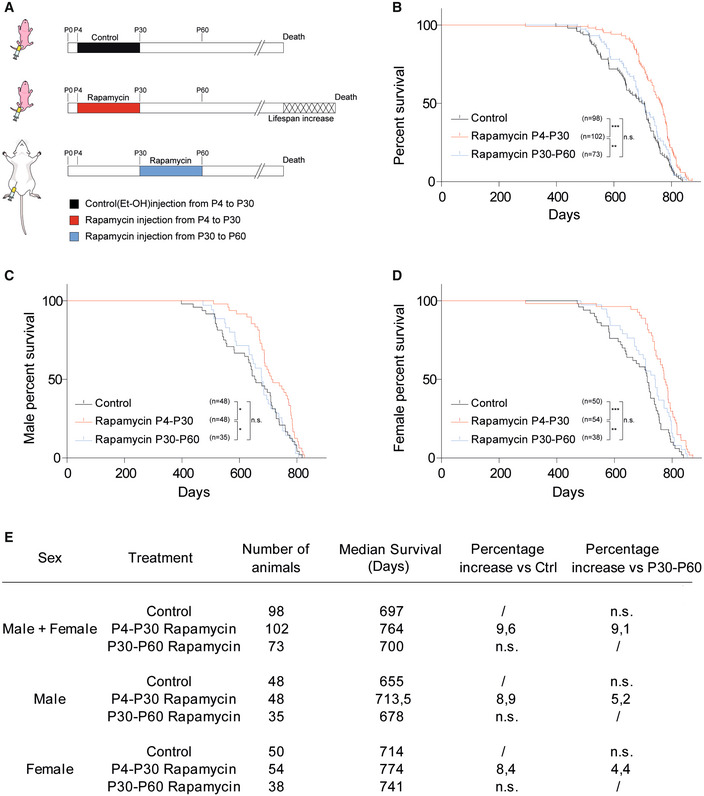
- A
Schematic illustration of the experimental procedure and results. Control mice were intraperitoneally injected daily with EtOH from postnatal day 4 to postnatal day 30 (P4‐P30). Treated mice were intraperitoneally injected daily with rapamycin during two distinct temporal windows, P4‐P30 or P30‐P60. P4‐P30 rapamycin‐treated mice show a lifespan increment compared with control and P30‐P60 rapamycin‐treated mice.
- B
Survival curves of control mice, P4‐P30 rapamycin‐treated mice, and P30‐P60 rapamycin‐treated mice including data from both sexes (males + females). Log‐rank (Mantel–Cox) test.
- C, D
Survival curves of male (C) and female (D) control mice, P4‐P30 rapamycin‐treated mice, and P30‐P60 rapamycin‐treated mice. Log‐rank (Mantel–Cox) test.
- E
Log‐rank test on survival analysis (summary table).
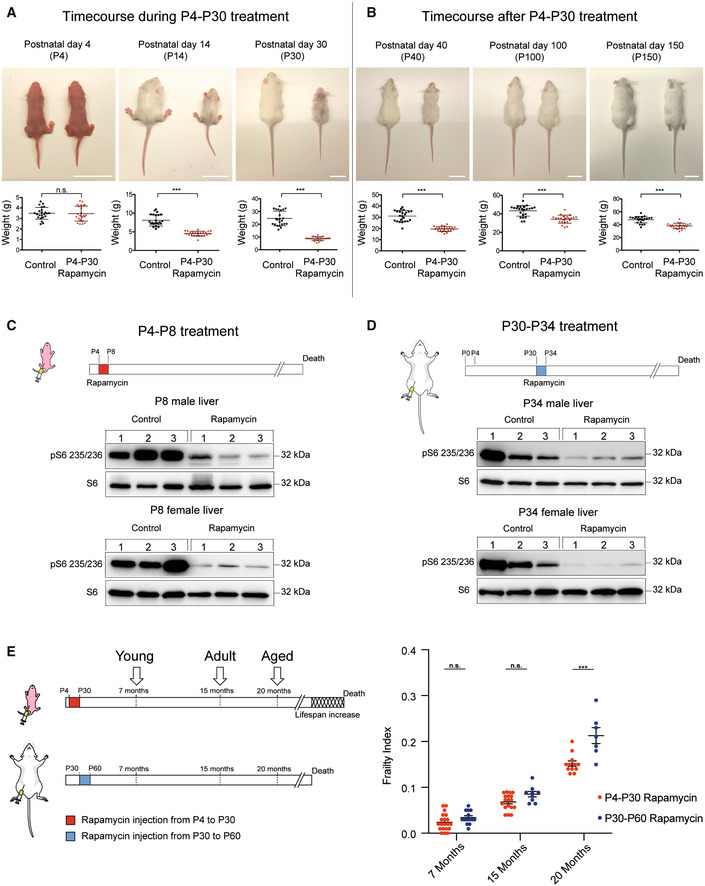
- A
Upper panels: Representative pictures showing rapamycin effects on mouse body size during P4‐P30 treatment. Images of n = 23 biological replicates (both for control and for rapamycin‐treated mice) have been taken at P4, P14, and P30 (end of the treatment). Scale bar: 3 cm. Lower panels: Scatter dot plot indicating body weight of control and rapamycin‐treated mice during P4‐P30 treatment. Data are indicated as mean + SD. Two‐tailed Student's t‐test; ***P < 0.0005, n.s., not significant.
- B
Upper panels: Representative pictures showing rapamycin effects on mouse body size after P4‐P30 treatment. Images of n = 23 biological replicates (both for control and for rapamycin‐treated mice) have been taken at P40, P100, and P150. Scale bar: 3 cm. Lower panels: Scatter dot plot indicating body weight of control and P4‐P30 rapamycin‐treated mice after the treatment. Data are indicated as mean + SD. Two‐tailed Student's t‐test; ***P < 0.0005, n.s., not significant.
- C, D
Upper part, schematic illustration of the experimental procedure. Western blot analysis of S6 ribosomal protein and phospho‐S6 ribosomal protein (Ser235/236) from whole‐liver protein extracts of female and male at P8 (C) and P34 (D) rapamycin‐treated mice. Mice were sampled after 4 days of EtOH or rapamycin treatment.
- E
Schematic illustration of the different time points analyzed (left side) and Frailty Index box (right side) of P4‐P30 and P30‐P60 rapamycin‐treated mice. Red scatter dots indicate the Frailty Index of P4‐P30 rapamycin‐treated mice at 7 months (n = 20; biological replicates), 15 months (n = 18; biological replicates), and 20 months (n = 12; biological replicates). Blue scatter dots indicate the Frailty Index of P30‐P60 rapamycin‐treated mice at 7 months (n = 14; biological replicates), 15 months (n = 9; biological replicates), and 20 months (n = 7; biological replicates). Data are indicated as mean + SEM. Two‐way ANOVA; ***P < 0.0005, n.s., not significant.
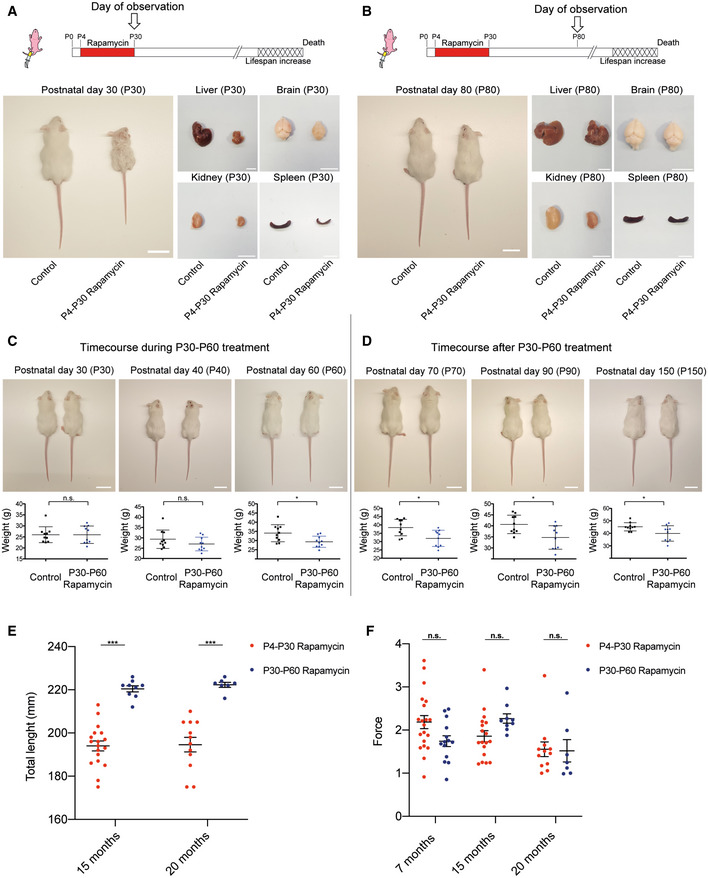
- A, B
Upper panels: Schematic illustration of the experimental procedures. Rapamycin effects on body and organ size in P4‐P30 rapamycin‐treated mice. Representative images of liver, brain, kidney, and spleen have been taken at P30 (A) and P80 (B). Scale bar: 3 cm.
- C
Upper panels: Representative images showing rapamycin effects on mice body size during P30‐P60 treatment. Images of n = 10 biological replicates (both for control and for rapamycin‐treated mice) have been taken at P30, P40, and P60 (end of treatment). Scale bar: 3 cm. Lower panels: Scatter dot plot indicating body weight of control and P30‐P60 rapamycin‐treated mice during treatment. Data are indicated as mean + SD. Two‐tailed Student's t‐test; *P < 0.05, n.s., not significant.
- D
Upper panels: Representative images showing rapamycin effects on mice body size after P30‐P60 treatment. Images of n = 10 biological replicates (both for control and for rapamycin‐treated mice) have been taken at P70, P90, and P150. Scale bar: 3 cm. Lower panels: Scatter dot plot indicating body weight of control and P30‐P60 rapamycin‐treated mice after treatment. Data are indicated as mean + SD. Two‐tailed Student's t‐test; *P < 0.05.
- E
Dot plots indicating the total length (mm) of P4‐P30 and P30‐P60 rapamycin‐treated mice. Red scatter dots indicate the measurements of P4‐P30 rapamycin‐treated mice at 15 months (n = 18) and 20 months (n = 12). Blue scatter dots indicate the measurements of P30‐P60 rapamycin‐treated mice at 15 months (n = 9) and 20 months (n = 7). Data are indicated as mean + SEM.
- F
Dot plots indicating the force (Newton/grams) resulted from grip strength analysis of P4‐P30 and P30‐P60 rapamycin‐treated mice. Red scatter dots indicate the measurements from P4‐P30 rapamycin‐treated mice at 7 months (n = 20), 15 months (n = 18), and 20 months (n = 12). Blue scatter dots indicate the measurements from P30‐P60 rapamycin mice at 7 months (n = 14), 15 months (n = 9), and 20 months (n = 7). Data are indicated as mean + SEM.
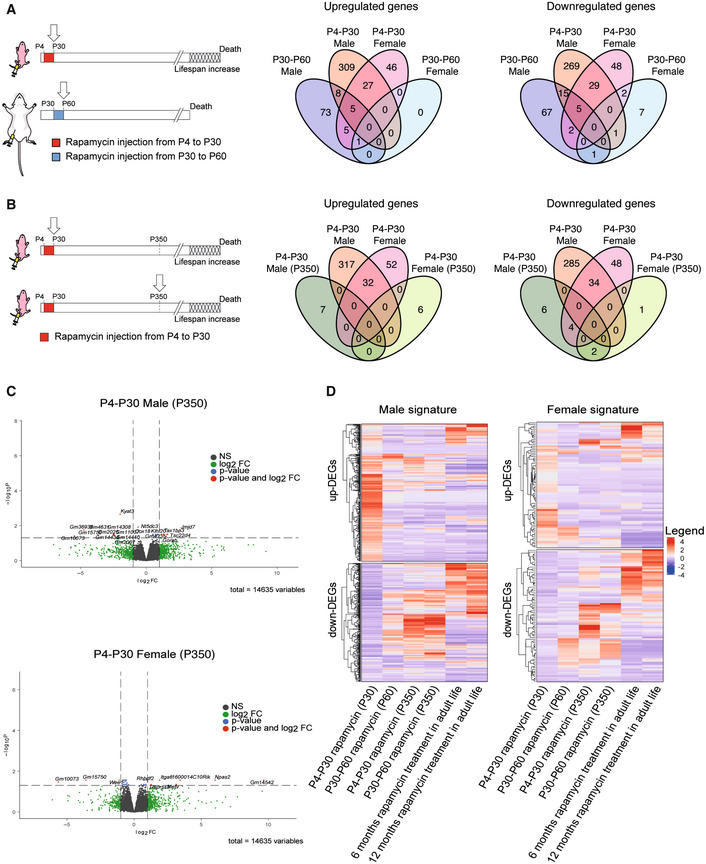
- A
Schematic illustration of the experimental procedures (left). Landscape of up‐ and downregulated genes across P4‐P30 and P30‐P60 treatments in male and female mice. Venn diagrams are used to highlight private and shared differentially expressed genes.
- B
Schematic illustration of the experimental procedures (left). Landscape of up‐ and downregulated genes across P4‐P30 treatment processed at the last day of treatment and at P350 in male and female mice. Venn diagrams are used to highlight private and shared differentially expressed genes.
- C
Volcano plots showing the transcriptional changes in P4‐P30 rapamycin‐treated male (upper panel) and female (lower panel) mice processed at P350. The log2FC is represented on the x‐axis. The y‐axis shows the −log10 of the corrected P‐value. A P‐value of 0.05 and log2FC of 1 and −1 are indicated by gray lines. Top 10 upregulated and top 10 downregulated genes (when available) are labeled with gene symbols.
- D
Log2FC of genes that are differentially expressed only in male (left side) and female (right side) in response to P4‐P30 treatment at the last day of treatment is compared, through heatmaps, with corresponding log2FC profiles in: P30‐P60 on the last day of treatment; P4‐P30 and P30‐P60 treatment analyzed at P350; and published data on chronic rapamycin treatment in adult life (6 and 12 months; Tyshkovskiy et al, 2019).
- A
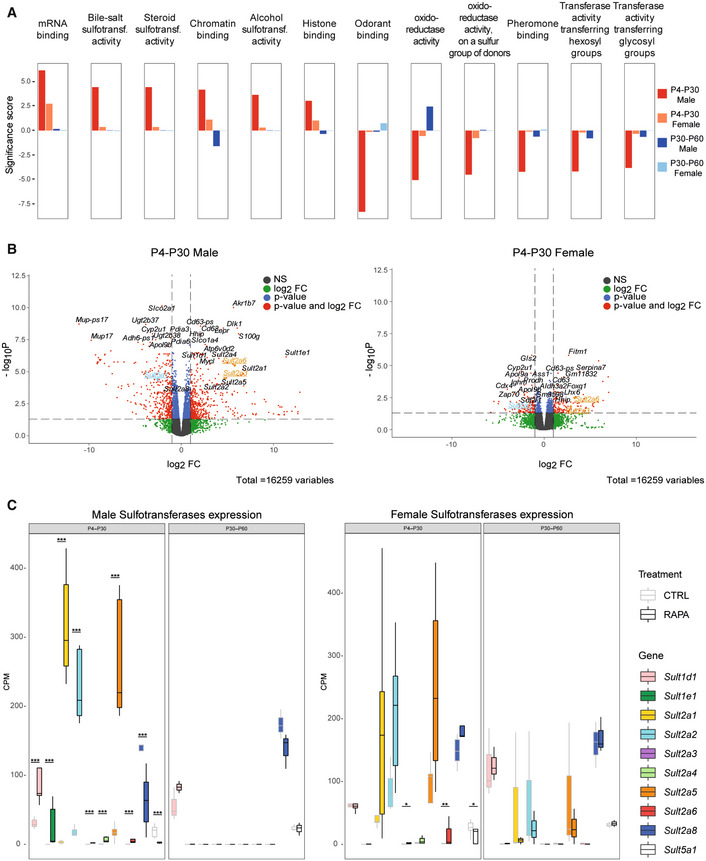
Gene Set Enrichment Analysis (GSEA) results of P4‐P30 and P30‐P60 at the last day of treatment in male and female mice. Significance score, calculated as ‐log10(q‐value) corrected by the sign of regulation, is plotted on the y‐axis. Plots are representative of the top 12 GO Molecular Function (MF) terms with higher/lower significance scores for the male P4‐P30 rapamycin‐treated mice (top 6 with higher significance scores and top 6 with lower significance scores). The whole list of enriched GO terms is available in Dataset EV4.
- B
Volcano plots showing the transcriptional changes in P4‐P30 rapamycin‐treated male (left side) and female (right side) mice. Each circle represents a gene. Underlined and highlighted terms are common SULT genes shared by males and females (orange for upregulated genes, blue for downregulated genes). The log2FC is represented on the x‐axis. The y‐axis shows the −log10 of the corrected P‐value. A P‐value of 0.05 and log2FC of 1 and −1 are indicated by gray lines. Top 10 upregulated and top 10 downregulated genes are labeled with gene symbols.
- C
Expression profile of sulfotransferases deregulated only in the P4‐P30 time window in male (left side) and female (right side) rapamycin‐treated mice. Values for treated (dark borders) and control (light borders) samples across the different conditions are shown as median CPM with bars representing standard deviations across the five biological replicates. P‐values were generated by the edgeR DEG analysis, detailed in the Methods. *P < 0.05, **P < 0.005, and ***P < 0.0005.
- A
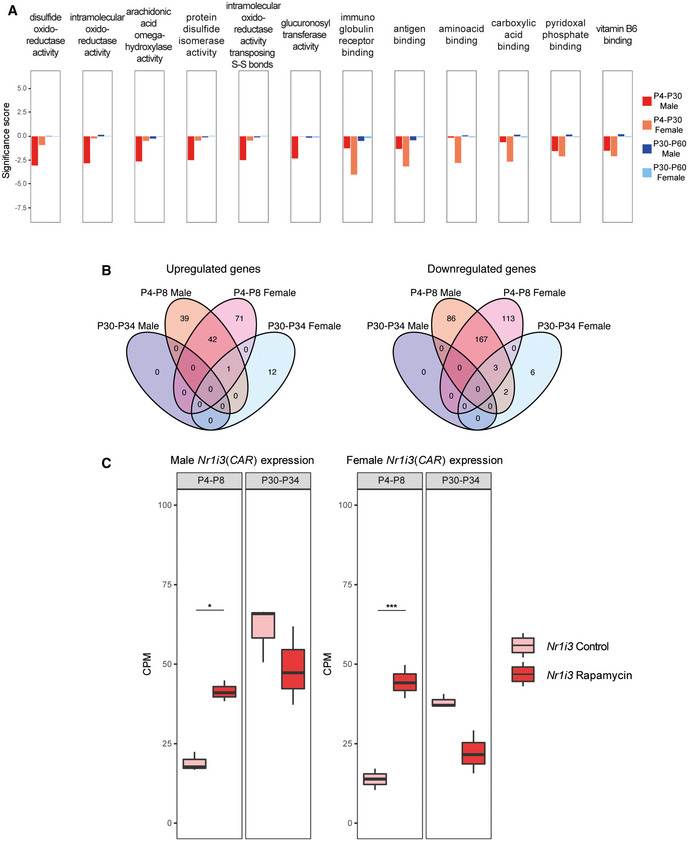
Gene Set Enrichment Analysis (GSEA) results of P4‐P30 and P30‐P60 treatments in male and female mice. Significance score, calculated as log10 (q‐value) corrected by the sign of regulation, is plotted on the y‐axis. The whole list of enriched GO terms is available in Dataset EV4.
- B
Landscape of up‐ and downregulated genes across the P4‐P8 and P30‐P34 treatments in male and female mice. Venn diagrams are used to highlight private and shared differentially expressed genes.
- C
Expression profile of Nr1i3 (CAR) gene across P4‐P8 and P30‐P34 male (left side) and female (right side) rapamycin‐treated mice. Values in treated and control samples across the different conditions are shown as median CPM with bars representing standard deviations across the biological replicates. Data distribution is presented through boxplots, where the central bar represents the median, while the lower and upper hinges correspond to the first and third quartiles (the 25th and 75th percentiles). The upper/lower whisker extends from the hinge to the largest/smallest value no further than 1.5 * IQR from the hinge (where IQR is the interquartile range, or distance between the first and third quartiles). P‐values were generated by the edgeR DEG analysis, detailed in the Methods. *P < 0.05, ***P < 0.0005, n.s., not significant.
- A, B
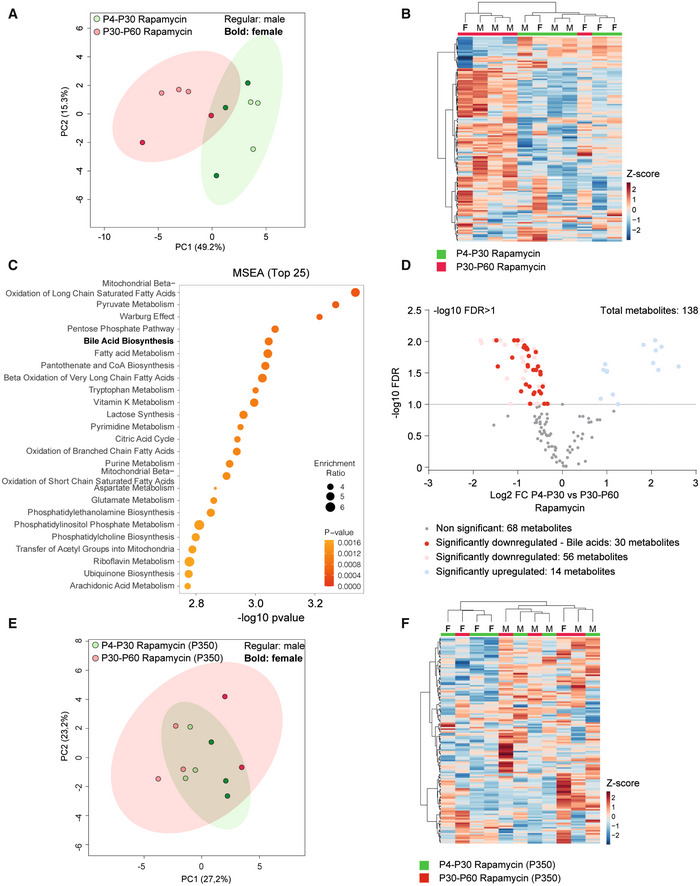
Principal component analysis (PCA) (A) and heatmap (B) of liver metabolomic profile from P4‐P30 (green samples) and P30‐P60 (red samples) mice treated with rapamycin.
- C
Top 25 metabolic pathways enriched in P4‐P30 compared with P30‐P60 mice treated with rapamycin. Metabolic Set Enrichment Analysis (MSEA) was performed taking advantage of MetaboAnalyst 5.0 webtool interrogating the KEGG database. The x‐axis shows the −log10 of P‐value.
- D
Volcano plots showing the metabolomic changes in P4‐P30 compared with P30‐P60 mice treated with rapamycin. Each circle represents one metabolite. The log2 fold change is represented on the x‐axis. The y‐axis shows the −log10 of the false discovery rate (FDR). A FDR of 0.1 is indicated by gray line. Gray, pink, and light blue dots represent unchanged, significantly downregulated, and significantly upregulated metabolites, respectively. Red dots represent significantly downregulated bile acids in P4‐P30 compared with P30‐P60 mice treated with rapamycin.
- E, F
Principal component analysis (PCA) (E) and heatmap (F) of liver metabolomic profile from P4‐P30 (green samples) and P30‐P60 (red samples) mice transiently treated with rapamycin and analyzed at P350. F, female; M, male.
- A, B
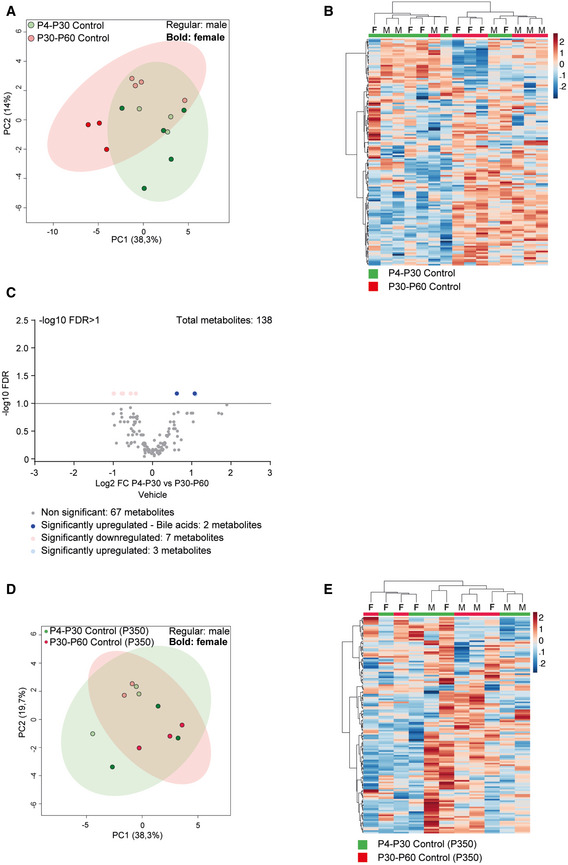
Principal component analysis (PCA) (A) and heatmap (B) of liver metabolomic profile from P4‐P30 (green samples) and P30‐P60 (red samples) mice treated with vehicle.
- C
Volcano plots showing the metabolomic changes in P4‐P30 compared with P30‐P60 mice treated with vehicle. Each circle represents one metabolite. The log2 fold change is represented on the x‐axis. The y‐axis shows the ‐log10 of the FDR. A FDR of 0.1 is indicated by gray line. Gray, pink, and light blue dots represent unchanged, significantly downregulated, and significantly upregulated metabolites, respectively. Blue dots represent significantly upregulated bile acids in P4‐P30 compared to P30‐P60 mice treated with vehicle.
- D, E
Principal component analysis (PCA) (D) and heatmap (E) of liver metabolomic profile from P4‐P30 (green samples) and P30‐P60 (red samples) mice transiently treated with vehicle and analyzed at P350. F, female; M, male.
- A
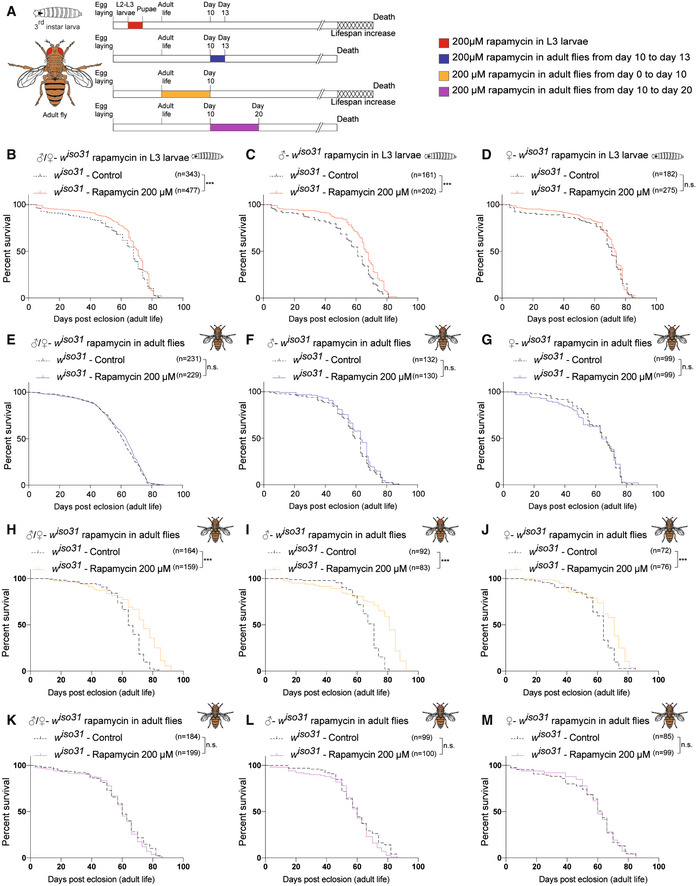
Schematic illustration of the experimental procedure and results. Flies were transiently treated during larval stages with rapamycin 200 μM starting from 72 h after egg laying to puparium formation (red) or during adulthood, from day 0 to day 10 (orange), from day 10 to day 13 (blue), or from day 10 to day 20 (purple). Rapamycin administration during development and during the first 10 days of life, but not at later time points, leads to lifespan increment.
- B
Survival curves of w iso31 flies transiently treated from 72 h after egg laying till puparium formation (males + females) with EtOH (control) or rapamycin 200 μM.
- C, D
Survival curves of male (C) and female (D) w iso31 flies transiently treated from 72 h after egg‐laying till puparium formation with EtOH (control) or rapamycin 200 μM.
- E
Survival curves of w iso31 flies transiently treated in adult stage, from day 10 to 13 (males + females), with EtOH (control) or rapamycin 200 μM.
- F, G
Survival curves of male (F) and female (G) w iso31 flies transiently treated in adult stage, from day 10 to 13, with EtOH (control) or rapamycin 200 μM.
- H
Survival curves of w iso31 flies transiently treated from day 0 to day 10 (males + females) with EtOH (control) or rapamycin 200 μM.
- I, J
Survival curves of male (I) and female (J) w iso31 flies transiently treated from day 0 to day 10 with EtOH (control) or rapamycin 200 μM.
- K
Survival curves of w iso31 flies transiently treated from day 10 to 20 (males + females), with EtOH (control) or rapamycin 200 μM.
- L, M
Survival curves of male (L) and female (M) w iso31 flies transiently treated from day 10 to 20, with EtOH (control) or rapamycin 200 μM.
- A
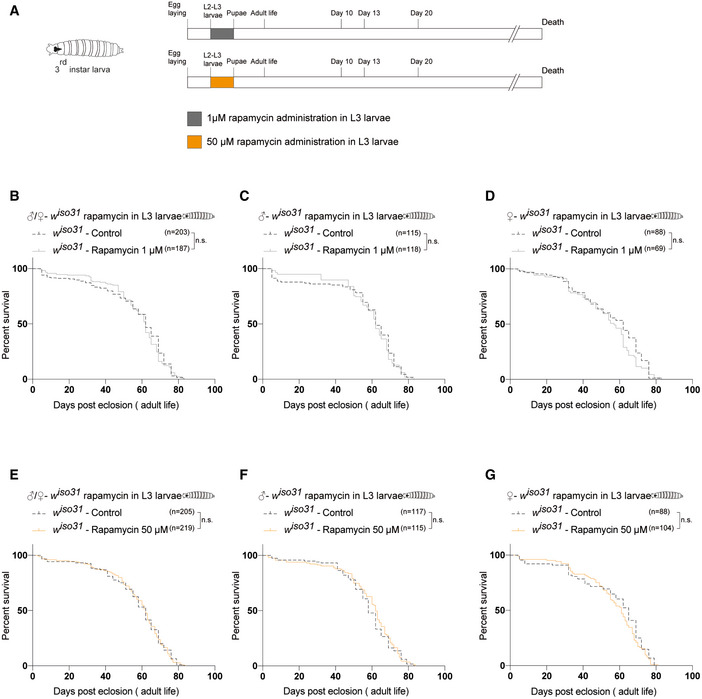
Schematic illustration of the experimental procedure and results. Flies were transiently treated during larval stages from 72 h after egg laying to puparium formation with 1 μM (gray) or 50 μM rapamycin (yellow).
- B
Survival curves of w iso31 flies transiently treated from 72 h after egg laying until puparium formation (males + females) with EtOH (control) or rapamycin 1 μM.
- C, D
Survival curves of male (C) and female (D) w iso31 flies transiently treated from 72 h after egg laying until puparium formation with EtOH (control) or rapamycin 1 μM.
- E
Survival curves of w iso31 flies transiently treated from 72 h after egg laying until puparium formation (males + females) with EtOH (control) or rapamycin 50 μM.
- F, G
Survival curves of male (F) and female (G) w iso31 flies transiently treated from 72 h after egg laying until puparium formation with EtOH (control) or rapamycin 50 μM.
- A
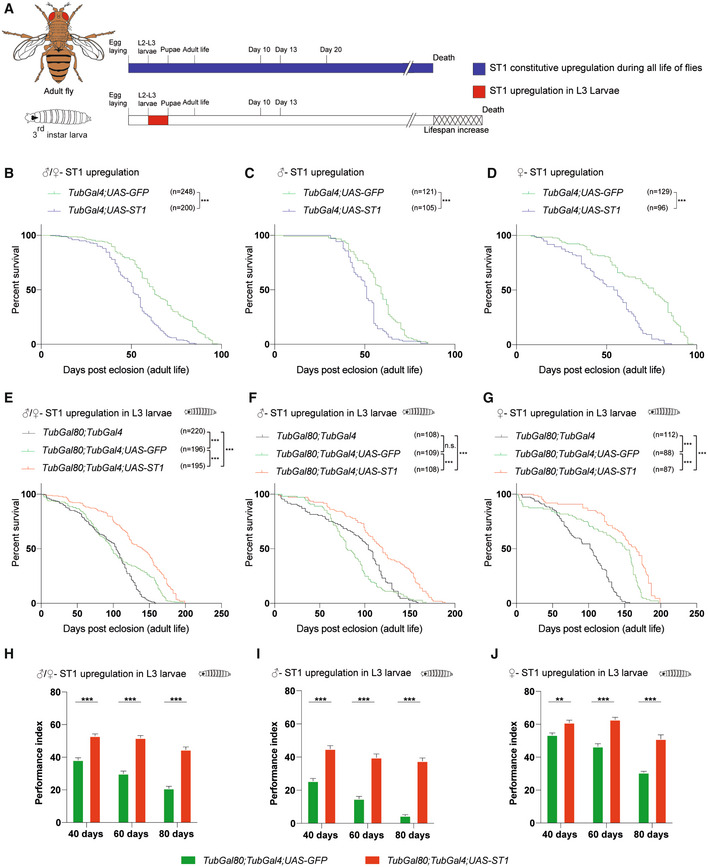
Schematic illustration of the experimental procedure and results. Constitutive dST1 overexpression during the entire life (blue) of flies does not increase lifespan. Transient dST1 overexpression during larval stage (red) leads to lifespan increment.
- B
Survival curves of flies harboring constitutive dST1 upregulation (TubGal4/UAS‐dST1) compared with control strain (UAS‐GFP;TubGal4/+) males + females. Log‐rank (Mantel–Cox) test, ***P < 0.0005.
- C, D
Survival curves of flies harboring constitutive dST1 upregulation (TubGal4/UAS‐dST1) in male (C) and female (D) compared with control strain (UAS‐GFP;TubGal4/+). Log‐rank (Mantel–Cox) test, ***P < 0.0005.
- E
Survival curves of flies upon upregulation of dST1 during larval stages (tubGal80 TS /+;TubGal4/UAS‐dST1) compared with the control strain tubGal80 TS /UAS‐GFP;TubGal4/+ (males + females) and the parental control tubGal80 TS ;TubGal4 (males + females). Log‐rank (Mantel–Cox) test, ***P < 0.0005.
- F, G
Survival curves of male (F) and female (G) flies upon upregulation of dST1 during larval stages in (tubGal80 TS /+;TubGal4/UAS‐dST1) compared to control strain tubGal80 TS /UAS‐GFP;TubGal4/+ and the parental control tubGal80 TS ;TubGal4. Log‐rank (Mantel–Cox) test, ***P < 0.0005, n.s., not significant.
- H
Climbing performance index of tubGal80 TS /UAS‐GFP;TubGal4/+ and tubGal80 TS /+;TubGal4/UAS‐dST1 at different time points: 40 days (n = 176 and 196, respectively; biological replicates), 60 days (n = 159 and 178, respectively; biological replicates), and 80 days (n = 119 and 158, respectively; biological replicates). Upregulation of dST1 has been induced only during larval stages. Data are indicated as mean + SEM. Two‐way ANOVA, ***P < 0.0005.
- I
Climbing performance index of male tubGal80 TS /UAS‐GFP;TubGal4/+ and tubGal80 TS /+;TubGal4/UAS‐dST1 at different time points: 40 days (n = 93 and 93, respectively; biological replicates), 60 days (n = 79 and 81, respectively; biological replicates), and 80 days (n = 41 and 70, respectively; biological replicates). Upregulation of dST1 has been induced only during larval stages. Data are indicated as mean + SEM. Two‐way ANOVA, ***P < 0.0005.
- J
Climbing performance index of female tubGal80 TS /UAS‐GFP;TubGal4/+ and tubGal80 TS /+;TubGal4/UAS‐dST1 at different time points: 40 days (n = 83 and 103, respectively; biological replicates), 60 days (n = 80 and 97, respectively; biological replicates), and 80 days (n = 78 and 88, respectively; biological replicates). Upregulation of dST1 has been induced only during larval stages. Data are indicated as mean + SEM. Two‐way ANOVA; **P < 0.005, ***P < 0.0005.
- A
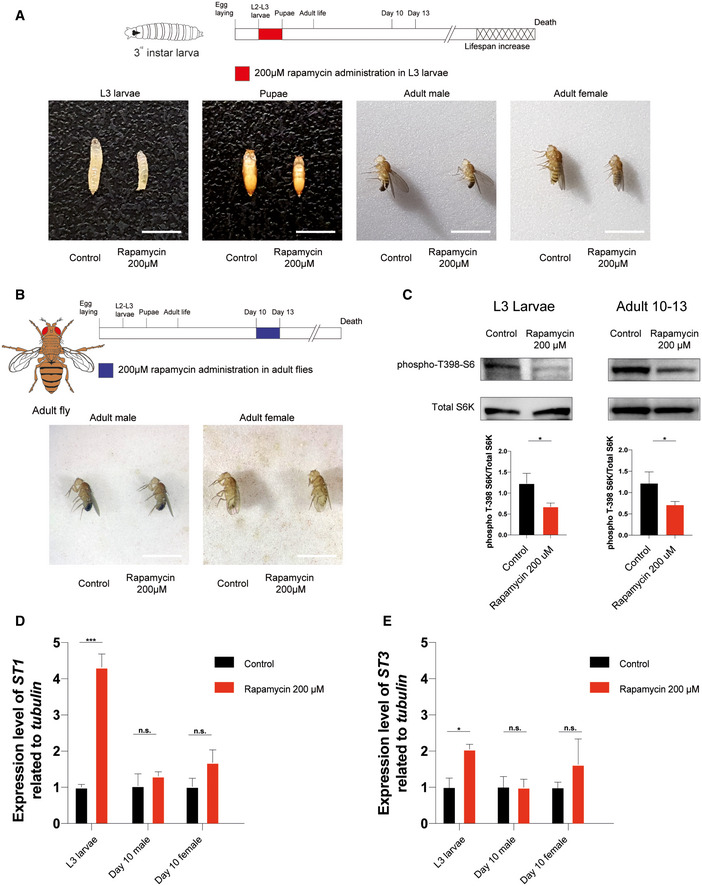
Representative images showing rapamycin effects on Drosophila body size during and after treatment on third‐instar (L3) larvae. Images acquired during L3 larvae (120 h after egg laying), pupae, and adult (1 day post‐eclosion) stages. Scale bar: 3 mm.
- B
Representative images showing rapamycin effects on Drosophila body size after treatment on 10‐day‐old flies. Images acquired during adult stage (3 days post‐treatment). Scale bar: 3 mm.
- C
Western blot analysis and quantification of S6 ribosomal protein and phospho‐T398‐S6 ribosomal protein on whole‐fly protein extracts of L3 larvae (left side) and 10‐day‐old flies treated for 3 days (right side). Two‐tailed Student's t‐test; *P < 0.05.
- D, E
Gene expression analysis via qRT–PCR of dST1(A) and dST3(B) in three biological replicates of w iso31 L3 wandering larvae (n = 30 per biological replicate) and 10‐day‐old flies (n = 10 per biological replicate) treated with 200 μM rapamycin, 12 h after treatment. Data are indicated as mean + SEM. Two‐tailed Student's t‐test; *P < 0.05, ***P < 0.0005, n.s., not significant.
References
-
- Barker DJP, Osmond C (1986) Infant mortality, childhood nutrition, and ischaemic heart disease in England and Wales. Lancet 327: 1077–1081 - PubMed
Publication types
MeSH terms
Substances
LinkOut - more resources
Full Text Sources
Molecular Biology Databases
Miscellaneous
