. 2022 Aug 1;133(2):426-442.
doi: 10.1152/japplphysiol.00190.2022. Epub 2022 Jul 7.

Testosterone undecanoate administration prevents declines in fat-free mass but not physical performance during simulated multi-stressor military operations

Affiliations

Testosterone undecanoate administration prevents declines in fat-free mass but not physical performance during simulated multi-stressor military operations

Alyssa N Varanoske et al. J Appl Physiol (1985). .

Abstract

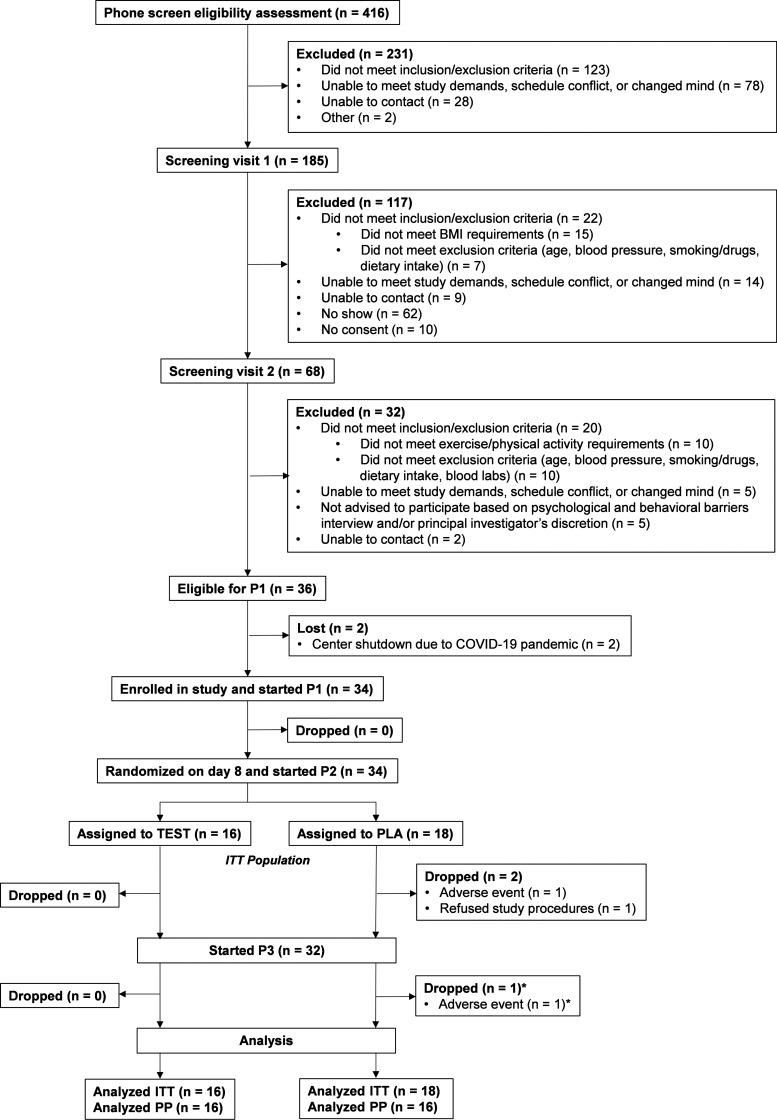
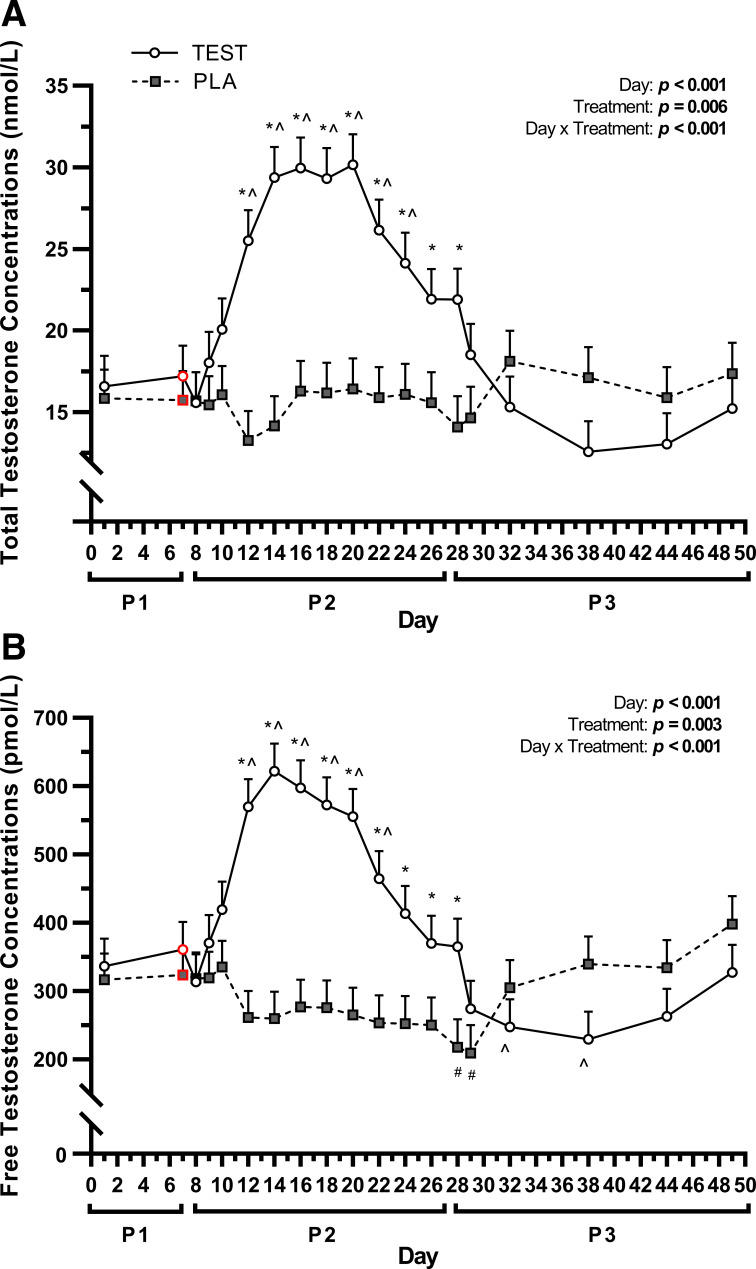
Male military personnel conducting strenuous operations experience reduced testosterone concentrations, muscle mass, and physical performance. Pharmacological restoration of normal testosterone concentrations may attenuate performance decrements by mitigating muscle mass loss. Previously, administering testosterone enanthate (200 mg/wk) during 28 days of energy deficit prompted supraphysiological testosterone concentrations and lean mass gain without preventing isokinetic/isometric deterioration. Whether administering a practical dose of testosterone protects muscle and performance during strenuous operations is undetermined. The objective of this study was to test the effects of a single dose of testosterone undecanoate on body composition and military-relevant physical performance during a simulated operation. After a 7-day baseline phase (P1), 32 males (means ± SD; 77.1 ± 12.3 kg, 26.5 ± 4.4 yr) received a single dose of either testosterone undecanoate (750 mg; TEST) or placebo (PLA) before a 20-day simulated military operation (P2), followed by a 23-day recovery (P3). Assessments included body composition and physical performance at the end of each phase and circulating endocrine biomarkers throughout the study. Total and free testosterone concentrations in TEST were greater than PLA throughout most of P2 (P < 0.05), but returned to P1 values during P3. Fat-free mass (FFM) was maintained from P1 to P2 in TEST (means ± SE; 0.41 ± 0.65 kg, P = 0.53), but decreased in PLA (-1.85 ± 0.69 kg, P = 0.01) and recovered in P3. Regardless of treatment, total body mass and fat mass decreased from P1 to P2 (P < 0.05), but did not fully recover by P3. Physical performance decreased during P2 (P < 0.05) and recovered by P3, regardless of treatment. In conclusion, administering testosterone undecanoate before a simulated military operation protected FFM but did not prevent decrements in physical performance.NEW & NOTEWORTHY This study demonstrated that a single intramuscular dose of testosterone undecanoate (750 mg) administered to physically active males before a 20-day simulated, multi-stressor military operation increased circulating total and free testosterone concentrations within normal physiological ranges and spared FFM. However, testosterone administration did not attenuate decrements in physical performance across multiple measures of power, strength, anaerobic or aerobic capacity.

Keywords: energy deficit; hypogonadism; lean body mass; skeletal muscle; strength.


Conflict of interest statement

No conflicts of interest, financial or otherwise, are declared by the authors.

Figures

None
Graphical abstract
Figure 1.
Figure 1.
Study design, adapted with permission from Elsevier from Varanoske et al. (30). P1 (days 17) and P3 (days 2850) were run-in and free-living with a standardized diet with energy derived from 15% protein, 55% carbohydrates, and 30% fat. P2 (days 827) was a highly controlled, multi-stressor military operation, consisting of four consecutive cycles of undulating stress, starting with 2 days of low stress (∼1,000 kcal/day exercise-induced energy deficit; 8 h/day sleep; denoted by bolded number), followed by 3 days of high stress (∼3,000 kcal/day exercise-induced energy deficit, 4 h/day sleep; denoted by red bolded and underlined number). Participants were randomized to receive either a single intramuscular injection of testosterone undecanoate (TEST; 750 mg) or an iso-volumetric placebo (PLA; sesame oil solution) on day 8. Participants consumed the same total calories and macronutrient distribution in P2, but food was derived from the Meal, Ready-to-Eat, a US combat ration ([MRE] menu 39; Ameriqual, Evansville, IN). Body mass was measured daily. Body composition and physical performance were measured once at the end of each phase. Blood draws were obtained on several occasions throughout each phase to assess circulating endocrine biomarkers. P1, phase 1; P2, phase 2; P3, phase 3; 3-RM, 3-repetition maximum; V̇o2peak, maximal cardiorespiratory fitness test.
Figure 2.
Figure 2.
Participant flow chart. *Dropped after P3 physical performance testing but before body composition testing was completed. ITT, intent-to-treat; P1, phase 1; P2, phase 2; P3, phase 3; PLA, participants randomized to 750 mg sesame oil solution on day 8; PP, per protocol; TEST, participants randomized to 750 mg testosterone undecanoate on day 8.
Figure 3.
Figure 3.
Body mass for the intent-to-treat population. Data were analyzed using a mixed-effect linear model. Data are presented as least squares means + standard error. For main effect of day, $significantly different from P1 (day 7) (P < 0.05). P1 values denoted in red outline. P1, phase 1; P2, phase 2; P3, phase 3; PLA (n = 18), participants randomized to 750 mg sesame oil solution on day 8; TEST (n = 16), participants randomized to 750 mg testosterone undecanoate on day 8.
Figure 4.
Figure 4.
Body composition [fat-free mass (A) and fat mass (B)] for the intent-to-treat population. Data were analyzed using mixed-effect linear models. Circles and squares represent individual data points, and bar graphs represent least squares means + standard error. For main effect of phase, $$significantly different from P1 and P3, $significantly different from P1 (P < 0.05). For phase × treatment interactions, time points not sharing the same letter are different. Figures display all data points collected for the intent-to-treat population. There was a smaller sample size for these variables due to equipment malfunction and missing data points (TEST n = 15; PLA n = 14); thus, figures are presented including all data points collected, and statistical models were analyzed as such. P1, phase 1; P2, phase 2; P3, phase 3; PLA, participants randomized to 750 mg sesame oil solution on day 8; TEST, participants randomized to 750 mg testosterone undecanoate on day 8.
Figure 5.
Figure 5.
Selected physical performance variables [vertical jump height (A), 3-repetition maximum (RM) mass lifted (B), Wingate absolute peak power (C), absolute peak oxygen consumption during exercise (V̇o2peak) (D), and ruck march total time (E)] for the intent-to-treat population. Data were analyzed using mixed-effect linear models. Circles and squares represent individual data points, and bar graphs are presented as least squares means + standard error. For main effect of phase, $$significantly different from P1 and P3, $significantly different from P3 only (P < 0.05). Figures display all data points collected for the intent-to-treat population. P1, phase 1; P2, phase 2; P3, phase 3; PLA (n = 18), participants randomized to 750 mg sesame oil solution on day 8; TEST (n = 16), participants randomized to 750 mg testosterone undecanoate on day 8.
Figure 6.
Figure 6.
Total (A) and free testosterone (B) concentrations for the intent-to-treat population. Data were analyzed using mixed-effect linear models. Data are presented as least squares means + standard error. For day × treatment interactions, *significant difference (P < 0.05) between TEST and PLA, ^time point for TEST significantly different from P1 (day 7), #time point for PLA significantly different from P1 (day 7). P1 values denoted in red outline. P1, phase 1; P2, phase 2; P3, phase 3; PLA, participants randomized to 750 mg sesame oil solution on day 8; TEST, participants randomized to 750 mg testosterone undecanoate on day 8.

Similar articles

Cited by

References

    1. Vermeulen A, Kaufman JM. Diagnosis of hypogonadism in the aging male. Aging Male 5: 170–176, 2002. [Erratum in Aging Male 5: iv, 2002]. doi:10.1080/tam.5.3.170.176. - DOI - PubMed
    1. Lieberman HR, Farina EK, Caldwell J, Williams KW, Thompson LA, Niro PJ, Grohmann KA, McClung JP. Cognitive function, stress hormones, heart rate and nutritional status during simulated captivity in military survival training. Physiol Behav 165: 86–97, 2016. doi:10.1016/j.physbeh.2016.06.037. - DOI - PubMed
    1. Lieberman HR, Thompson LA, Caruso CM, Niro PJ, Mahoney CR, McClung JP, Caron GR. The catecholamine neurotransmitter precursor tyrosine increases anger during exposure to severe psychological stress. Psychopharmacology (Berl) 232: 943–951, 2015. doi:10.1007/s00213-014-3727-7. - DOI - PMC - PubMed
    1. Lieberman HR, Tharion WJ, Shukitt-Hale B, Speckman KL, Tulley R. Effects of caffeine, sleep loss, and stress on cognitive performance and mood during U.S. Navy SEAL training. Sea-Air-Land. Psychopharmacology (Berl) 164: 250–261, 2002. doi:10.1007/s00213-002-1217-9. - DOI - PubMed
    1. Margolis LM, Crombie AP, McClung HL, McGraw SM, Rood JC, Montain SJ, Young AJ. Energy requirements of US Army Special Operation Forces during military training. Nutrients 6: 1945–1955, 2014. doi:10.3390/nu6051945. - DOI - PMC - PubMed

Publication types