

Specific ATPases drive compartmentalized glycogen utilization in rat skeletal muscle
- PMID: 35796670
- PMCID: PMC9270182
- DOI: 10.1085/jgp.202113071
Specific ATPases drive compartmentalized glycogen utilization in rat skeletal muscle
Abstract
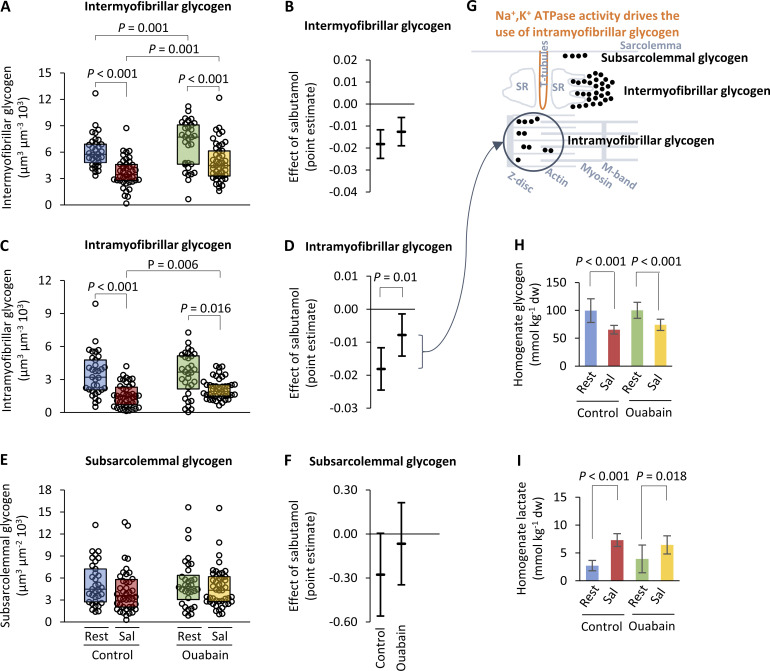
Glycogen is a key energy substrate in excitable tissue, including in skeletal muscle fibers where it also contributes to local energy production. Transmission electron microscopy imaging has revealed the existence of a heterogenic subcellular distribution of three distinct glycogen pools in skeletal muscle, which are thought to reflect the requirements for local energy stores at the subcellular level. Here, we show that the three main energy-consuming ATPases in skeletal muscles (Ca2+, Na+,K+, and myosin ATPases) utilize different local pools of glycogen. These results clearly demonstrate compartmentalized glycogen metabolism and emphasize that spatially distinct pools of glycogen particles act as energy substrate for separated energy requiring processes, suggesting a new model for understanding glycogen metabolism in working muscles, muscle fatigue, and metabolic disorders. These observations suggest that the distinct glycogen pools can regulate the functional state of mammalian muscle cells and have important implications for the understanding of how the balance between ATP utilization and ATP production is regulated at the cellular level in general and in skeletal muscle fibers in particular.
© 2022 Nielsen et al.
Figures


Similar articles
-
Ca2+ uptake coupled to glycogen phosphorolysis in the glycogenolytic-sarcoplasmic reticulum complex from rat skeletal muscle.Z Naturforsch C J Biosci. 1996 Jul-Aug;51(7-8):591-8. Z Naturforsch C J Biosci. 1996. PMID: 8810099
-
Metabolic and phenotypic characteristics of human skeletal muscle fibers as predictors of glycogen utilization during electrical stimulation.Eur J Appl Physiol. 2005 Oct;95(4):276-82. doi: 10.1007/s00421-005-0003-x. Epub 2005 Oct 27. Eur J Appl Physiol. 2005. PMID: 16096841
-
Muscle glycogen stores and fatigue.J Physiol. 2013 Sep 15;591(18):4405-13. doi: 10.1113/jphysiol.2013.251629. Epub 2013 May 7. J Physiol. 2013. PMID: 23652590 Free PMC article. Review.
-
Mechanisms of muscle fatigue in intense exercise.J Sports Sci. 1997 Jun;15(3):247-56. doi: 10.1080/026404197367254. J Sports Sci. 1997. PMID: 9232550 Review.
-
The "glycogen shunt" in exercising muscle: A role for glycogen in muscle energetics and fatigue.Proc Natl Acad Sci U S A. 2001 Jan 16;98(2):457-61. doi: 10.1073/pnas.98.2.457. Proc Natl Acad Sci U S A. 2001. PMID: 11209049 Free PMC article.
Cited by
-
Artificial intelligence approaches to the volumetric quantification of glycogen granules in EM images of human tissue.J Gen Physiol. 2024 Sep 2;156(9):e202413595. doi: 10.1085/jgp.202413595. Epub 2024 Jul 9. J Gen Physiol. 2024. PMID: 38980209 Free PMC article.
-
Exercise metabolism and adaptation in skeletal muscle.Nat Rev Mol Cell Biol. 2023 Sep;24(9):607-632. doi: 10.1038/s41580-023-00606-x. Epub 2023 May 24. Nat Rev Mol Cell Biol. 2023. PMID: 37225892 Free PMC article. Review.
-
Durability of the moderate-to-heavy-intensity transition is related to the effects of prolonged exercise on severe-intensity performance.Eur J Appl Physiol. 2024 Aug;124(8):2427-2438. doi: 10.1007/s00421-024-05459-6. Epub 2024 Mar 28. Eur J Appl Physiol. 2024. PMID: 38546844 Free PMC article.
-
Beyond homogenates: New tool available for estimating glycogen's numerical subcellular distribution.J Gen Physiol. 2024 Sep 2;156(9):e202413607. doi: 10.1085/jgp.202413607. Epub 2024 Jul 9. J Gen Physiol. 2024. PMID: 38980208 Free PMC article.
-
A century of exercise physiology: effects of muscle contraction and exercise on skeletal muscle Na+,K+-ATPase, Na+ and K+ ions, and on plasma K+ concentration-historical developments.Eur J Appl Physiol. 2024 Mar;124(3):681-751. doi: 10.1007/s00421-023-05335-9. Epub 2024 Jan 11. Eur J Appl Physiol. 2024. PMID: 38206444 Free PMC article. Review.
References
Publication types
MeSH terms
Substances
Grants and funding
LinkOut - more resources
Full Text Sources
Other Literature Sources
Miscellaneous
