. 2023 Apr;48(4):1191-1210.
doi: 10.1007/s11064-022-03663-4. Epub 2022 Jul 7.

Chronic Stress Impairs the Structure and Function of Astrocyte Networks in an Animal Model of Depression

Affiliations

Chronic Stress Impairs the Structure and Function of Astrocyte Networks in an Animal Model of Depression

Sydney Aten et al. Neurochem Res. 2023 Apr.

Abstract

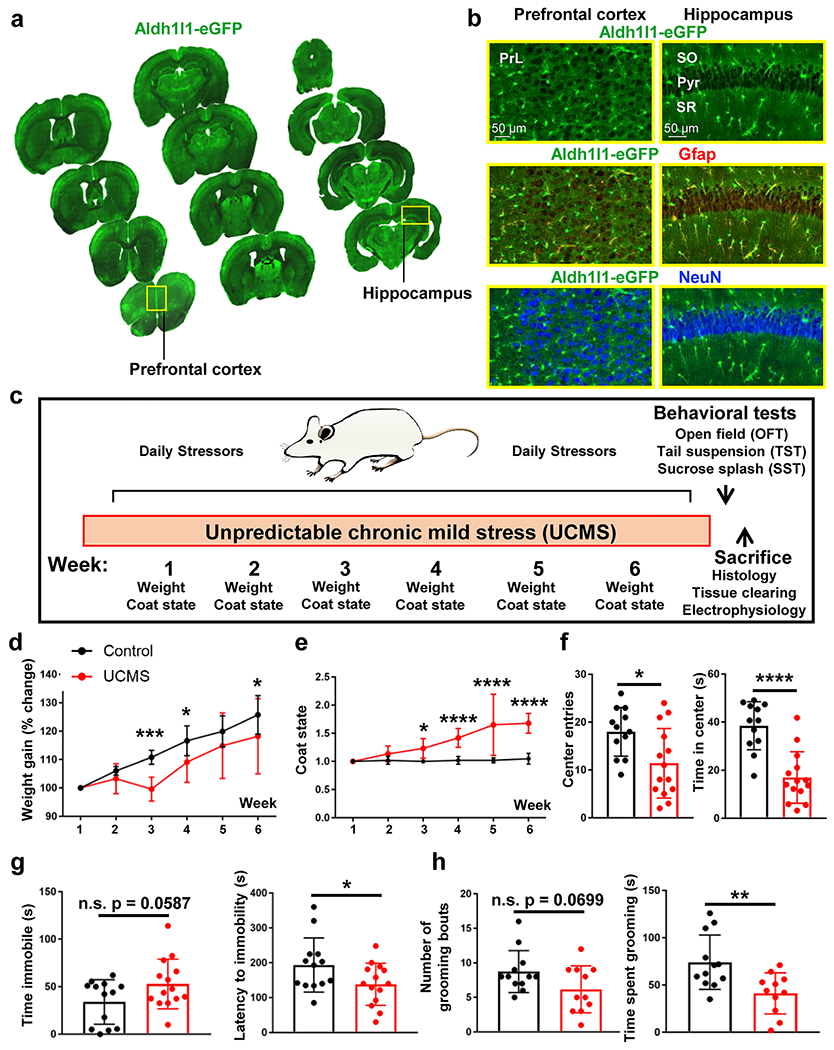
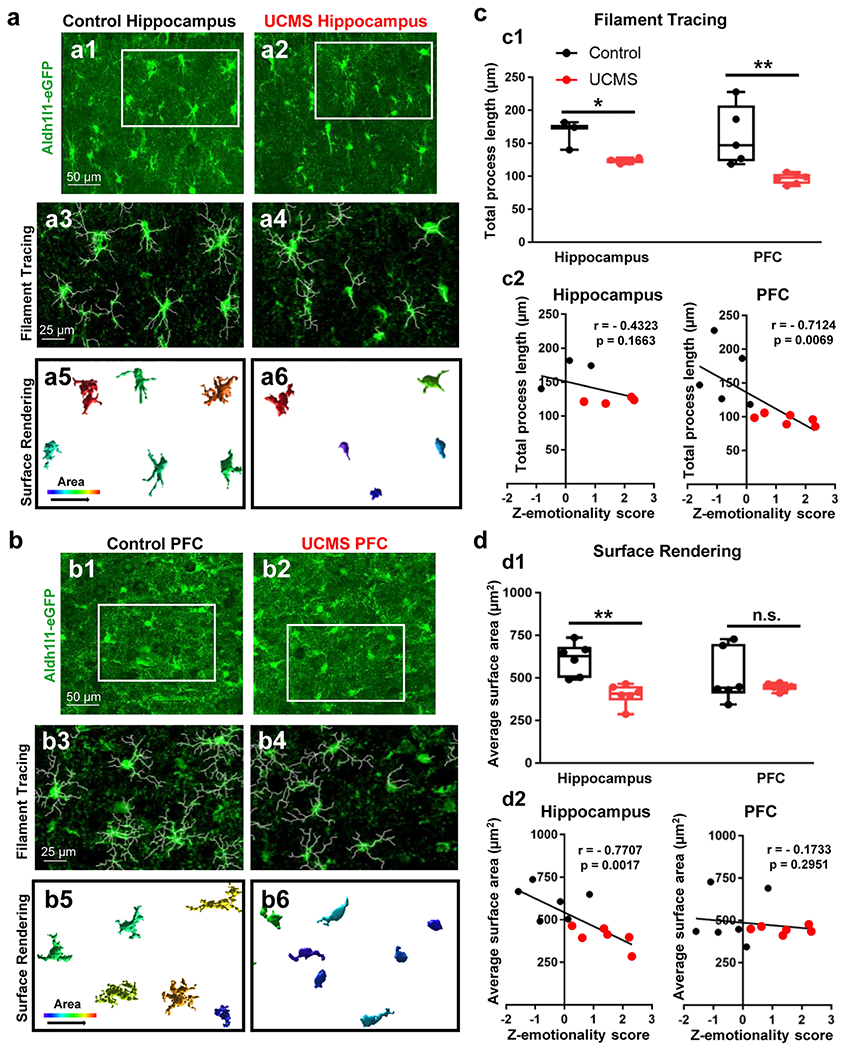
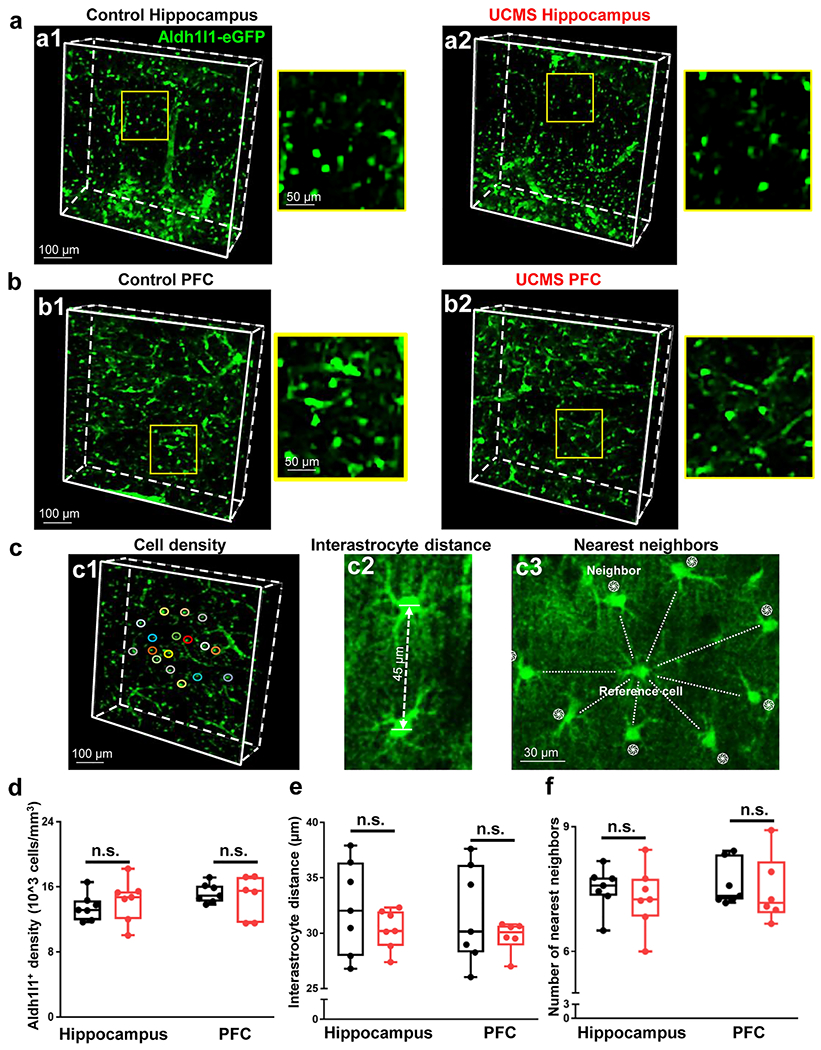
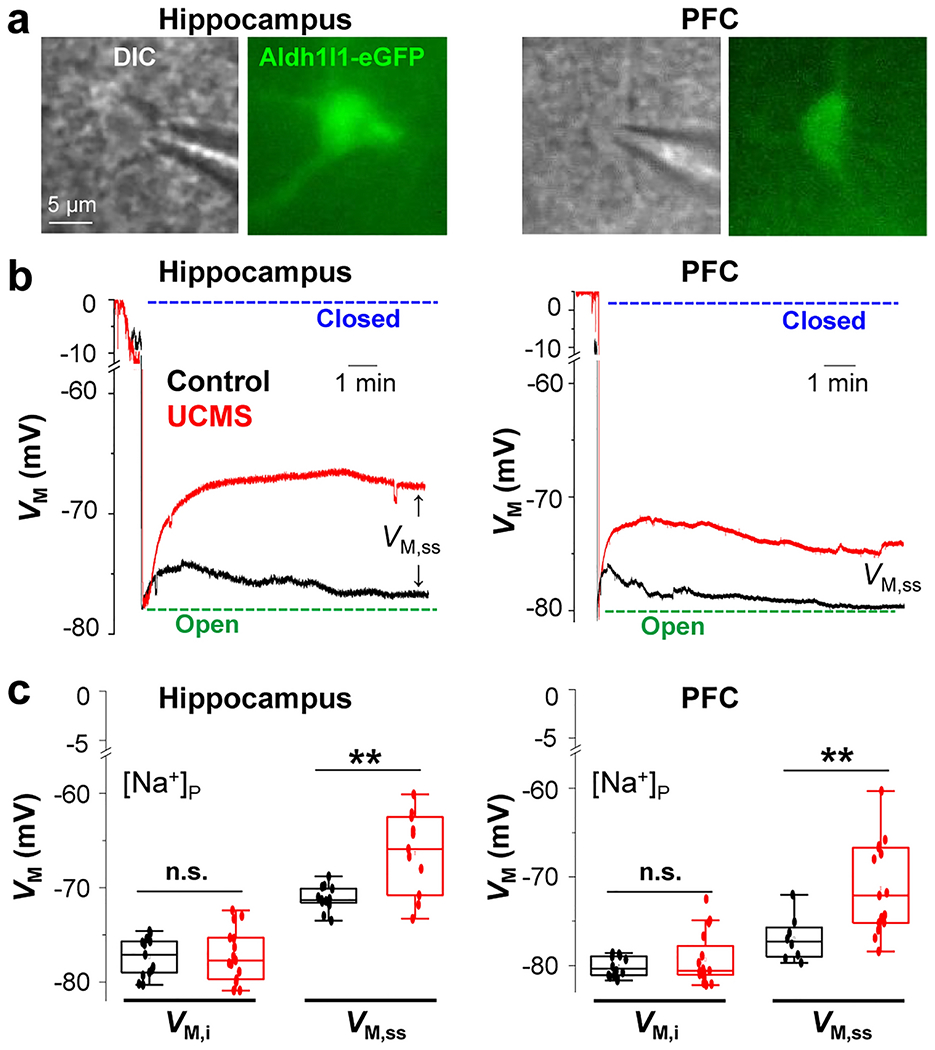
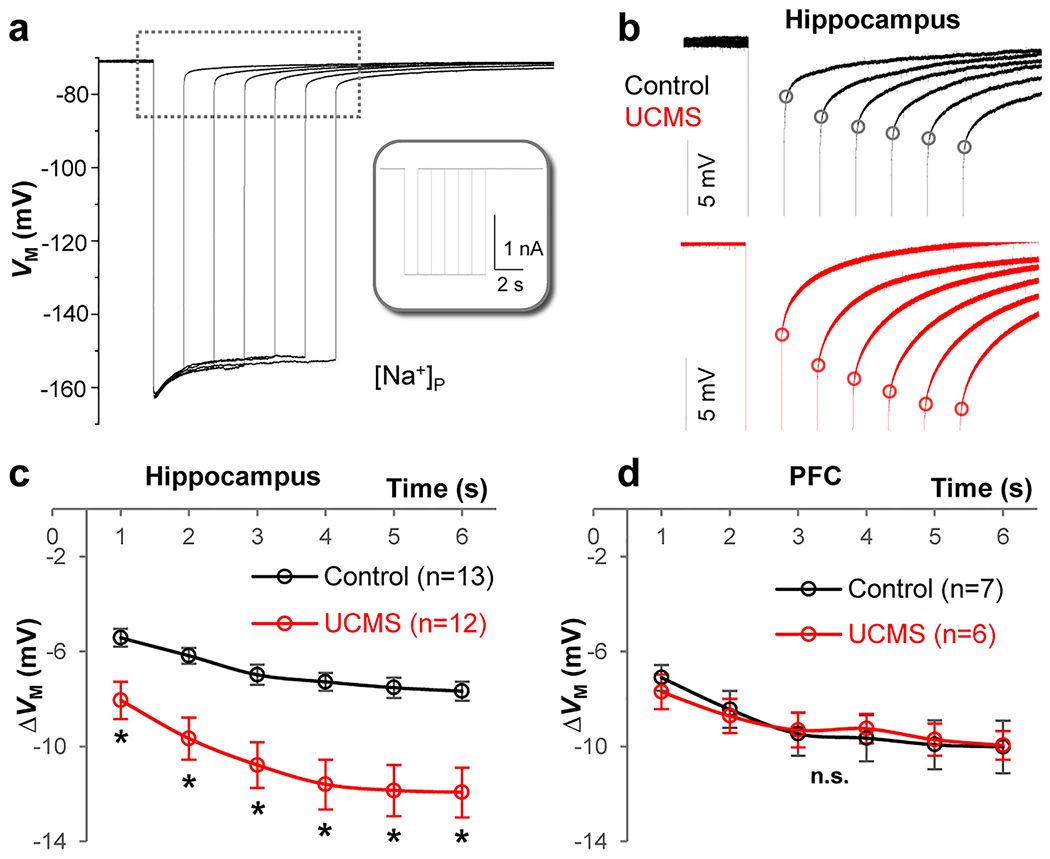
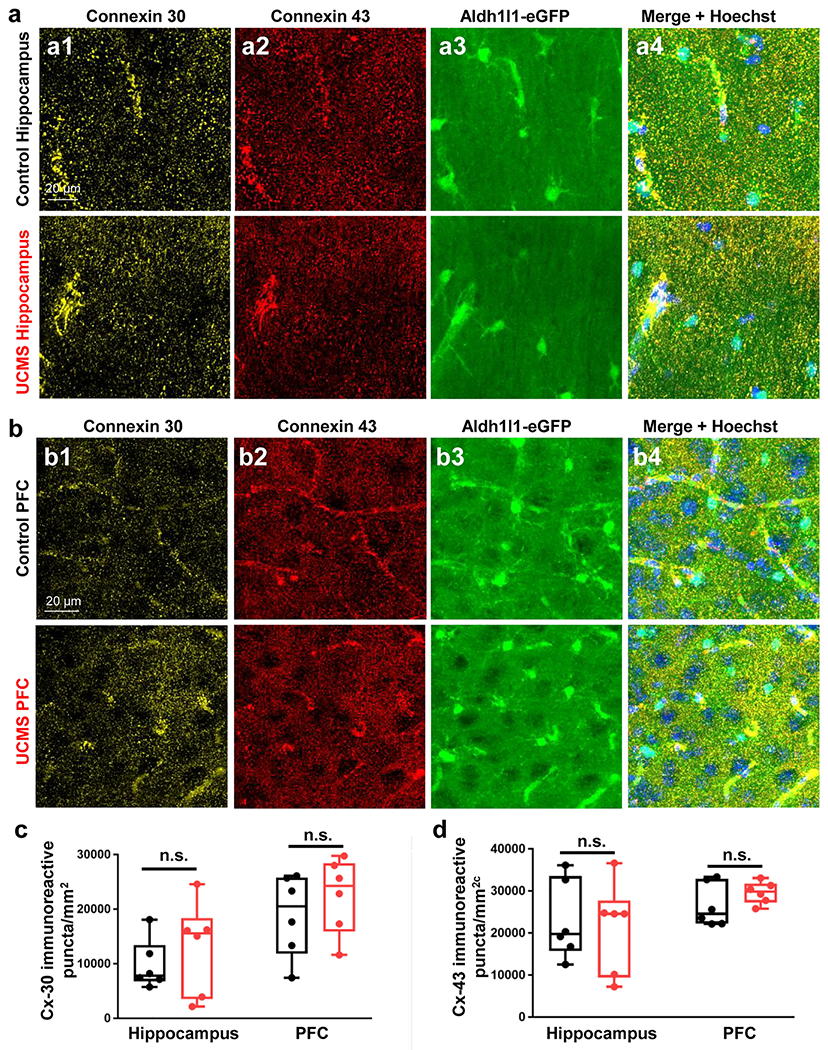
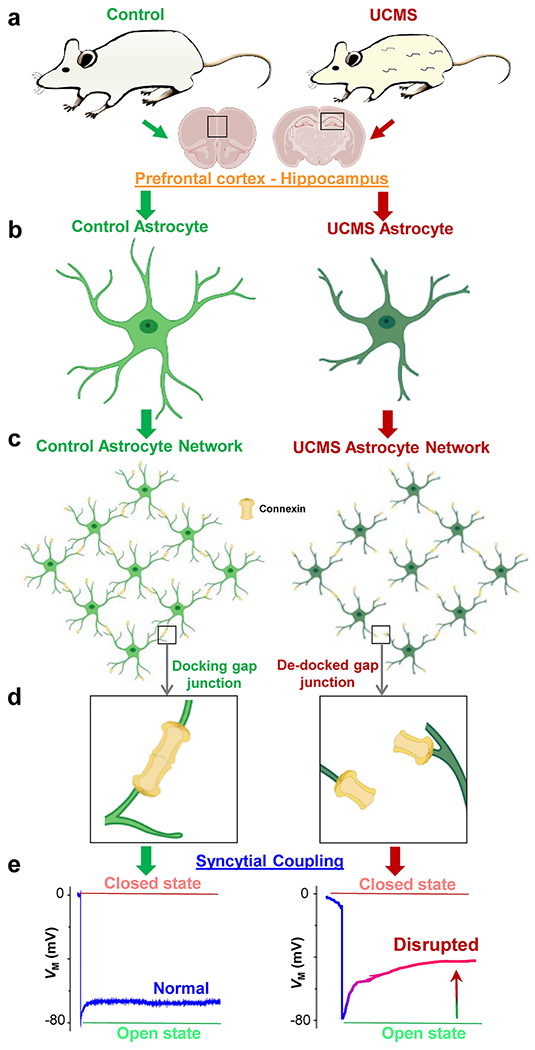
Now astrocytes appear to be the key contributors to the pathophysiology of major depression. Evidence in rodents shows that chronic stress is associated with a decreased expression of astrocytic GFAP-immunoreactivity within the cortex in addition to changes in the complexity and length of astrocyte processes. Furthermore, postmortem brains of individuals with depression have revealed a decrease in astrocyte density. Notably, astrocytes are extensively coupled to one another through gap junctions to form a network, or syncytium, and we have previously demonstrated that syncytial isopotentiality is a mechanism by which astrocytes function as an efficient system with respect to brain homeostasis. Interestingly, the question of how astrocyte network function changes following chronic stress is yet to be elucidated. Here, we sought to examine the effects of chronic stress on network-level astrocyte (dys)function. Using a transgenic aldh1l1-eGFP astrocyte reporter mouse, a six-week unpredictable chronic mild stress (UCMS) paradigm as a rodent model of major depression, and immunohistochemical approaches, we show that the morphology of individual astrocytes is altered by chronic stress exposure. Additionally, in astrocyte syncytial isopotentiality measurement, we found that UCMS impairs the syncytial coupling strength of astrocytes within the hippocampus and prefrontal cortex-two brain regions that have been implicated in the regulation of mood. Together, these findings reveal that chronic stress leads to astrocyte atrophy and impaired gap junction coupling, raising the prospect that both individual and network-level astrocyte functionality are important in the etiology of major depression and other neuropsychiatric disorders.

Keywords: Astrocyte syncytial isopotentiality; CUBIC tissue clearing; Hippocampus; Patch clamp; Prefrontal cortex; Unpredictable chronic mild stress (UCMS).


Conflict of interest statement

Competing Interests

The authors declare no competing financial or non-financial interests.

Figures

Figure 1:
Figure 1:. Aldh1l1-eGFP mouse and Unpredictable Chronic Mild Stress paradigm
(a) Coronal mouse brain sections from one Aldh1l1-eGFP. 30 μm thick tissue sections were mounted on slides at ~500 μm intervals to demonstrate transgene expression throughout the rostral-caudal and dorsal-ventral axis of the brain. Abbreviations: PrL = prelimbic cortex. (b) 20X representative images of the Aldh1l1-eGFP transgene in both the prefrontal cortex (left panel) and hippocampus (right panel). Note that Aldh1l1-eGFP positive cells co-localize with the astrocytic marker GFAP, but not with the neuronal marker NeuN. Abbreviations: SO = stratum radiatum; Pyr = pyramidal cell layer; SR = stratum radiatum (c) Schematic outline of the six-week Unpredictable Chronic Mild Stress (UCMS) paradigm. (d) Percent change in weight over the six-week UCMS paradigm in control (black line) and UCMS (red line) mice. Data were analyzed using ANOVA, followed by post-hoc tests. (e) Graphical representation of coat/fur state across the six-week UCMS paradigm. Data were analyzed using ANOVA, followed by post-hoc tests. (f) Graphical representation of number of center entries (left panel) and total time spent in the center or the arena (right panel) in the open field test. Data were analyzed using Student’s t-test. g) Graphical representation of the amount of time spent immobile (left panel) and the latency to the first immobility (right panel) in the tail suspension test. Data were analyzed using Student’s t-test. (h) Graphical representation of the number of total grooming bouts (left panel) and the amount of time spent grooming (right panel) in the sucrose splash test. Data were analyzed using Student’s t-test. *: p < 0.05; **: p < 0.01; ***: p < 0.001; ****: p < 0.0001; n.s.: not significant. N = 11-14 animals per condition.
Figure 2:
Figure 2:. Changes in astrocyte morphology after UCMS
(a1-a2) Representative 40X confocal images of Aldh1l1-GFP transgene in the hippocampus of a control (left panel) and stressed animal (right panel). The regions boxed in white reflect the same areas depicted in ‘a3-a4’. (a3-a4) Imaris filament tracing of astrocyte processes from a control (left panel) and UCMS (right panel) animal. (a5-a6) Imaris 3D-surface rendering of the same astrocytes depicted in ‘a1-a4’. Note the relative increase in area of astrocytes in the control section relative to the UCMS section. (b1-b2) Representative 40X confocal images of Aldh1l1-GFP transgene in the PFC of a control (left panel) and stressed animal (right panel). The regions boxed in white reflect the same areas depicted in ‘b3-b4’. (b3-b4) Imaris filament tracing of astrocyte processes from the PFC of a control (left panel) and UCMS (right panel) animal. (b5-b6) Imaris 3D-surface rendering of the same astrocytes depicted in ‘b1-b4’. (c1) Graphical analysis of Imaris filament tracing in hippocampal and PFC astrocytes from control animals (black) and UCMS animals (red). The average total astrocyte process length for each animal (analyzed from 3-4 images) is represented by each dot. Data were analyzed using Student’s t-test. *: p < 0.05; **: p < 0.01. N = 3-6 animals per stress condition. (c2) Graphical representation of correlations between average astrocyte process length (from hippocampal astrocytes: left panel and PFC astrocytes: right panel) and Z-emotionality behavioral scores. Correlations were analyzed using mice from both control (black dots) and UCMS (red dots) mice. A one-tailed Pearson analysis (using the ‘R correlation coefficient’) was used. N = 3-6 animals per condition. (d1) Graphical analysis of average astrocyte area (using Imaris 3D surface rendering) in hippocampal and PFC astrocytes from control animals (black) and UCMS animals (red). The average total astrocyte process area for each animal (analyzed from 3-4 images) is represented by each dot. Data were analyzed using Student’s t-test. **: p < 0.01; n.s.: not significant. N = 6 animals per stress condition. (d2) Graphical representation of correlations between average astrocyte process area (from hippocampal astrocytes: left panel and PFC astrocytes: right panel) and Z-emotionality behavioral scores. Correlations were analyzed using mice from both control (black dots) and UCMS (red dots) mice. A one-tailed Pearson analysis (using the ‘R correlation coefficient’) was used. N = 6 animals per condition.
Figure 3:
Figure 3:. CUBIC tissue clearing in hippocampus and PFC of Aldh1l1-eGFP animals
(a1-a2) Representative 10X CUBIC tissue clearing in the hippocampus of a control (left panel) and UCMS (right panel) animal. Note that the yellow box in the larger panels approximate the locations of the zoomed-in images on the right. (b1-b2) Representative 10X CUBIC tissue clearing in the PFC of a control (left panel) and UCMS (right panel) animal. (c1) Representation of astrocyte syncytial cell density analysis, interastrocyte distance (c2), and nearest neighbors (c3). (d) Graphical representation of the density of Aldh1l1-eGFP positive cells in the hippocampus (left) and PFC (right) of control and stressed animals. Data was analyzed from 6-7 animals per condition using Student’s t-test. (e) Graphical representation of the interastrocyte distance (i.e., the distance between astrocytes) in the hippocampus (left) and PFC (right) of control and stressed animals. (f) Graphical representation of the number of neighboring astrocytes nearest to the reference cell/astrocyte. Data was analyzed from 6-7 animals per condition using Student’s t-test. n.s.: not significant.
Figure 4:
Figure 4:. UCMS impairs the strength of astrocyte syncytial coupling within the hippocampus and PFC
(a) Astrocytes recorded from hippocampal (left) and PFC (right) brain slices (DIC images and Aldh1l1-eGFP fluorescent images for astrocyte identification). (c and d) Representative electrophysiological traces from astrocytes recorded with K+ free-Na+ containing electrode [Na+]P in the hippocampus (c) and PFC (e) from control (black trace) and UMCS (red trace) animals. The initial VM (VM, i) was determined immediately after the breakthrough of the cell membrane in whole-cell recording. The steady-state VM (VM, ss) was determined 10-15 min after the membrane breakthrough and was used as a readout of gap junctional coupling strength between astrocytes. Astrocytes recorded from UCMS slices of both the hippocampus and PFC displayed a positive shift of VM, ss which corresponds to a weakened syncytial coupling strength. (d and f) Graphical representation of VM, i and VM, ss in hippocampus and PFC astrocytes from control (black) and UCMS-exposed (red) animals. For both hippocampal and PFC regions, 6-16 astrocytes were recorded. Data is presented as the mean ± SEM using Student’s t-test. **: p < 0.01; n.s.: not significant.
Figure 5:
Figure 5:. UCMS impairs the K+ redistribution capacity of an astrocyte syncytium
(a) Representative trace recorded with K+ free-Na+ containing electrode [Na+]P in current-clamp mode. Inset: −2 nA current steps (Iholding) were applied at incremental durations from 1 to 6 s. In between these steps, the cell was maintained at resting condition for VM recovery. The longer the duration of the current steps, the stronger the negative shift in the reversal potential (Vrev, black dots) upon withdrawal of the steps, indicating more accumulation of K+ inside astrocytes. (b) Enlarged recording trace (indicated by dashed line area in a) of astrocytes in the hippocampus from control (black) and UCMS (red) animals. The ΔVM is the difference between the basal VM and Vrev values and is used to compare the capacity of K+ redistribution in different groups. (c) In the hippocampus, the increased ΔVM in the UCMS group indicates weakened capacity of K+ redistribution of the astrocyte syncytium. (d) In the PFC, there was no significant difference of ΔVM between control and UCMS groups. Two-Way Mixed-Design ANOVA. *: p < 0.05. n.s.: not significant. n = 6-13 recorded cells per group.
Figure 6:
Figure 6:. UCMS does not alter the number of connexin 30 (Cx30) or connexin 43 (Cx43)-immunoreactive puncta in the hippocampus or PFC
(a1-a4) Representative 40X immunofluorescent images of connexin 30 (yellow), connexin 43 (red), Aldh1l1-eGFP transgene (green), and Hoechst (blue) in the stratum radiatum of the hippocampus of control (top row) and UCMS exposed (bottom row) animals. (b1-b4) Representative 40X immunofluorescent images of connexin 30 (yellow), connexin 43 (red), Aldh1l1-eGFP transgene (green), and Hoechst (blue) in the PFC of control (top row) and UCMS exposed (bottom row) animals. (c) Graphical representation of the number of connexin 30 immunoreactive puncta per area of hippocampus/PFC in control and UCMS mice. (d) Graphical representation of the number of connexin 43 immunoreactive puncta per area of hippocampus/PFC in control and UCMS mice. Data were analyzed using Student’s t-test. n.s.: not significant. N = 6 animals per condition.
Figure 7:
Figure 7:. Schematic overview and hypothesized model of gap junction coupling after UCMS
(a) Representative cartoon images of a control (left panel) and UCMS (right panel) mouse. Note the discoloration and tufts in the fur of the UCMS animal after the six-week stress paradigm. Information depicted in the schematic (and in the paper) was obtained from astrocytes within two brain regions: the prefrontal cortex (PFC) and the hippocampus. (b-c) Representation of control (light green) and UCMS (dark green) astrocyte morphology (both individual and network-level). Note the shrinkage of astrocytic processes from UCMS mice. Connexins are represented in yellow. (d) Hypothesized mechanism of gap junction coupling: unlike connexins in astrocytic processes from control animals (left panel) which successfully dock, connexins from astrocyte processes of UCMS animals may not be able to properly ‘dock’ (i.e., many connexins ‘de-dock’), leading to weakened coupling. (e) Representation of the electrophysiological readout (based on our recorded results) of syncytial coupling strength in astrocytes from the PFC and hippocampus of control (left panel) and UCMS (right panel) animals. Note the decreased coupling strength in astrocytes from UCMS mice. PFC and hippocampus brain sections, astrocytes, and connexins were created with BioRender software.

References

    1. Hasin DS, Sarvet AL, Meyers JL, Saha TD, Ruan WJ, Stohl M, Grant BF (2018) Epidemiology of Adult DSM-5 Major Depressive Disorder and Its Specifiers in the United States. JAMA Psychiatry 75:336–346 - PMC - PubMed
    1. Friedrich MJ (2017) Depression Is the Leading Cause of Disability Around the World. JAMA 317:1517 - PubMed
    1. Hammen C (2005) Stress and depression. Annu Rev Clin Psychol 1:293–319 - PubMed
    1. Yang L, Zhao Y, Wang Y, Liu L, Zhang X, Li B, Cui R (2015) The Effects of Psychological Stress on Depression. Curr Neuropharmacol 13:494–504 - PMC - PubMed
    1. Duman RS (2009) Neuronal damage and protection in the pathophysiology and treatment of psychiatric illness: stress and depression. Dialogues Clin Neurosci 11:239–255 - PMC - PubMed