

Harmonizing PTSD severity scales across instruments and sites
- PMID: 35797175
- PMCID: PMC9948684
- DOI: 10.1037/neu0000823
Harmonizing PTSD severity scales across instruments and sites
Abstract
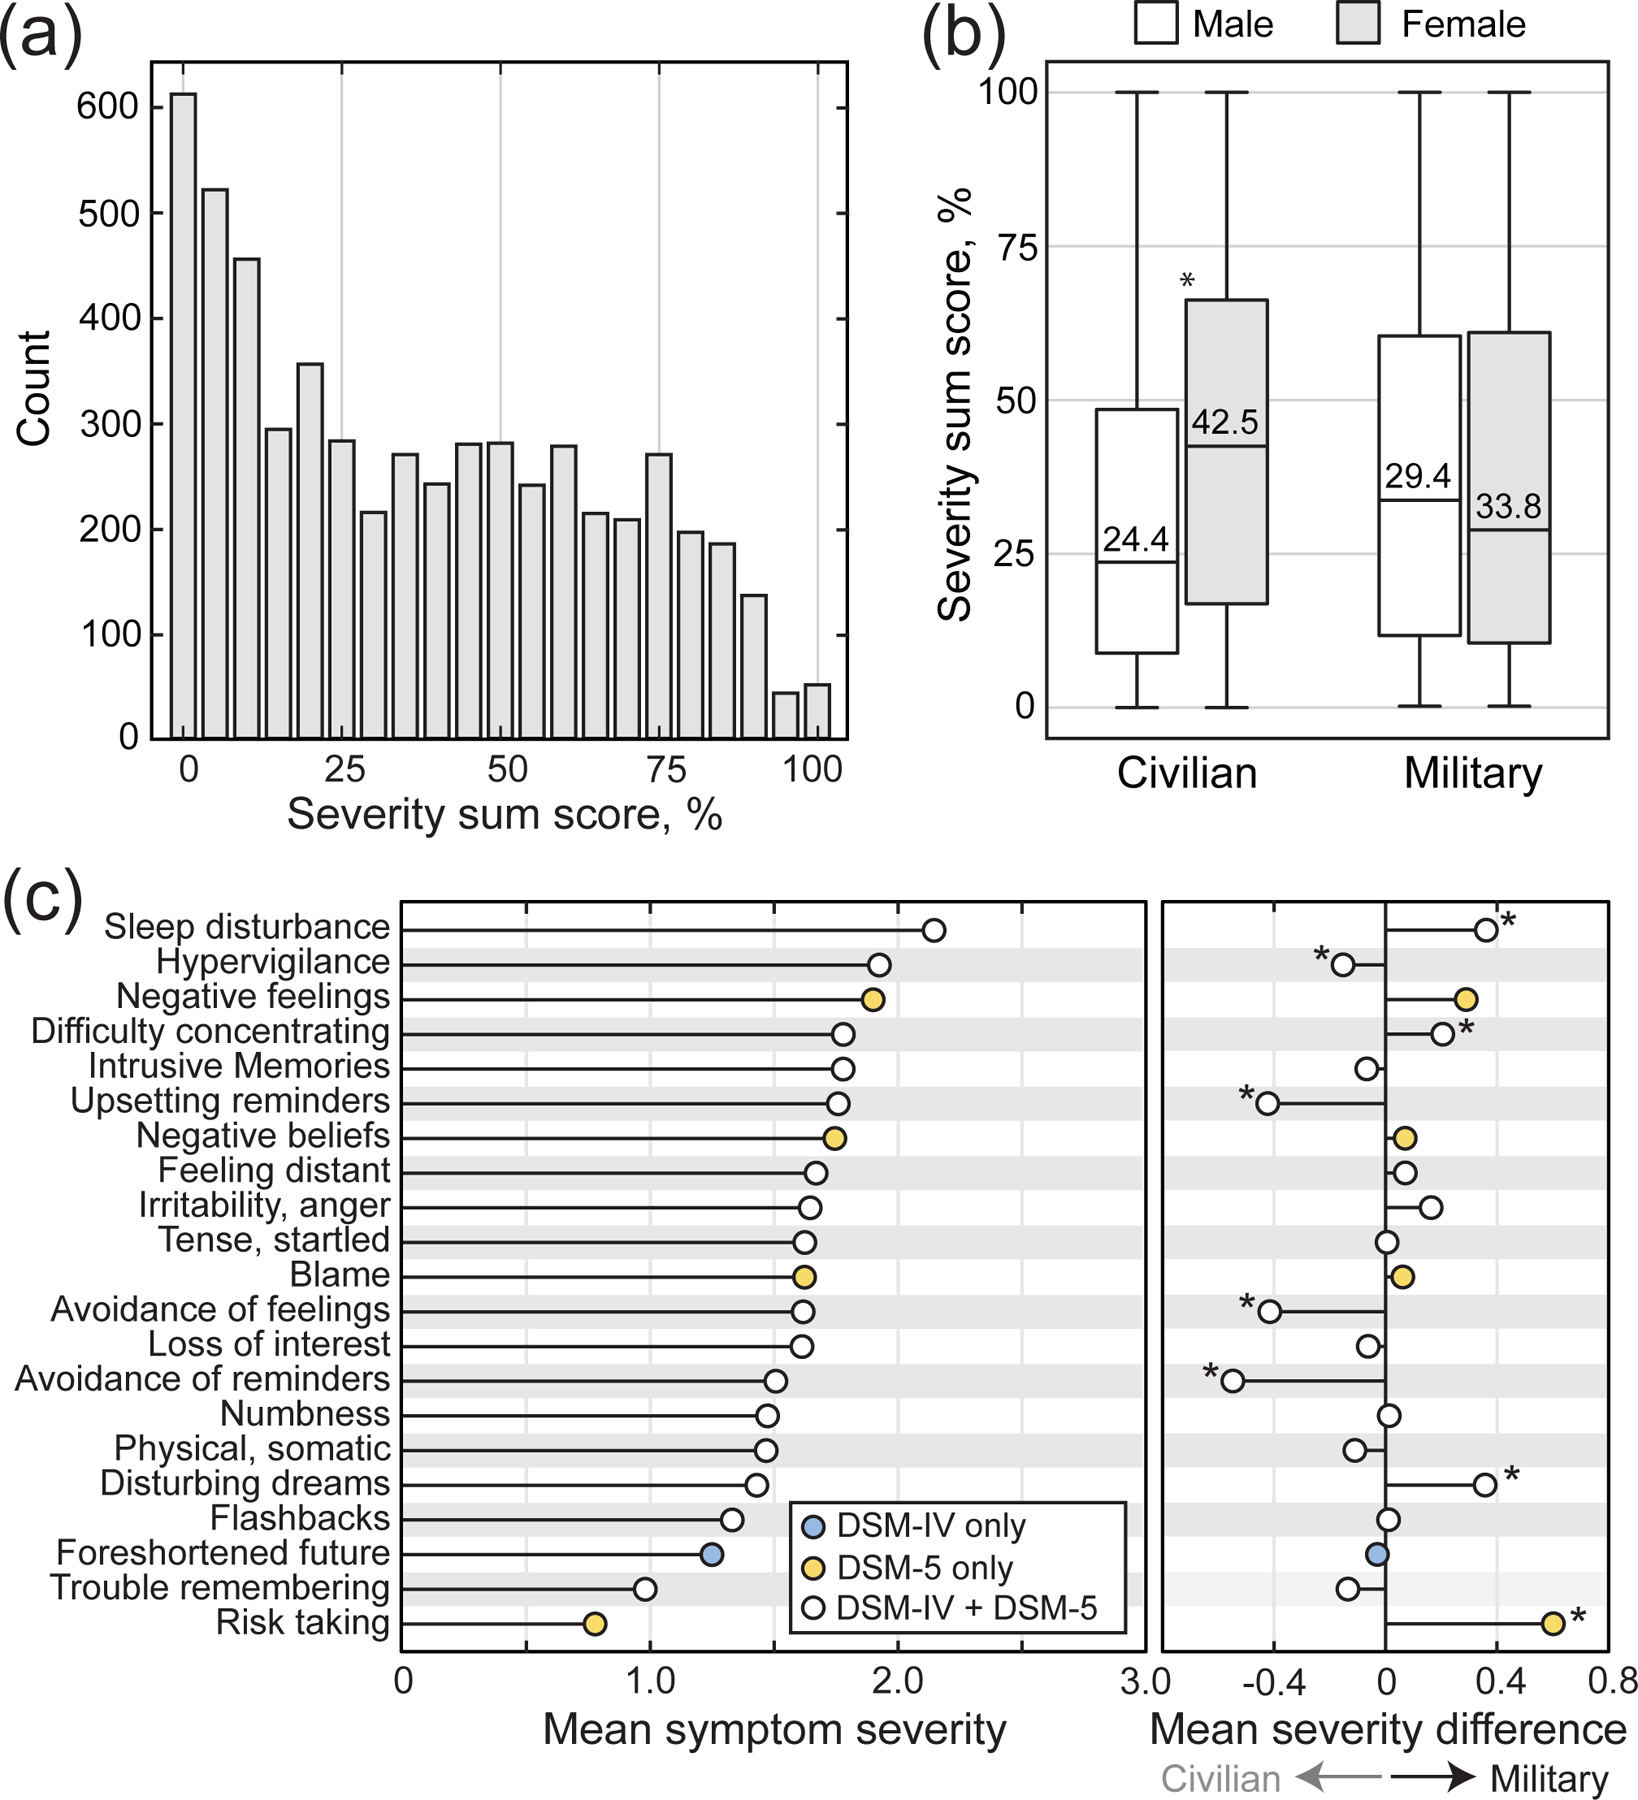
Objective: The variety of instruments used to assess posttraumatic stress disorder (PTSD) allows for flexibility, but also creates challenges for data synthesis. The objective of this work was to use a multisite mega analysis to derive quantitative recommendations for equating scores across measures of PTSD severity.
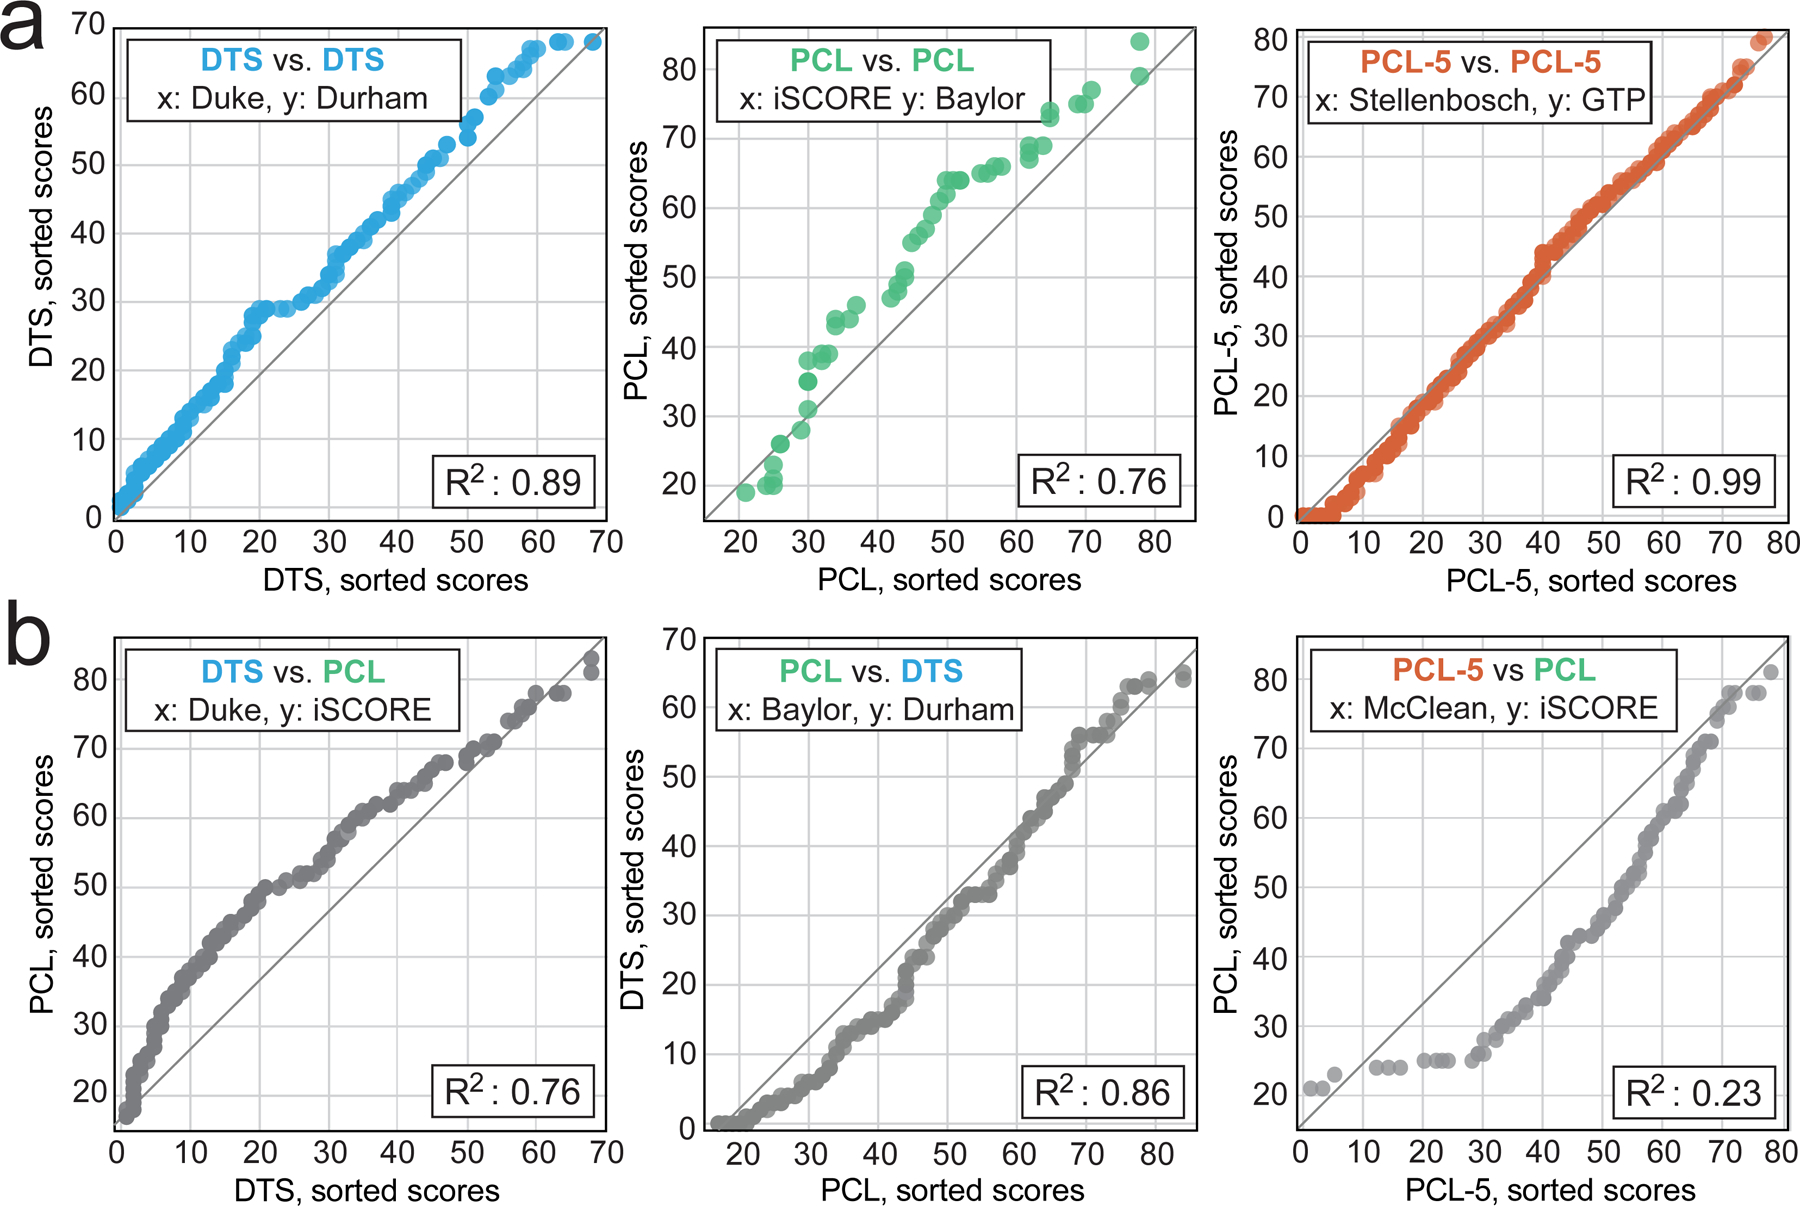
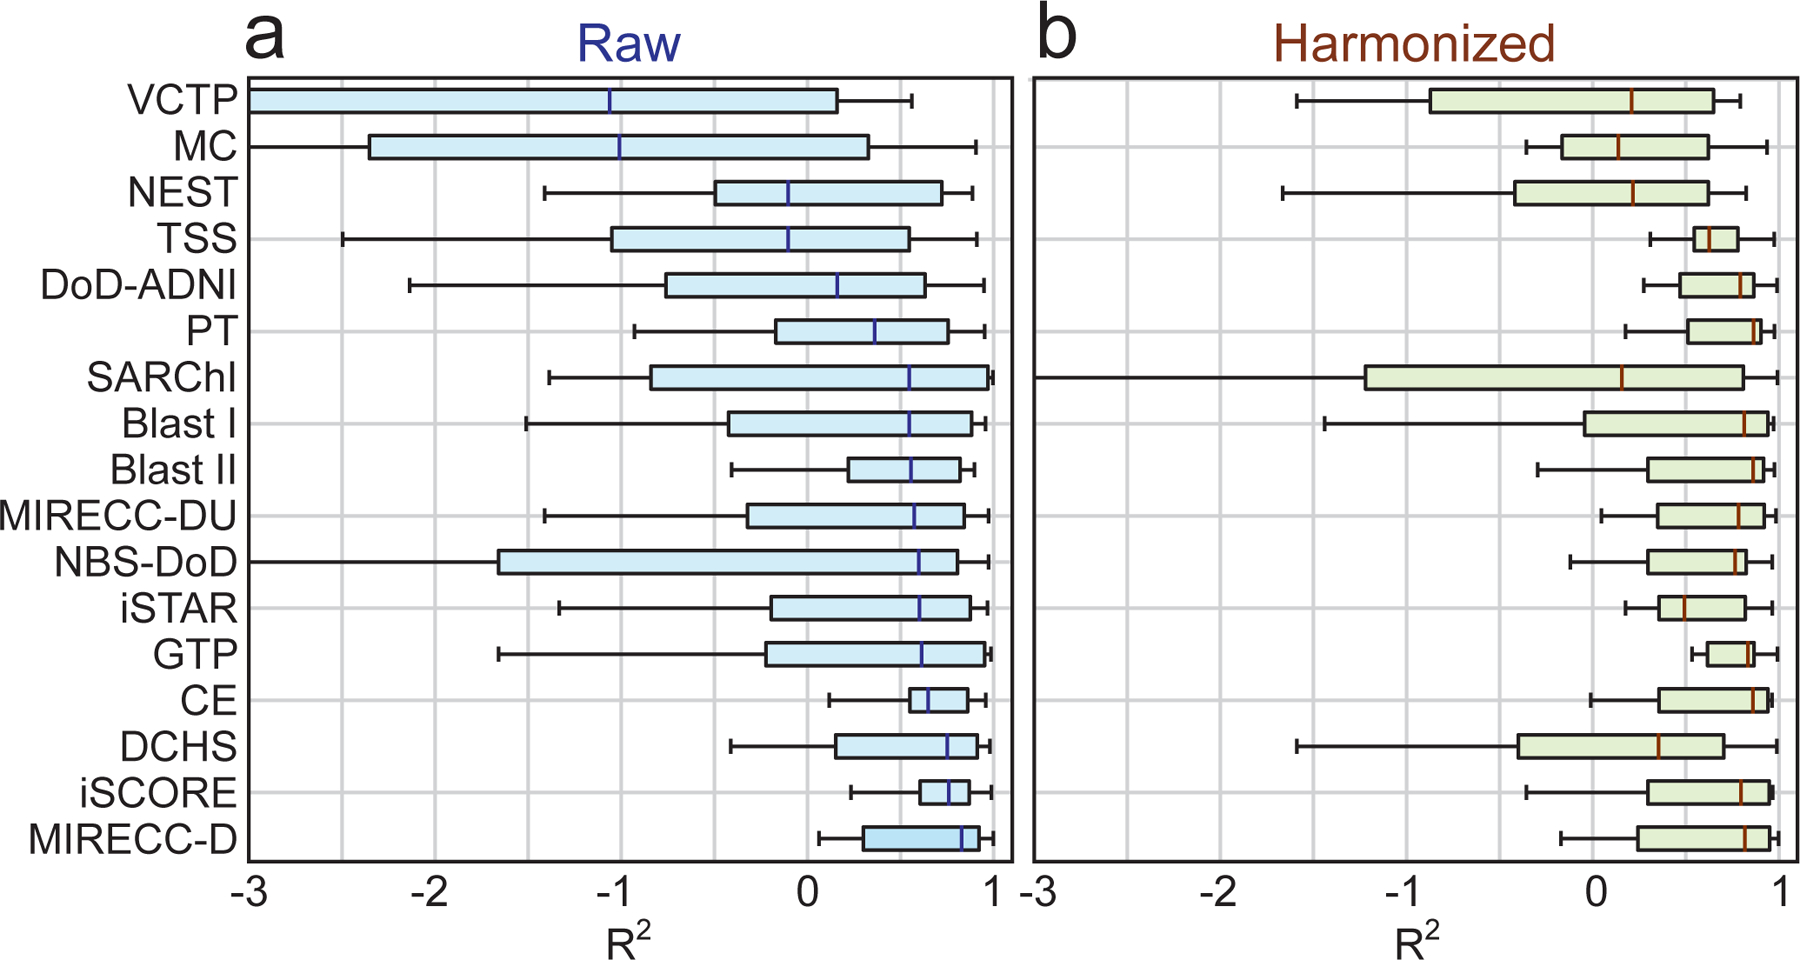
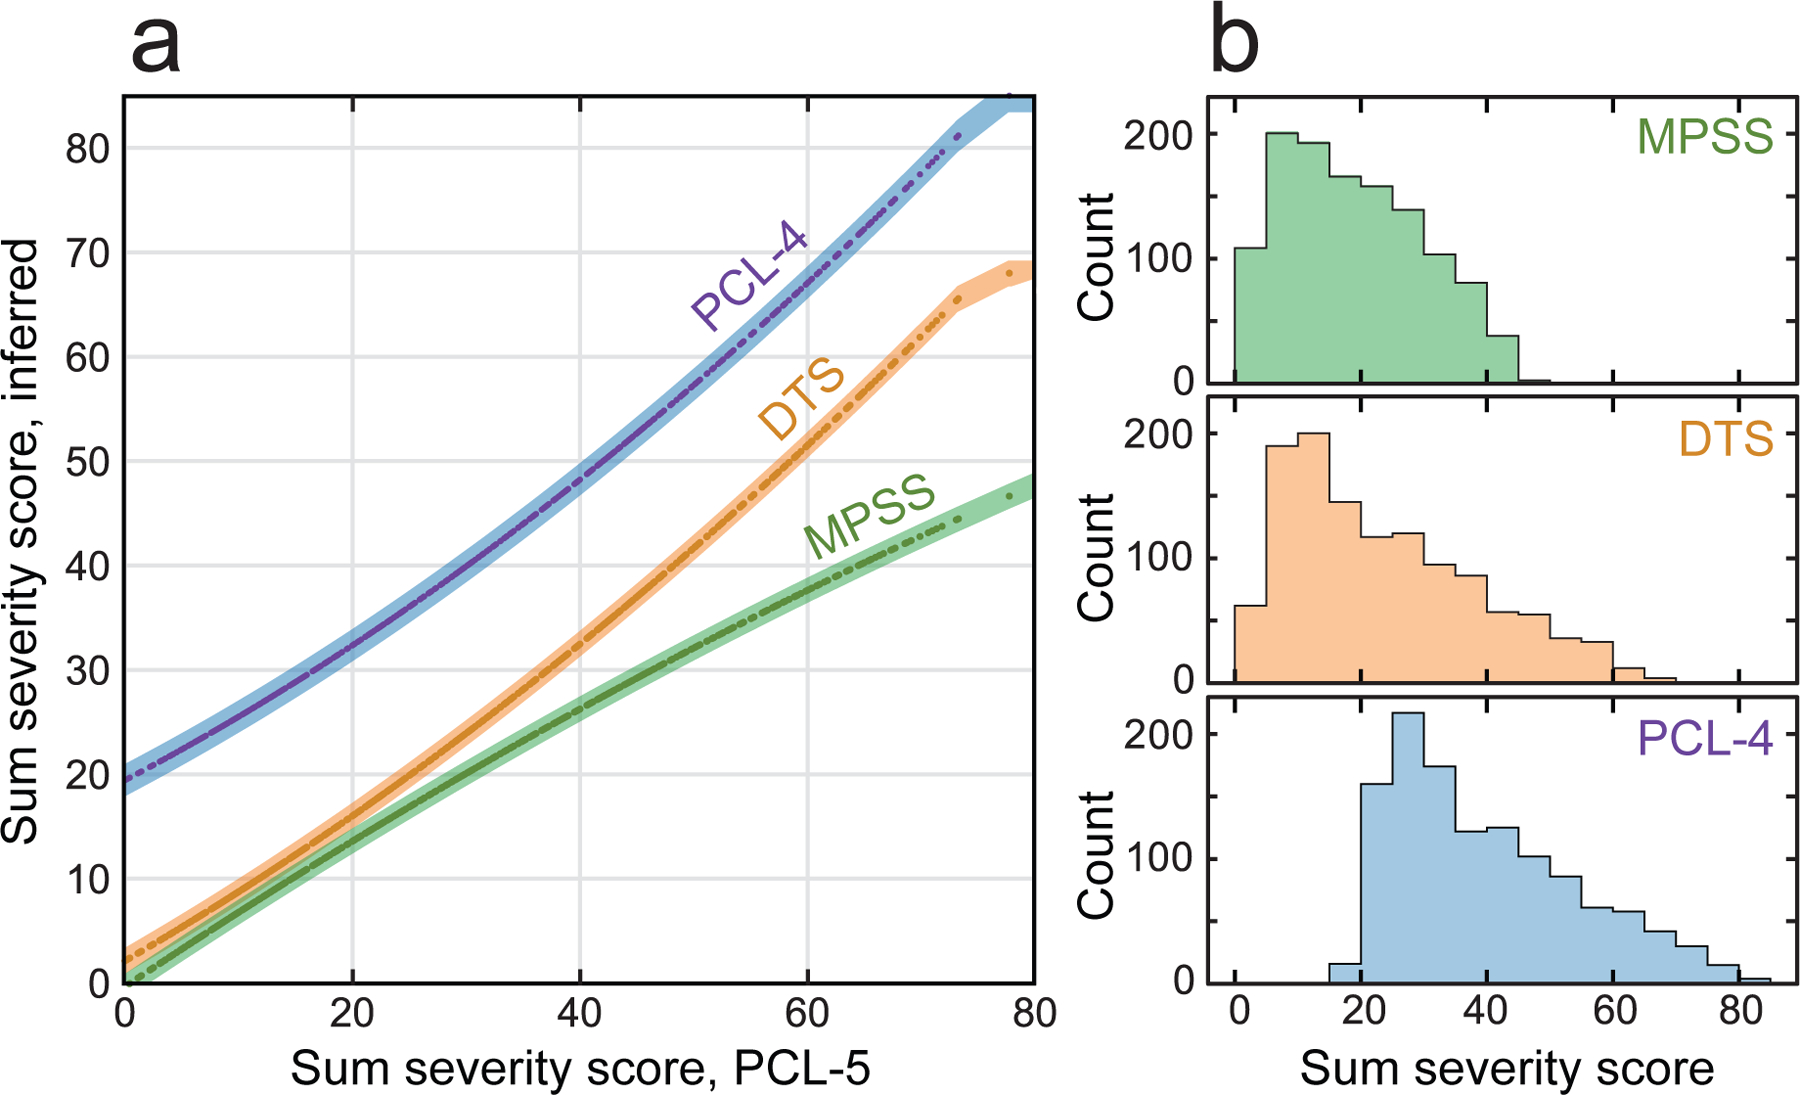
Method: Empirical Bayes harmonization and linear models were used to describe and mitigate site and covariate effects. Quadratic models for converting scores across PTSD assessments were constructed using bootstrapping and tested on hold out data.
Results: We aggregated 17 data sources and compiled an n = 5,634 sample of individuals who were assessed for PTSD symptoms. We confirmed our hypothesis that harmonization and covariate adjustments would significantly improve inference of scores across instruments. Harmonization significantly reduced cross-dataset variance (28%, p < .001), and models for converting scores across instruments were well fit (median R² = 0.985) with an average root mean squared error of 1.46 on sum scores.
Conclusions: These methods allow PTSD symptom severity to be placed on multiple scales and offers interesting empirical perspectives on the role of harmonization in the behavioral sciences. (PsycInfo Database Record (c) 2023 APA, all rights reserved).
Figures
References
-
- American Psychiatric Association. (2013). Diagnostic and statistical manual of mental disorders (5th ed.). doi: 10.1176/appi.books.9780890425596 - DOI
-
- AERA, APA, & NCME (2014). Standards for Educational and Psychological Testing: National Council on Measurement in Education Washington DC: American Educational Research Association.
MeSH terms
Grants and funding
- F32 MH109274/MH/NIMH NIH HHS/United States
- R21 MH098212/MH/NIMH NIH HHS/United States
- R21 MH112956/MH/NIMH NIH HHS/United States
- R01 MH116147/MH/NIMH NIH HHS/United States
- K23 MH125920/MH/NIMH NIH HHS/United States
- U54 EB020403/EB/NIBIB NIH HHS/United States
- R01 MH119227/MH/NIMH NIH HHS/United States
- K23 AT009713/AT/NCCIH NIH HHS/United States
- R01 HD071982/HD/NICHD NIH HHS/United States
- R61 NS120249/NS/NINDS NIH HHS/United States
- R33 NS120249/NS/NINDS NIH HHS/United States
- P41 EB015922/EB/NIBIB NIH HHS/United States
- R56 MH071537/MH/NIMH NIH HHS/United States
- K12 HD085850/HD/NICHD NIH HHS/United States
- R01 MH071537/MH/NIMH NIH HHS/United States
- M01 RR000039/RR/NCRR NIH HHS/United States
- R01 MH111671/MH/NIMH NIH HHS/United States
- UL1 TR000454/TR/NCATS NIH HHS/United States
- R56 AG058854/AG/NIA NIH HHS/United States
- K01 MH118467/MH/NIMH NIH HHS/United States
- I01 CX001820/CX/CSRD VA/United States
