. 2022 Sep 1;28(17):3836-3849.
doi: 10.1158/1078-0432.CCR-22-1052.

Regulation of TORC1 by MAPK Signaling Determines Sensitivity and Acquired Resistance to Trametinib in Pediatric BRAFV600E Brain Tumor Models

Affiliations

Regulation of TORC1 by MAPK Signaling Determines Sensitivity and Acquired Resistance to Trametinib in Pediatric BRAFV600E Brain Tumor Models

Fuyang Li et al. Clin Cancer Res. .

Abstract

Purpose: We investigated why three patient-derived xenograft (PDX) childhood BRAFV600E-mutant brain tumor models are highly sensitive to trametinib. Mechanisms of acquired resistance selected in situ, and approaches to prevent resistance were also examined, which may translate to both low-grade glioma (LGG) molecular subtypes.

Experimental design: Sensitivity to trametinib [MEK inhibitor (MEKi)] alone or in combination with rapamycin (TORC1 inhibitor), was evaluated in pediatric PDX models. The effect of combined treatment of trametinib with rapamycin on development of trametinib resistance in vivo was examined. PDX tissue and tumor cells from trametinib-resistant xenografts were characterized.

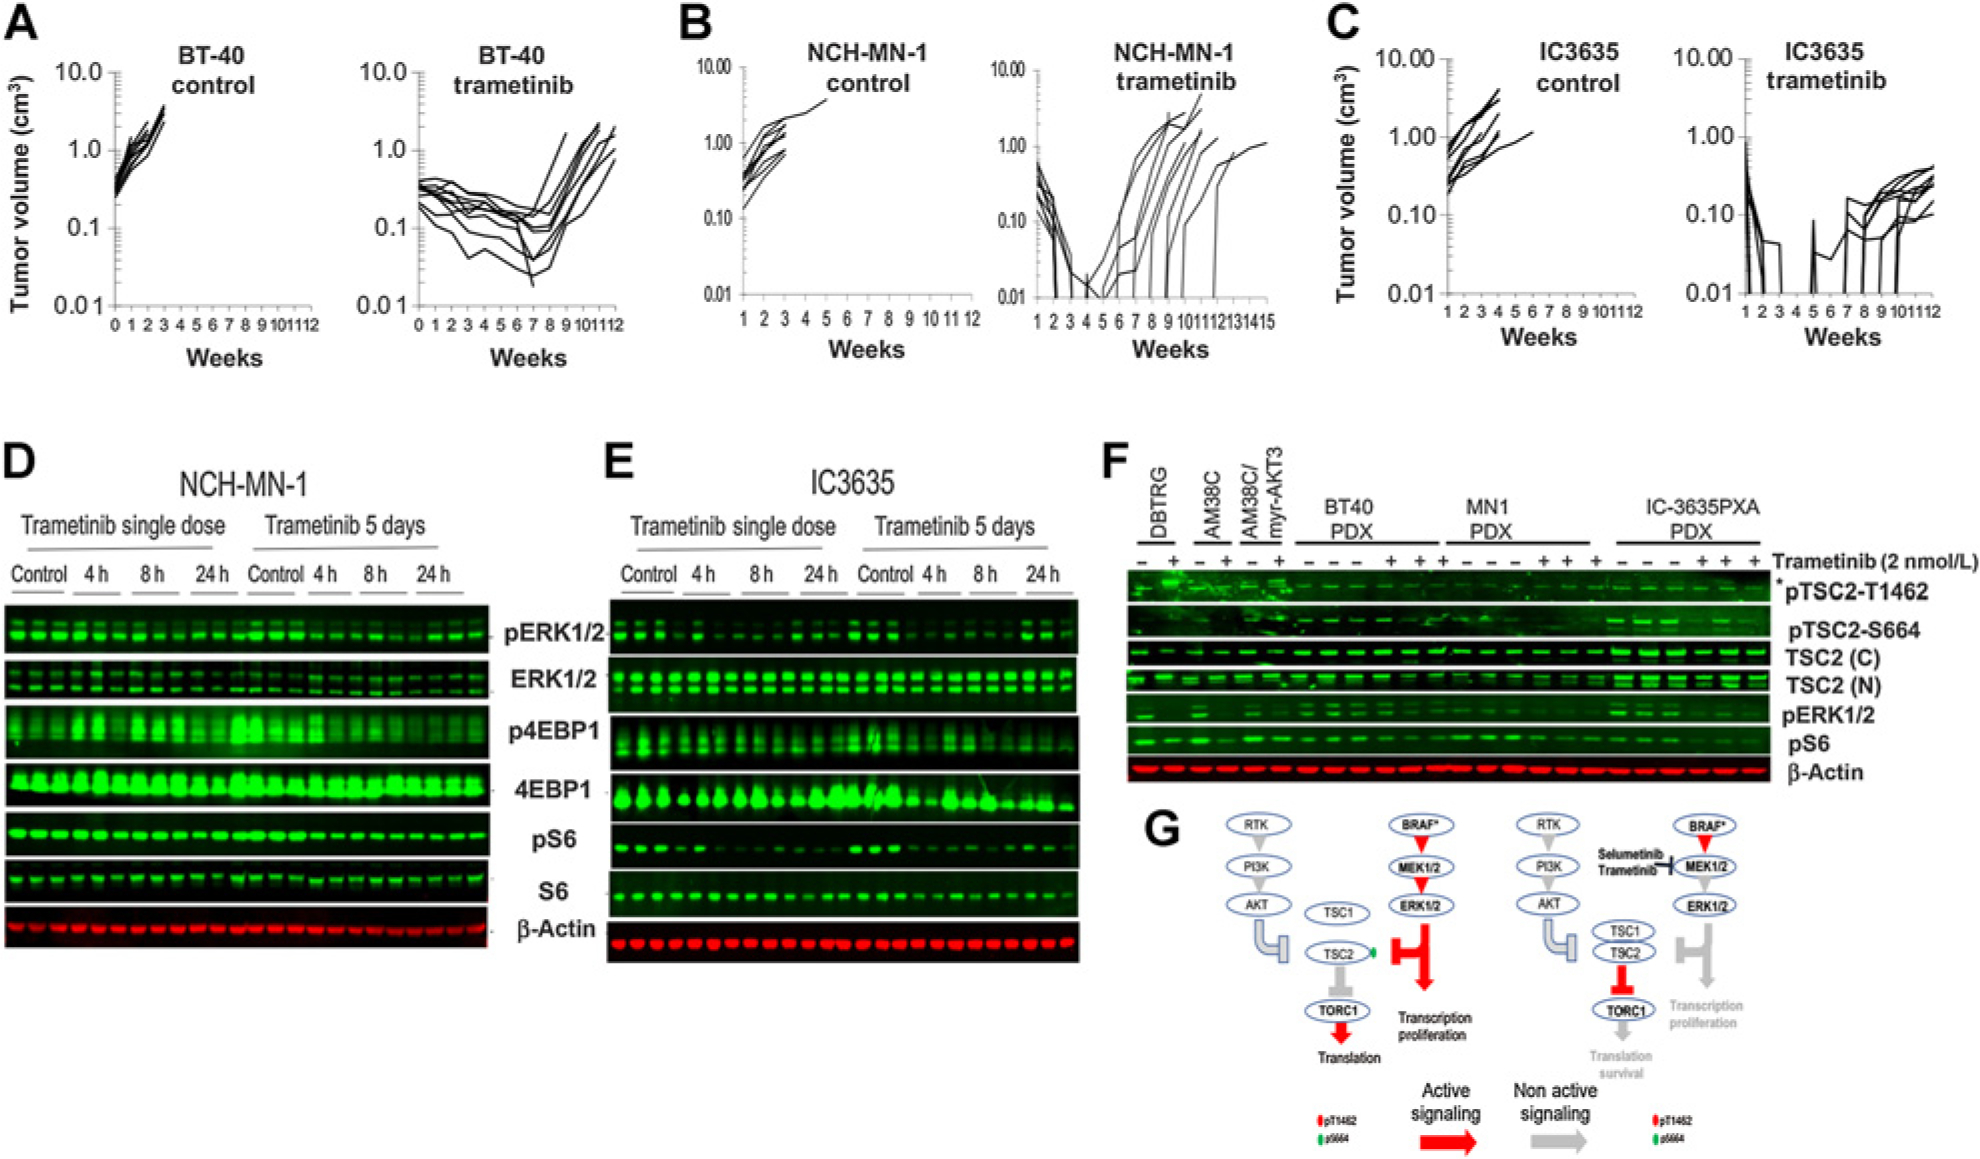
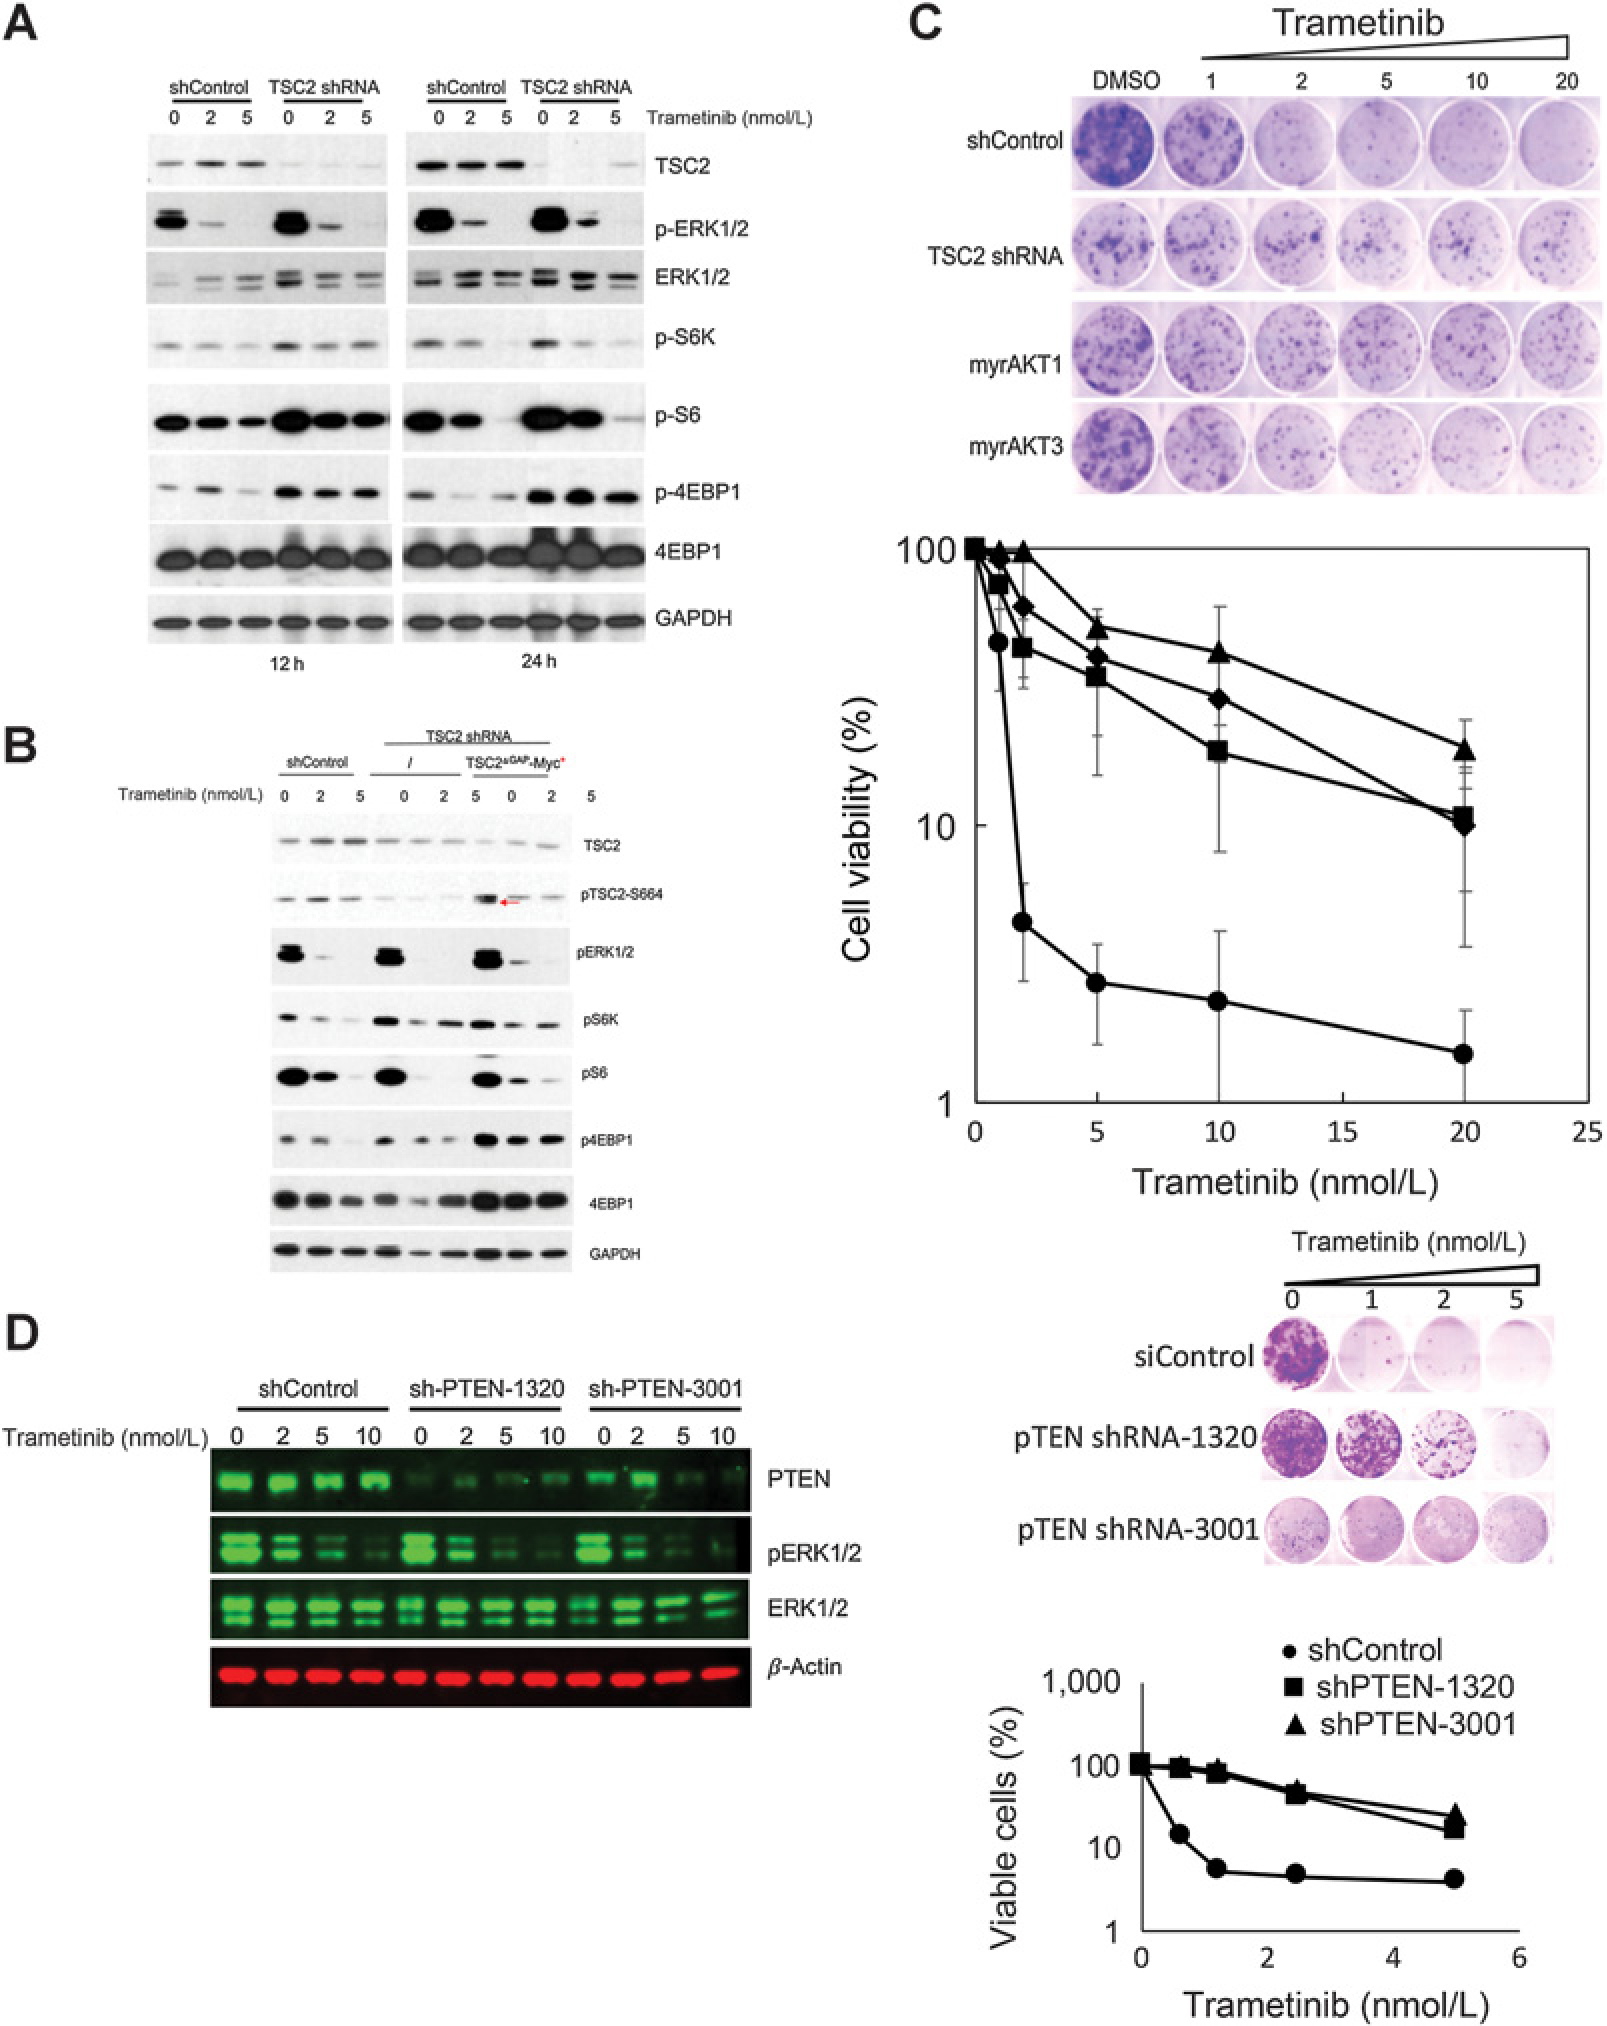
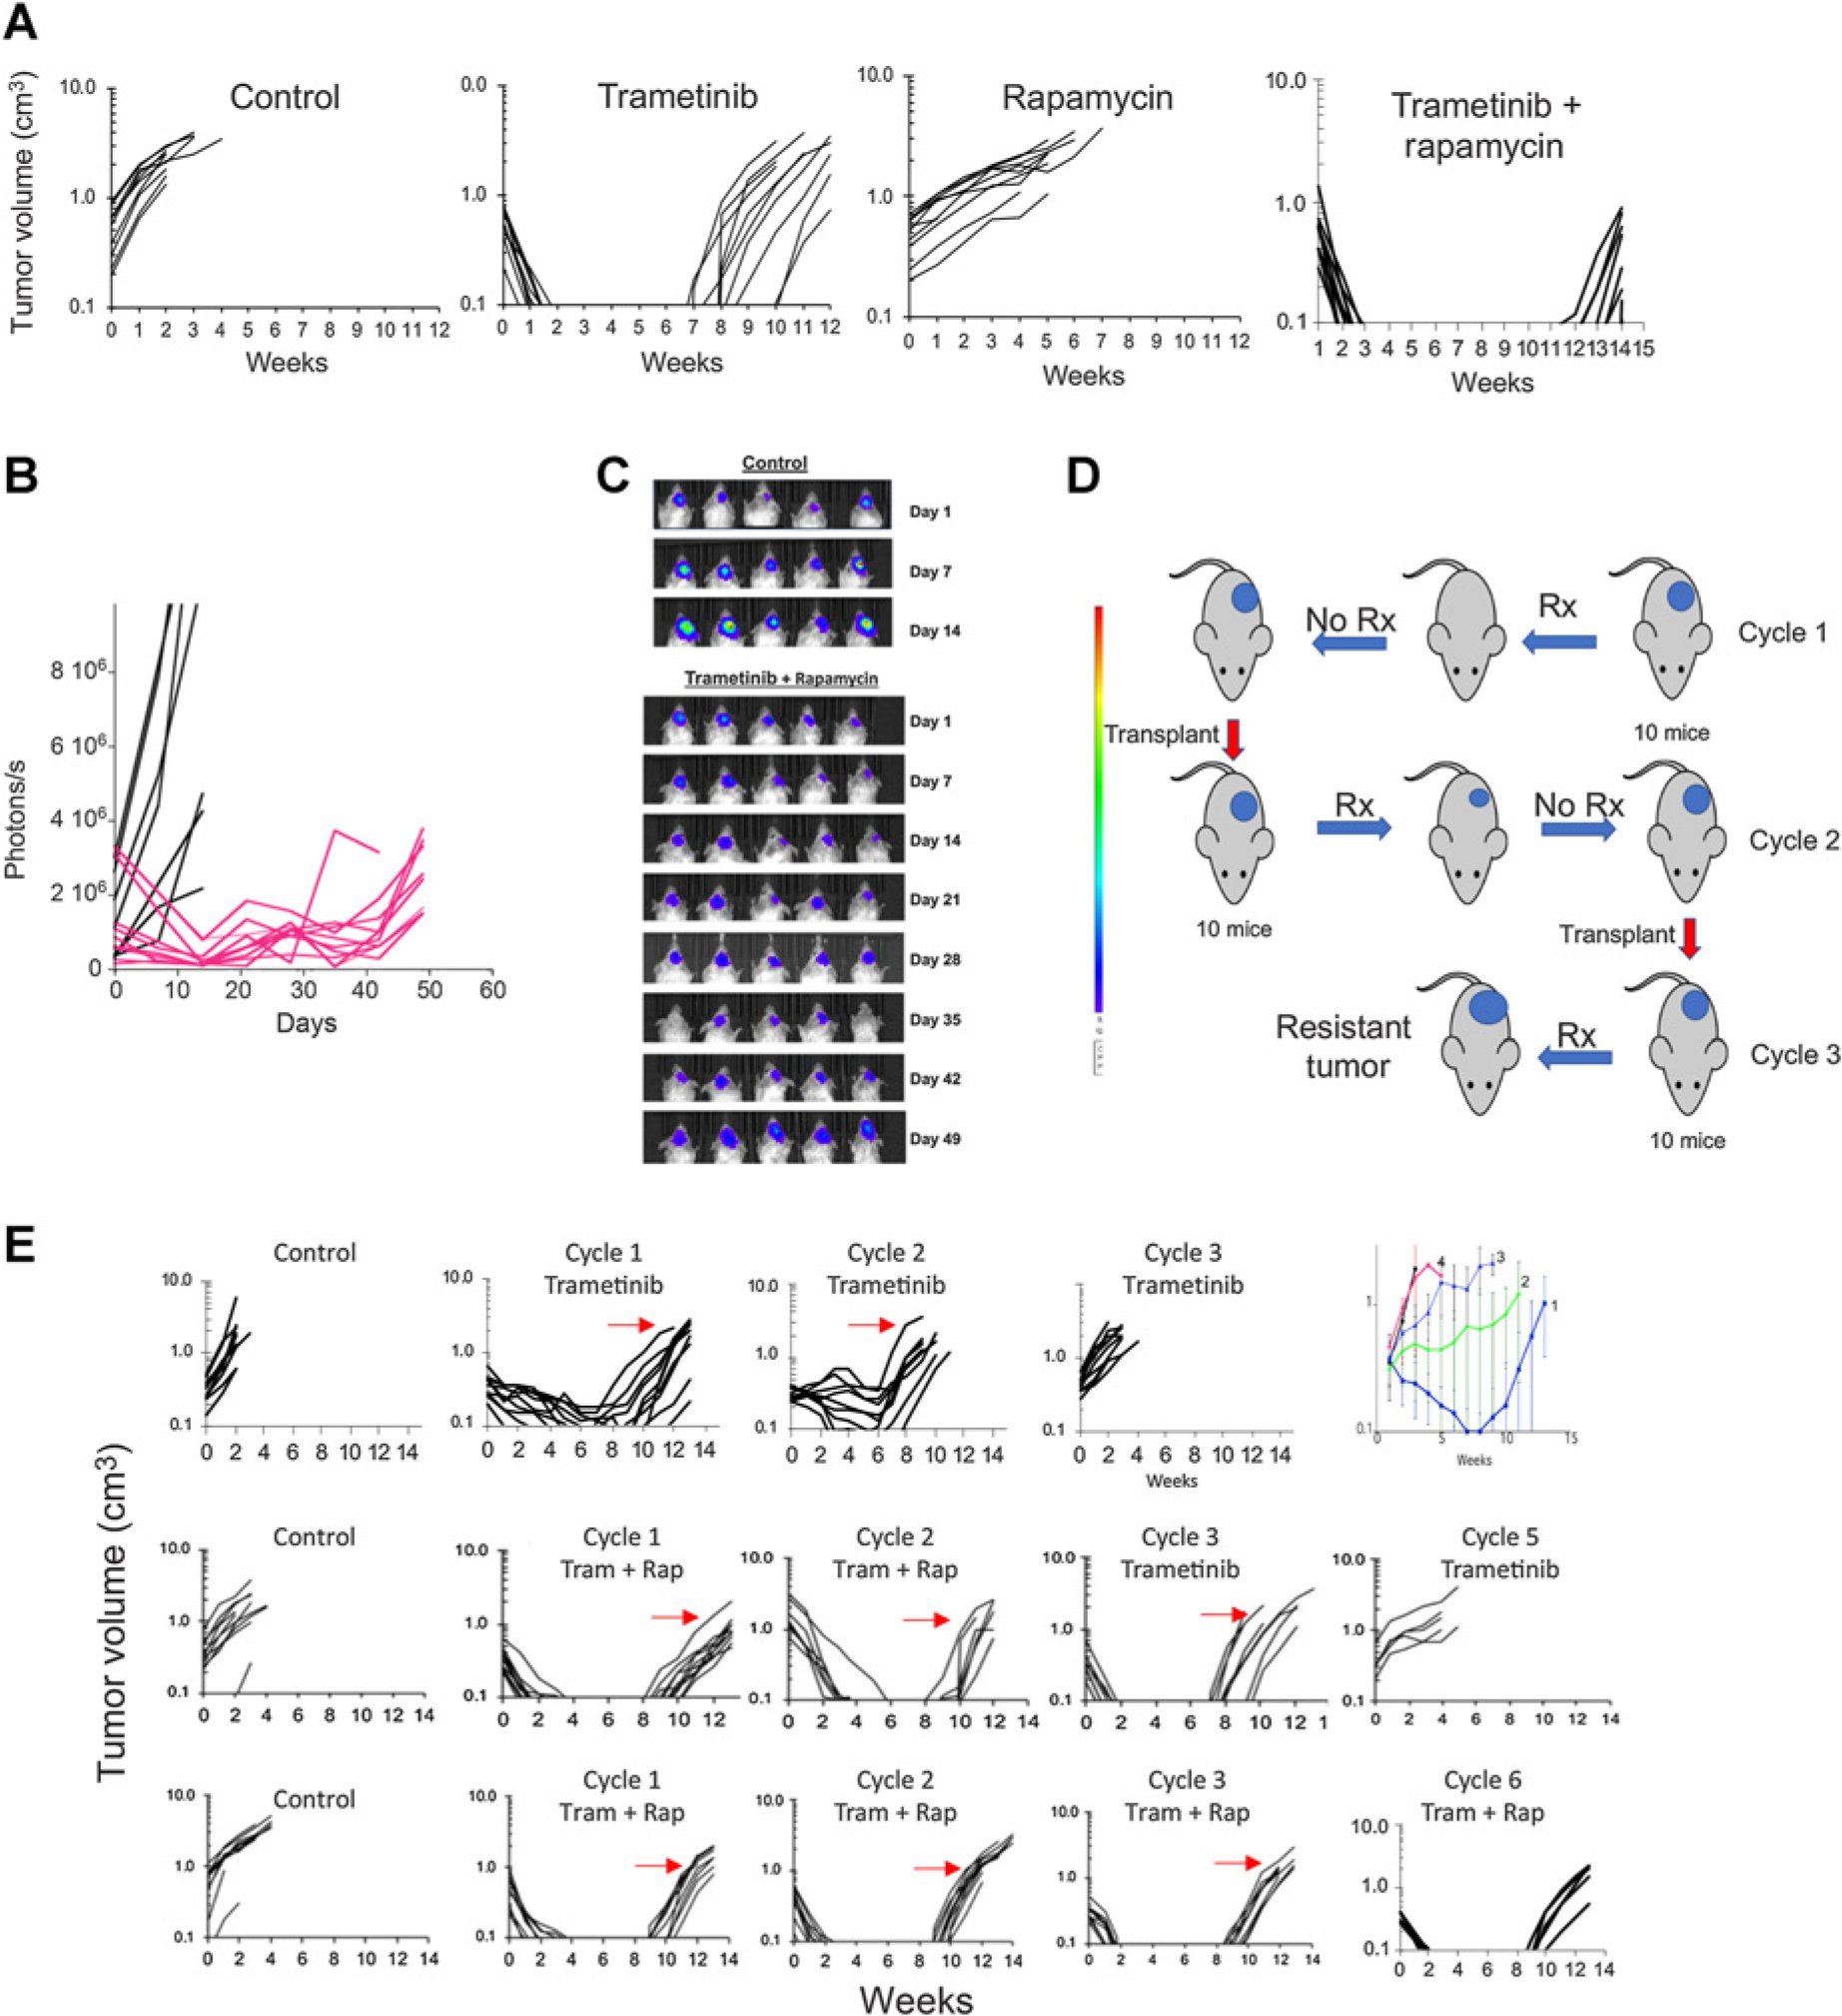
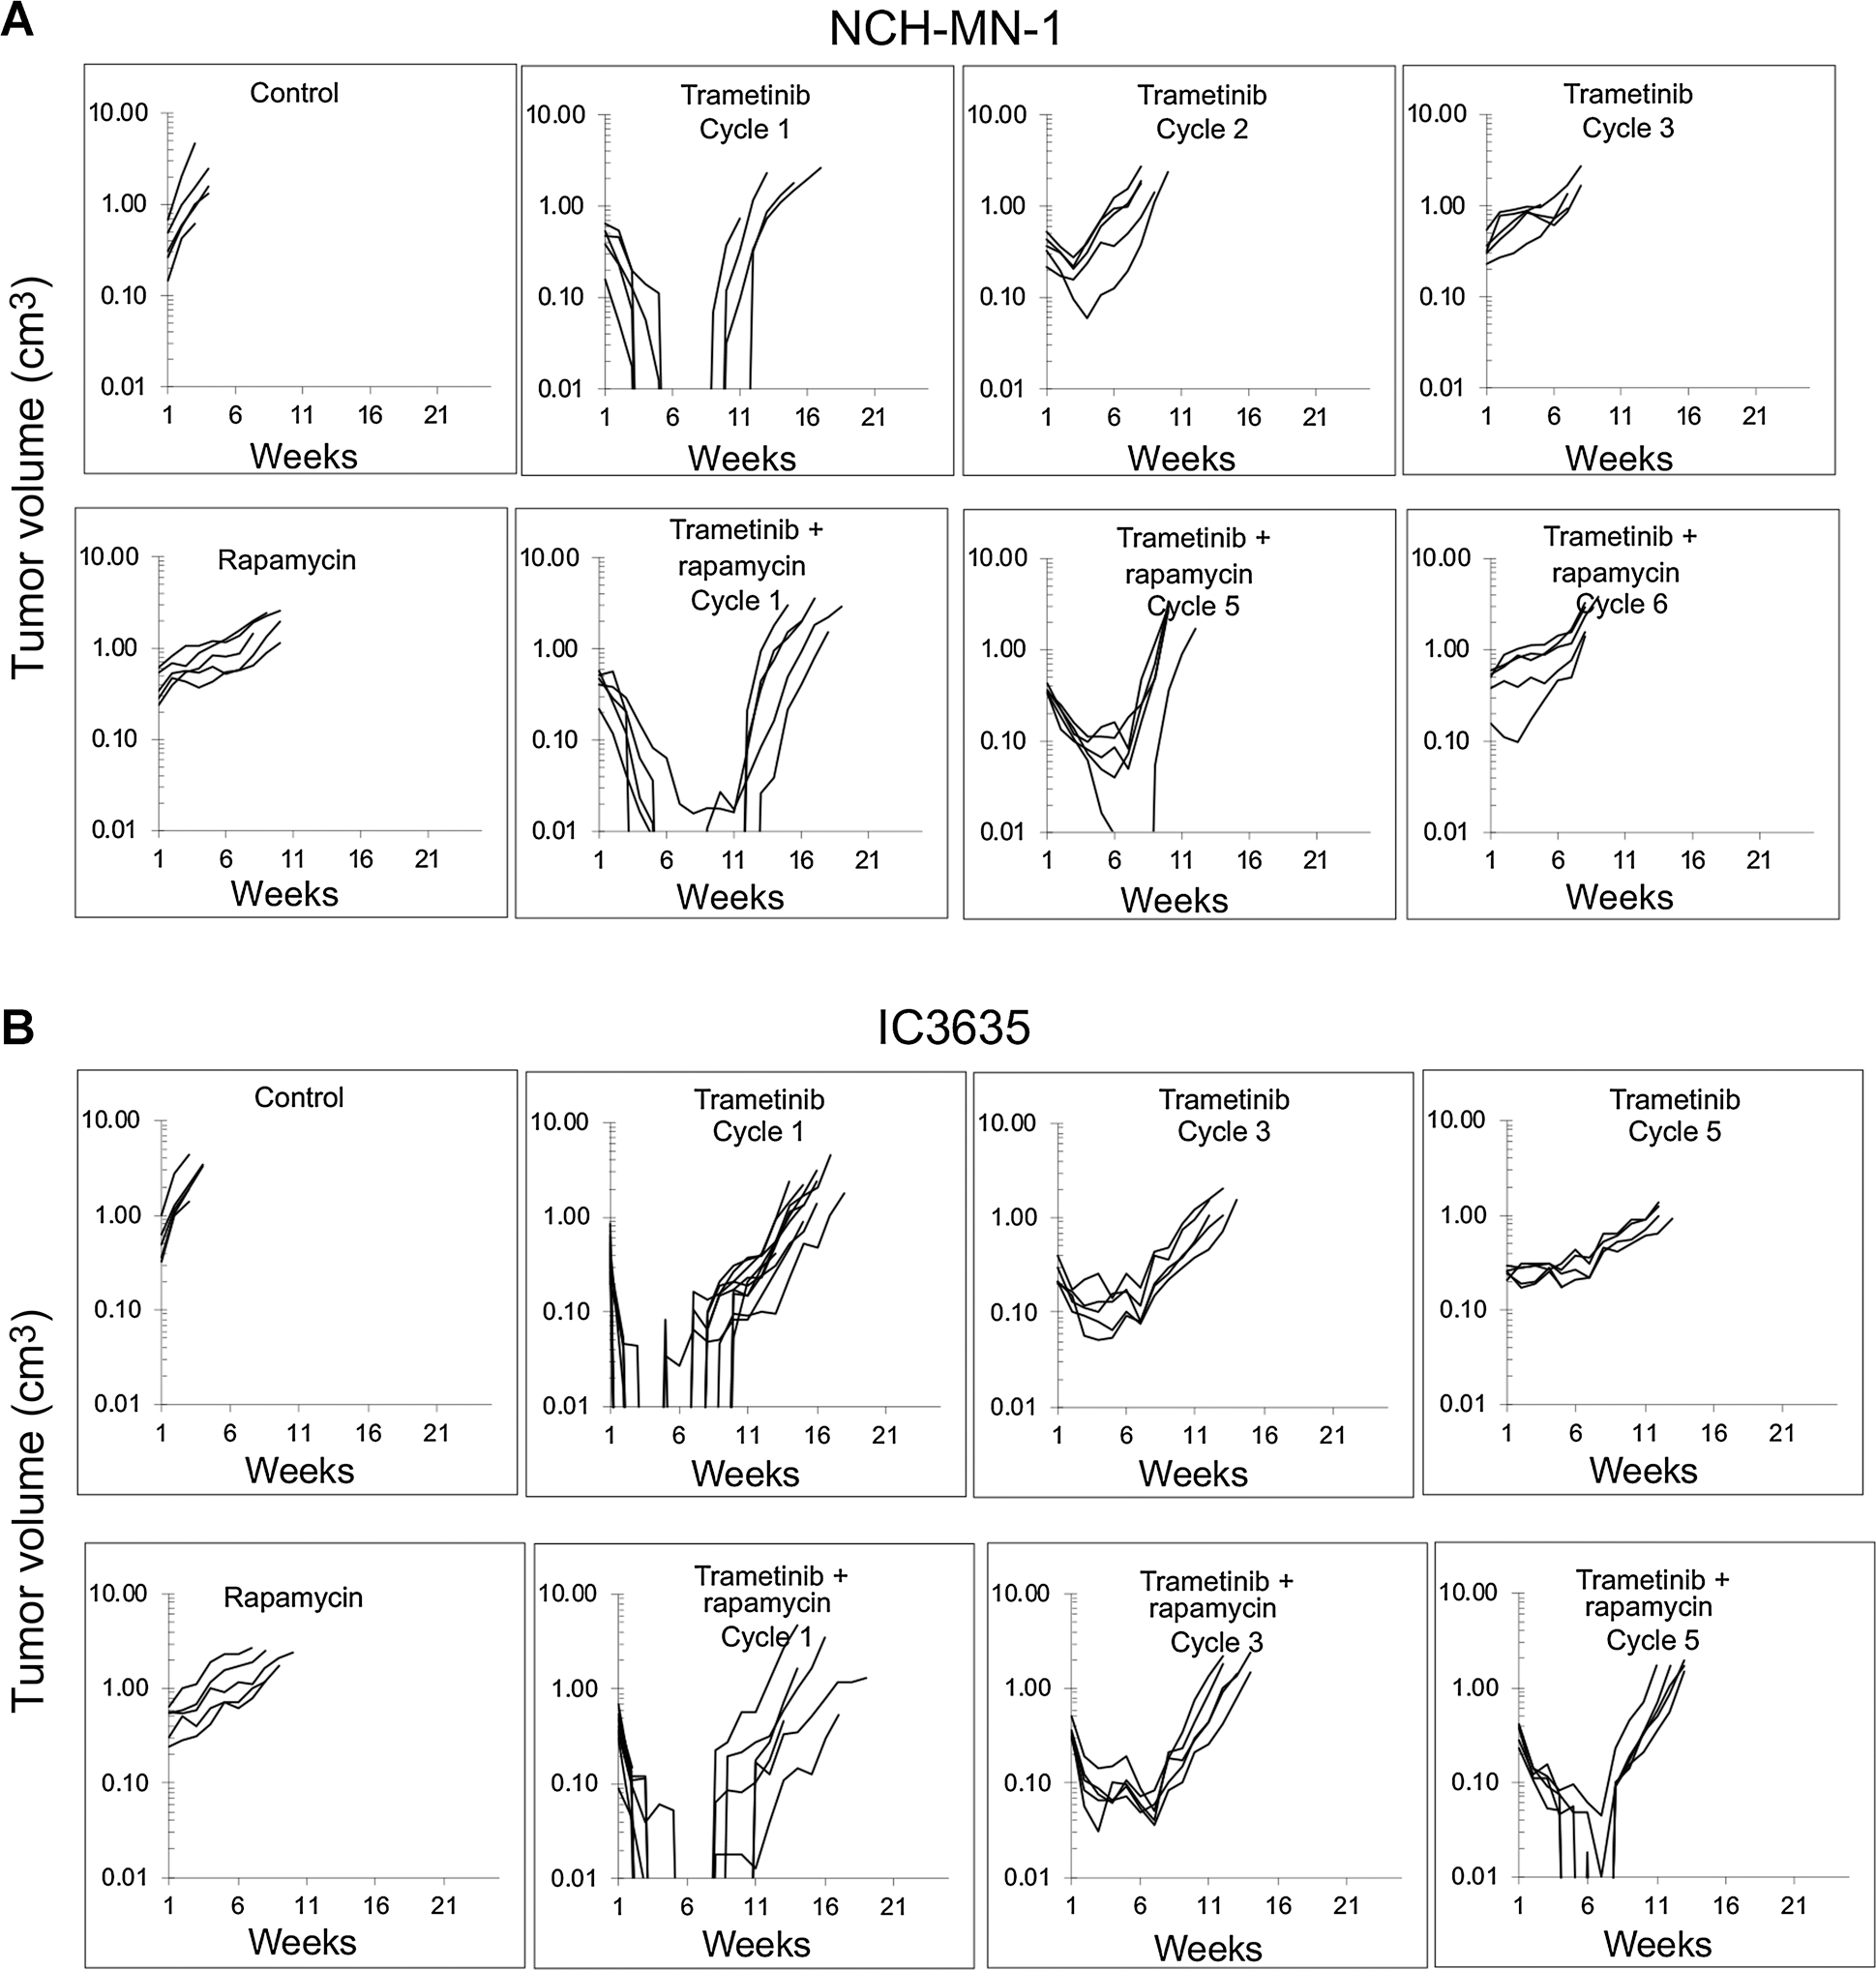
Results: In pediatric models TORC1 is activated through ERK-mediated inactivation of the tuberous sclerosis complex (TSC): consequently inhibition of MEK also suppressed TORC1 signaling. Trametinib-induced tumor regression correlated with dual inhibition of MAPK/TORC1 signaling, and decoupling TORC1 regulation from BRAF/MAPK control conferred trametinib resistance. In mice, acquired resistance to trametinib developed within three cycles of therapy in all three PDX models. Resistance to trametinib developed in situ is tumor-cell-intrinsic and the mechanism was tumor line specific. Rapamycin retarded or blocked development of resistance.

Conclusions: In these three pediatric BRAF-mutant brain tumors, TORC1 signaling is controlled by the MAPK cascade. Trametinib suppressed both MAPK/TORC1 pathways leading to tumor regression. While low-dose intermittent rapamycin to enhance inhibition of TORC1 only modestly enhanced the antitumor activity of trametinib, it prevented or retarded development of trametinib resistance, suggesting future therapeutic approaches using rapamycin analogs in combination with MEKis that may be therapeutically beneficial in both KIAA1549::BRAF- and BRAFV600E-driven gliomas.


Figures

Figure 1.
Figure 1.
Sensitivity to trametinib of BRAFV600E mutant pediatric brain tumor PDX models correlates with suppression of MAPK and TORC1 signaling. A to C, sensitivity of BT-40, NCH-MN-1, and IC-3635 brain tumor PDX models to trametinib (1 mg/kg daily × 42 days). D to E, Pharmacodynamic changes in MAPK and TORC1 signaling following trametinib (1 mg/kg) administered on day 1 or treatment for 5 consecutive days. Tumors were harvested 4 hours after the final drug administration. F, Mice bearing BT-40, NCH-MN-1, or IC-3635 xenografts were untreated or received trametinib (1 mg/kg/day) for 5 days, and phosphorylation of TSC2 at an Akt site (T1462) and an MAPK site (S664) was determined. No phosphorylation of TSC2 at T1462 was detected in control or treated xenografts, whereas phosphorylation of TSC2 (S664) was decreased in trametinib-treated tumors. Trametinib induces phosphorylation of TSC2(T1462) in DBTRG cells, and expression of Myr-AKT3 induces phosphorylation of TSC2(T1462) in AM38C adult glioblastoma cells. G, Schema of MEKi sensitivity in cells with MAPK mediated inactivation of TSC2 without PI3K/Akt phosphorylation of TSC2. h, hours.
Figure 2.
Figure 2.
Activating TORC1 signaling confers resistance to trametinib in BT-40 cells. A, TSC2 was suppressed using shRNA. Cells were exposed to trametinib (2 or 5 nmol/L) for 12 or 24 hours. Trametinib inhibited phosphorylation of 4E-BP1 in control transfected cells but not in cells where TSC2 had been down regulated. B, Expression of shTSC2ΔGAP-Myc (red arrow) increases p4E-BP1 that is not inhibited by trametinib. C, Activating TORC1, by knockdown of TSC2, or expression of constitutively active myrAkt1 or myrAkt3 induces trametinib resistance in BT-40 cells. D, Knockdown of PTEN confers trametinib resistance in BT-40 cells. Left, PTEN was suppressed using lentivirus encoded shRNA. After 48 hours cells were exposed to trametinib (2–10 nmol/L) for 24 hours, and lysates probed for PTEN and total and phosphorylated ERK1/2. β-actin was used as a loading control. Right, BT-40 cells were infected with control virus (shControl), or two shPTEN lentiviruses. Cells infected with lentivirus were subjected to 2 days’ selection with 1 ug/mL puromycin, and then used for the subsequent assay. Cells were exposed to trametinib for 48 hours (n = 3 ± SD).
Figure 3.
Figure 3.
Sensitivity and development of acquired resistance in BT-40 BRAF-mutant xenografts to trametinib, rapamycin, or the combination. A, Responses of BT-40 PDX. Mice bearing subcutaneous BT-40 tumor were randomized to receive no treatment, trametinib (1 mg/kg daily × 42 days), rapamycin (5 mg/kg daily × 5 for 6 consecutive weeks), or the combination. Each curve shows the growth of an individual tumor. B, Activity of the trametinib–rapamycin combination on intracranial BT-40/Luc tumors. 105 BT-40/Luc cells expressing luciferase were implanted intracranially. Mice were randomized into control or treatment groups when the BLI value reached >1 × 10⁵ photons/sec/cm3 and received combination treatment as in (A). Mice were imaged once weekly to ascertain tumor growth. Individual tumor growth curves based on BLI emission. Control (black), treated (Red) BLI values plotted against time for control and treatment groups. C, Luciferase images of cranial tumor growth in control and treatment groups. D, Schema for developing drug resistance in mice. E, Top, Responses of BT-40 xenografts to three cycles of trametinib treatment (1 mg/kg/day for 42 consecutive days). The arrows indicate the tumor that was transplanted into recipient mice for the subsequent cycle of treatment. Top right panel, mean tumor volume (±SD) for cycles 1 to 4 of treatment; Center panels, Responses of BT-40 xenografts for two cycles of trametinib + rapamycin (trametinib 1 mg/kg daily × 42, rapamycin 5 mg/kg daily × 5 for 6 consecutive weeks). After two cycles of treatment, single agent trametinib was administered for three further cycles; Bottom panels, Responses of BT-40 xenografts for six cycles of trametinib + rapamycin (trametinib 1 mg/kg daily × 42, rapamycin 5 mg/kg daily × 5 for 6 consecutive weeks). Each curve represents the growth of a single tumor. The arrows indicate the tumor that was transplanted into recipient mice for the subsequent cycle of treatment. s, second; Rx, treatment; Tram, trametinib; rap, rapamycin.
Figure 4.
Figure 4.
Rapamycin retards development of trametinib resistance in the NCH-MN-1 and IC-3635 PDX models. A, Growth of control NCH-MN-1 and responses of xenografts to treatment with trametinib (1 mg/kg daily × 42 days) on cycles 1 to 3, (top); development of resistance to combination treatment with trametinib-rapamycin (bottom). Mice received trametinib 1 mg/kg daily × 42 days and rapamycin 5 mg/kg daily × 5 for 6 consecutive weeks for five cycles. B, Growth of control IC-3635 and responses of xenografts to treatment with trametinib (1 mg/kg daily × 42 days) on cycles 1 to 5, (top); development of resistance to combination treatment with trametinib-rapamycin (bottom). Mice received trametinib 1 mg/kg daily × 42 days and rapamycin 5 mg/kg daily × 5 for 6 consecutive weeks for five cycles.
Figure 5.
Figure 5.
Trametinib resistance is associated with increased apoptotic threshold. A, Sensitivity of freshly isolated BT-40 or BT-40TramR (trametinib-resistant. Eight cycles of treatment in mice) and BT-40 Trap (trametinib–rapamycin—treated; 5 cycles in mice) cells to mitochondrial loss of membrane potential (Δψ) with increasing Bim BH3 peptide concentration; FCCP was used as a control to measure complete loss of membrane potential. ED50: BT-40 0.14 μmol/L [95% confidence interval (CI), 0.08–0.24 μmol/L]; BT-40TramR 1.94 μmol/L (95% CI, 0.91–4.5 μmol/L); BT-40Trap 0.1 μmol/L (95% CI, 0.04–0.15 μmol/L). B, Sensitivity of freshly isolated BT-40 or BT-40Trap cells (three cycles of trametinib + rapamycin in mice) to mitochondrial loss of membrane potential (Δψ) with increasing Bim BH3 peptide concentration; FCCP was used as a control to measure complete loss of membrane potential. C, Western blot for 8 BT-40 tumors and 8 trametinib-resistant PDX (TramR) and 8 trametinib—rapamycin–treated tumors (Trap) for Bax, Bim, and BCLXL; D, Quantitation of Bax and Bim levels from (C).
Figure 6.
Figure 6.
Changes in NCH-MN-1 xenografts with acquired resistance to trametinib. A, Mice bearing NCH-MN-1 tumors resistant to trametinib (cycle 3) were treated with trametinib (1 mg/kg daily for up to 5 days). B, Levels of DUSP6 in parental or trametinib resistant MN-1 xenografts. C, Cells from parental NCH-MN-1 xenografts, trametinib-resistant xenografts (TramR, cycle 3), or cells from NCH-MN-1 tumors treated for three cycles of trametinib—rapamycin (Trap). Trametinib-resistant cells show enhanced MAPK signaling. D, Response to increasing concentrations of trametinib in parental, trametinib-resistant, and cells isolated from tumors after three cycles of combination treatment. E, Response to trametinib of NCH-MN-1 cells from parental PDX tumor (formula image 
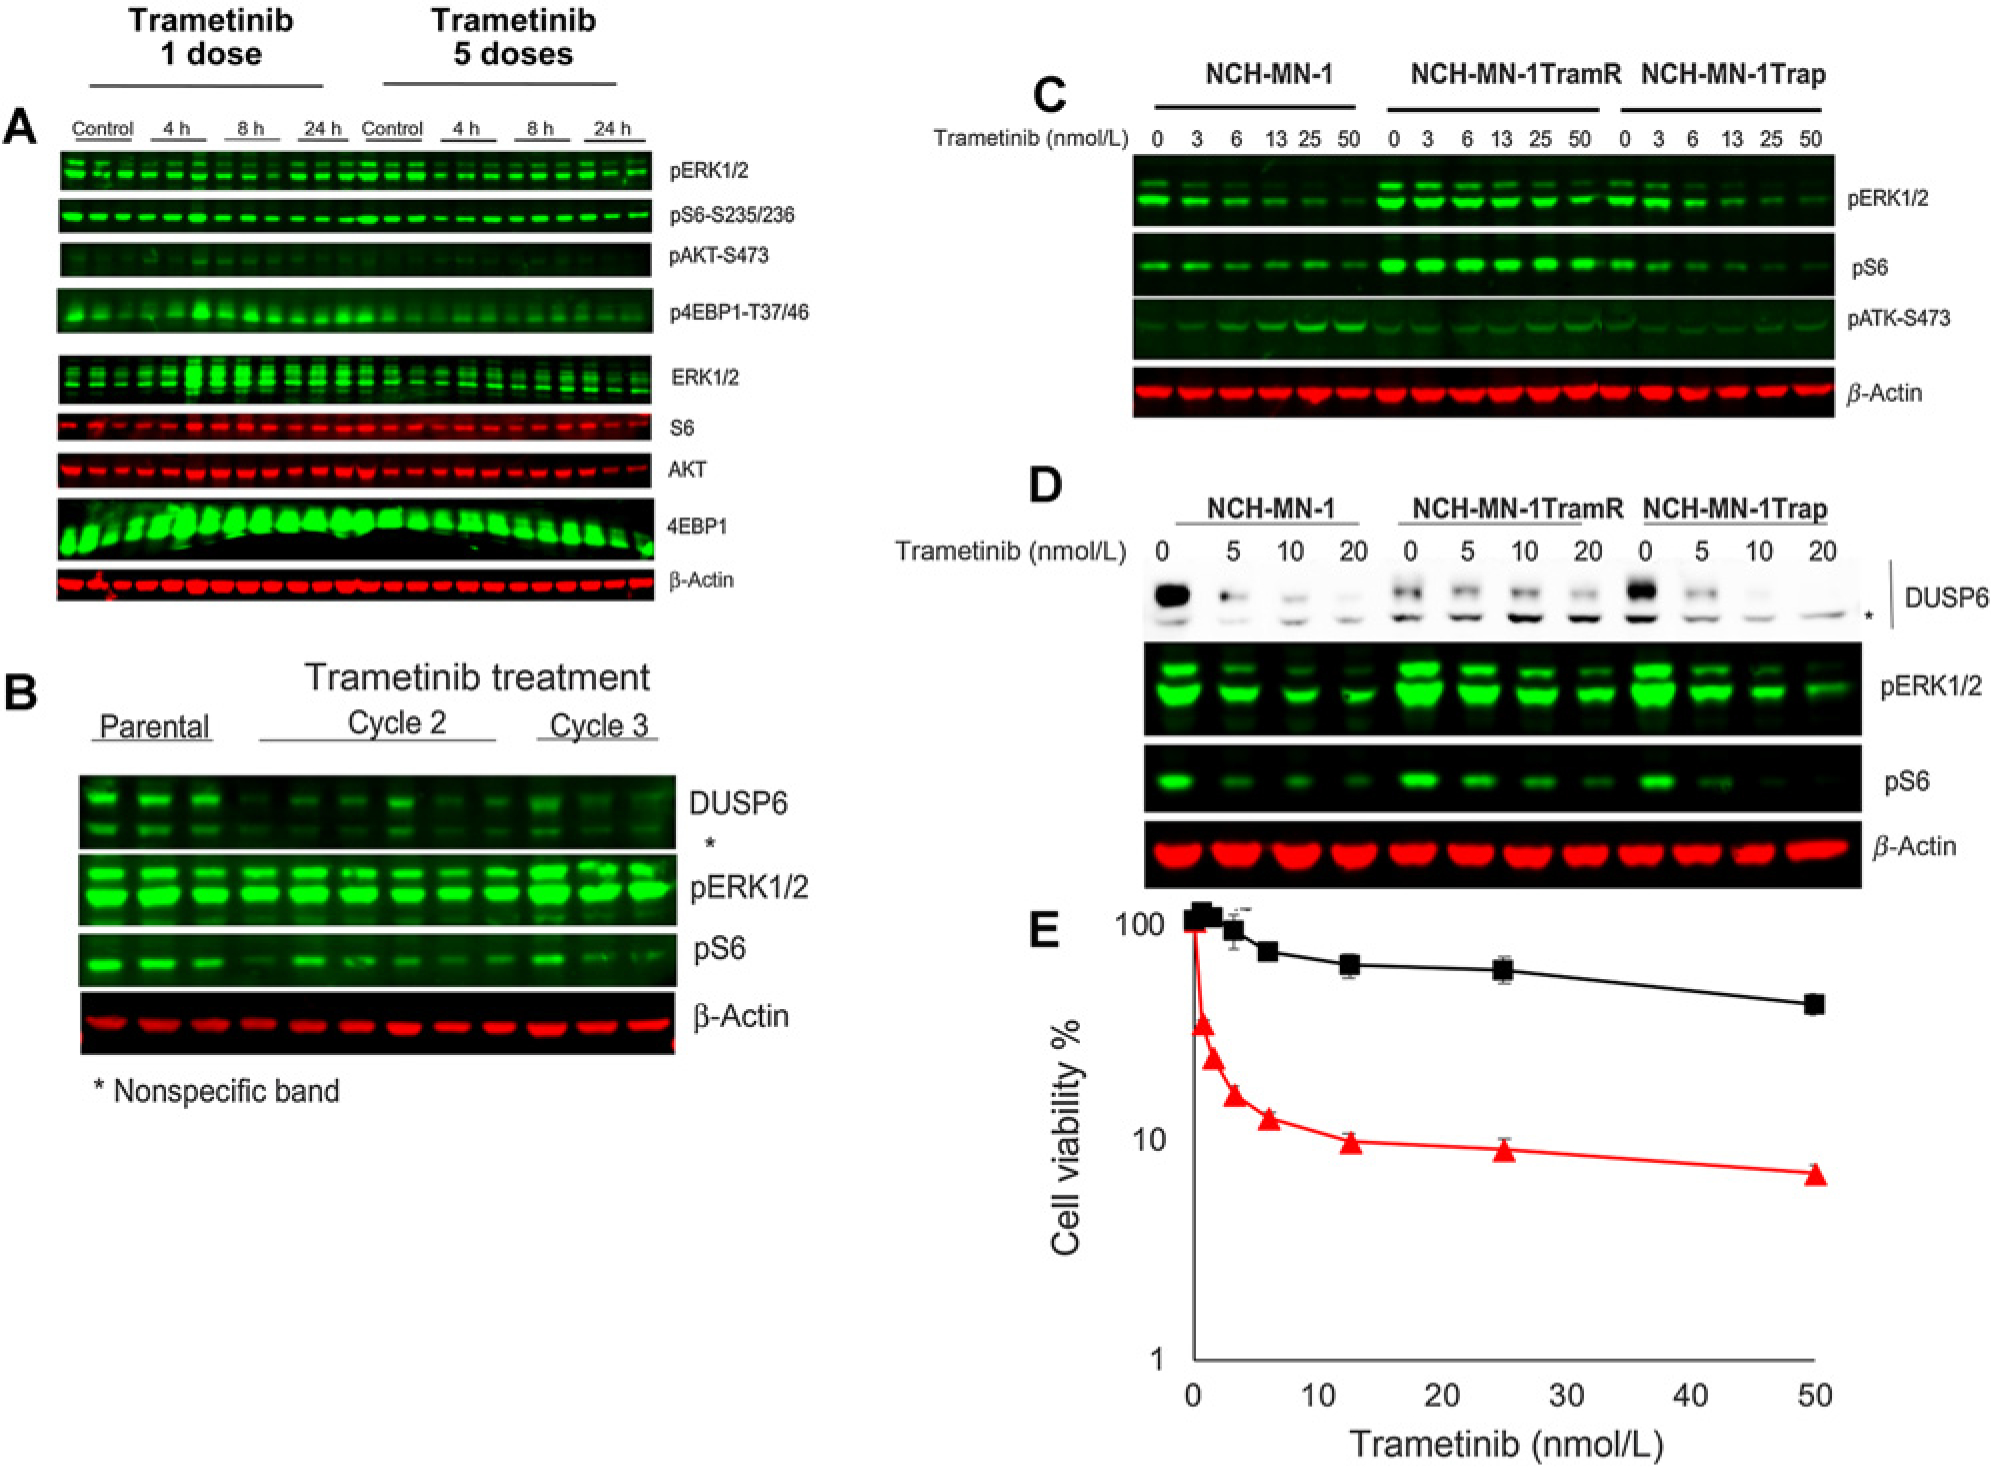
red line) and trametinib-resistant xenografts (■ black line). Cells cultured in stem cell medium supplemented with FGF and rEGF were exposed to indicated concentration of trametinib for 72 hours. Cell proliferation was measured by Alamar Blue. h, hours.
Figure 7.
Figure 7.
Response of IC-3635 cells derived from trametinib-resistant xenografts. A, Cells were isolated from subcutaneous IC-3635 xenografts [cycle 4 trametinib (TramR) or cycle 4 combination treatment (Trap) treatment] and grown in serum-free conditions (left) or serum supplemented medium. In serum-free medium inhibition of MAPK and TORC1 signaling was similar in all derivatives, whereas in serum containing conditions of growth, inhibition of MAPK and TORC1 signaling was markedly attenuated only in cells derived from parental IC-3635 tumors and from combination treated tumors (Trap). B, IC-3635 trametinib-resistant cells were incubated with trametinib (2 nmol/L) in the absence or presence of receptor tyrosine kinase inhibitors. Phosphorylation of ERK1/2 and S6 were determined at 24 hours. C, Response of parental (▲) or IC-3635TramR (■ trametinib resistant) cells to trametinib without or with the panRAF inhibitor LY3009120 (formula image
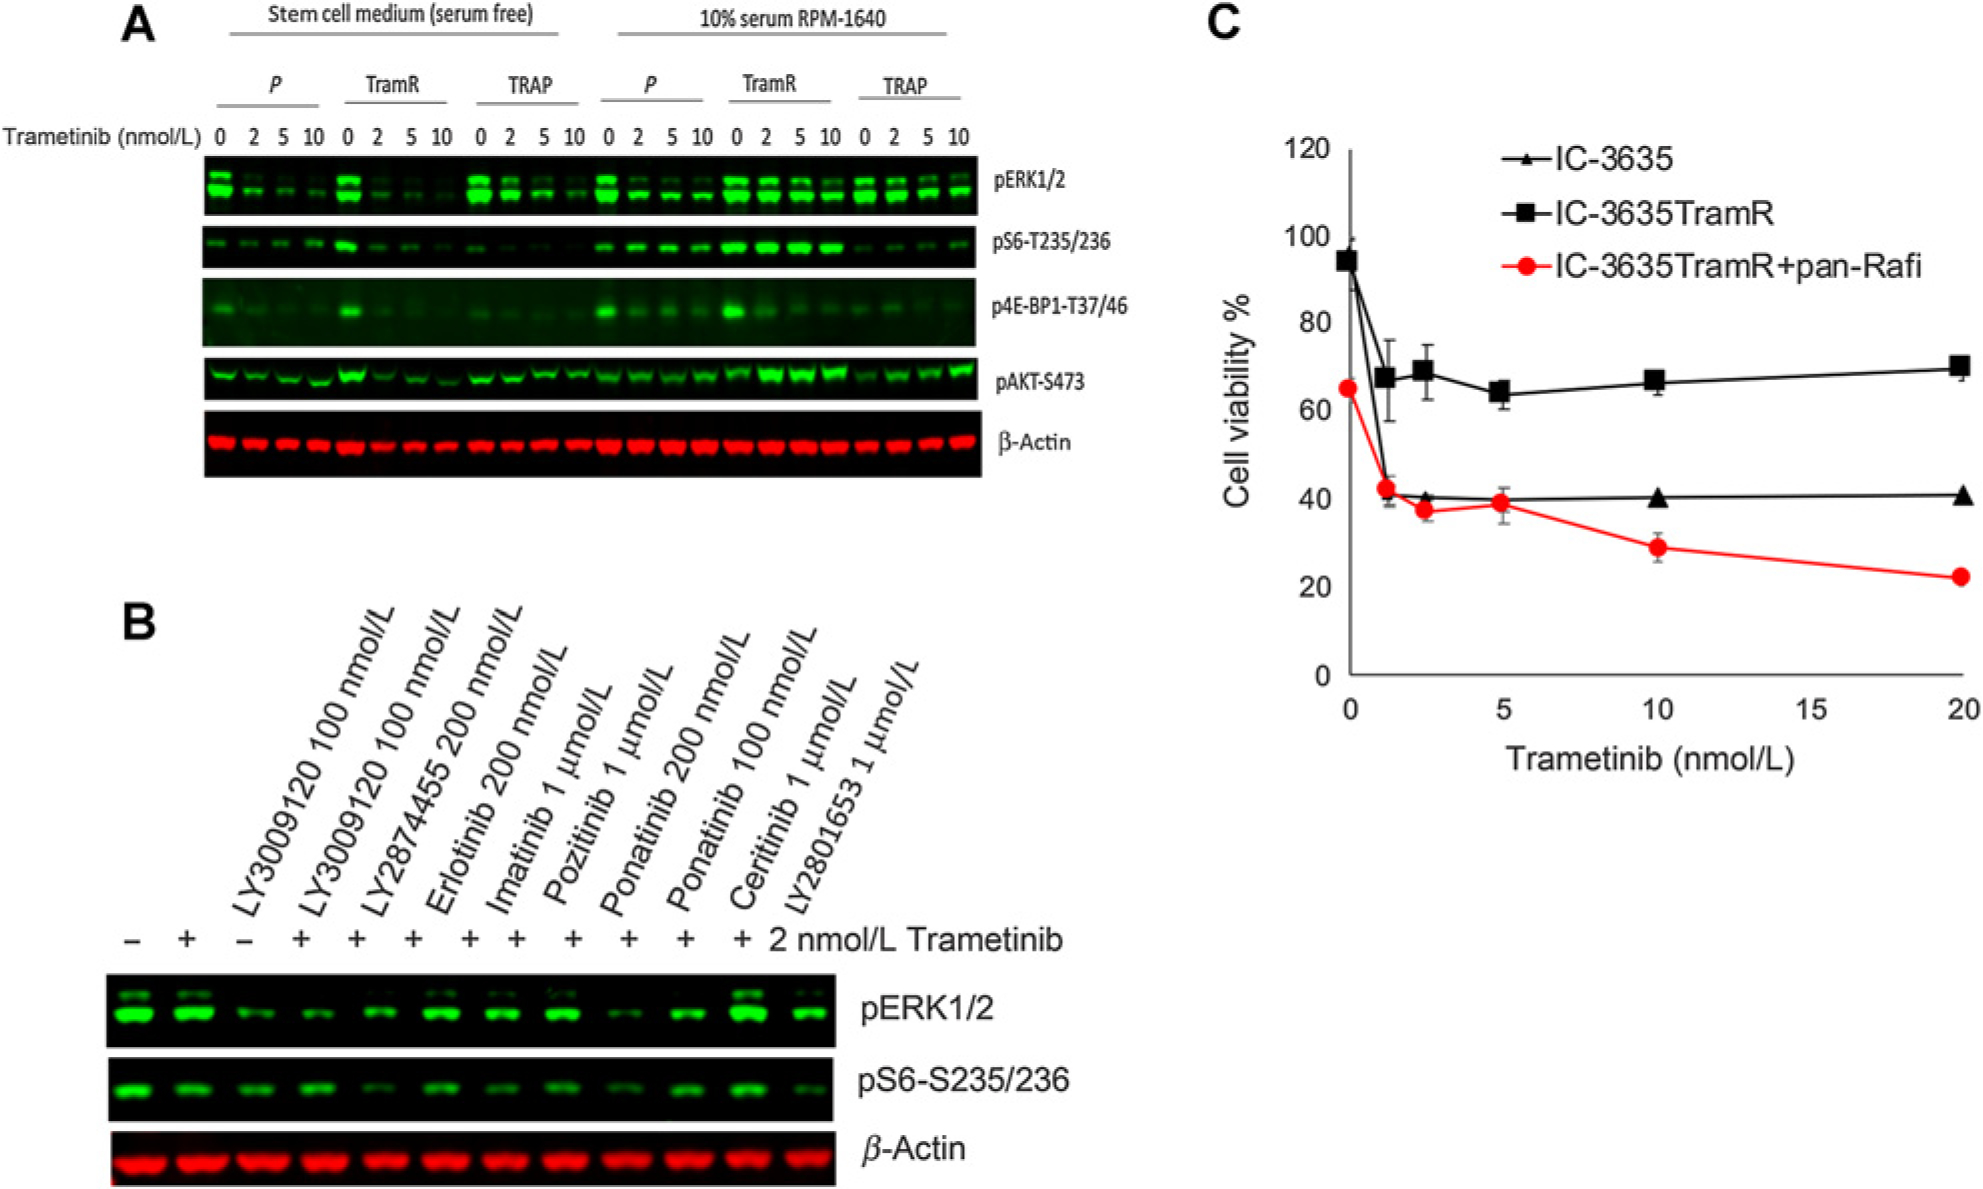
). Cells were cultured in stem cell medium supplemented with FGF and EGF and exposed to the indicated concentration of trametinib with or without combining panRaf inhibitor for 72 hours. Cell viability was measured by Alamar Blue, untreated cells were set as 100%.

References

    1. Gnekow AK, Falkenstein F, von Hornstein S, Zwiener I, Berkefeld S, Bison B, et al. Long-term follow-up of the multicenter, multidisciplinary treatment study HIT-LGG-1996 for low-grade glioma in children and adolescents of the german speaking society of pediatric oncology and hematology. Neuro Oncol 2012;14:1265–84. - PMC - PubMed
    1. Merchant TE, Conklin HM, Wu S, Lustig RH, Xiong X. Late effects of conformal radiation therapy for pediatric patients with low-grade glioma: prospective evaluation of cognitive, endocrine, and hearing deficits. J Clin Oncol 2009;27:3691–7. - PMC - PubMed
    1. Ater JL, Zhou T, Holmes E, Mazewski CM, Booth TN, Freyer DR, et al. Randomized study of two chemotherapy regimens for treatment of low-grade glioma in young children: a report from the children’s oncology group. J Clin Oncol 2012;30:2641–7. - PMC - PubMed
    1. Ris MD, Beebe DW, Armstrong FD, Fontanesi J, Holmes E, Sanford RA, et al. Cognitive and adaptive outcome in extracerebellar low-grade brain tumors in children: a report from the children’s oncology group. J Clin Oncol 2008;26:4765–70. - PMC - PubMed
    1. Greenberger BA, Pulsifer MB, Ebb DH, MacDonald SM, Jones RM, Butler WE, et al. Clinical outcomes and late endocrine, neurocognitive, and visual profiles of proton radiation for pediatric low-grade gliomas. Int J Radiat Oncol Biol Phys 2014;89:1060–8. - PubMed

MeSH terms