. 2022 Jul 7;17(7):e0270923.
doi: 10.1371/journal.pone.0270923. eCollection 2022.

LiveCellMiner: A new tool to analyze mitotic progression

Affiliations

LiveCellMiner: A new tool to analyze mitotic progression

Daniel Moreno-Andrés et al. PLoS One. .

Abstract

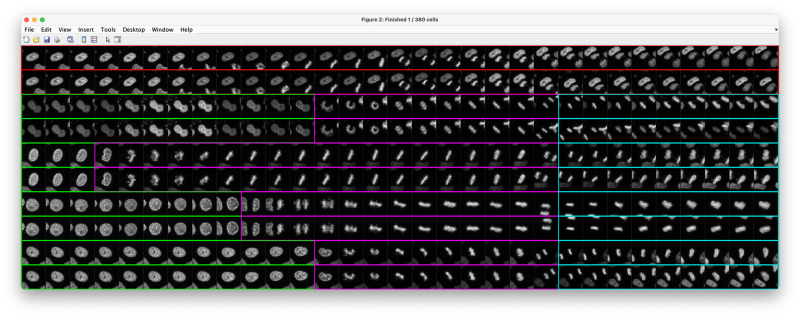
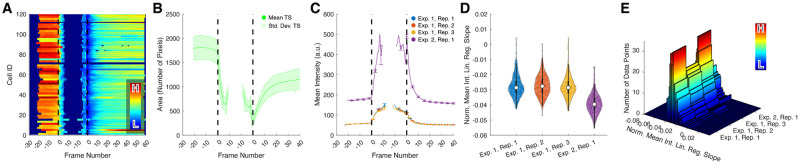
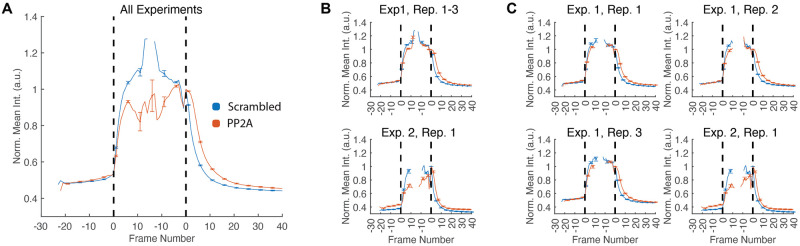
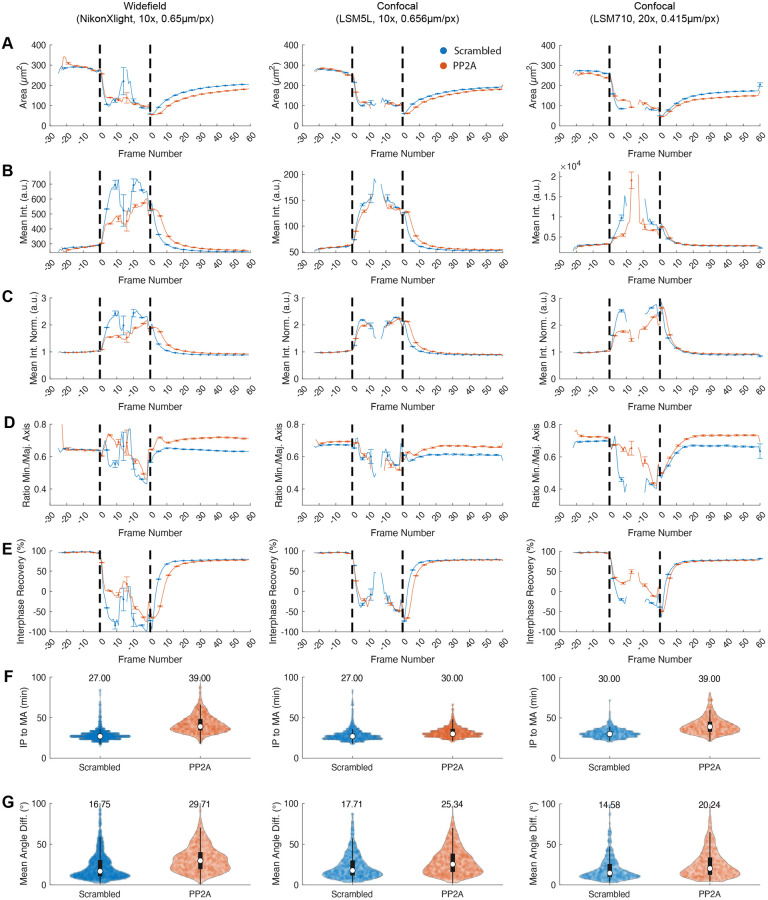
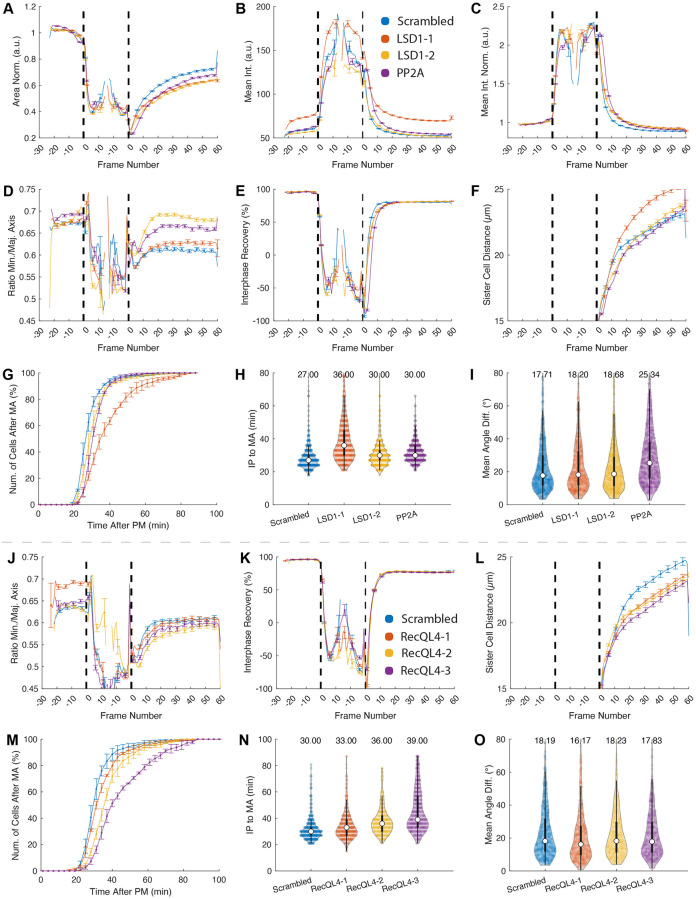
Live-cell imaging has become state of the art to accurately identify the nature of mitotic and cell cycle defects. Low- and high-throughput microscopy setups have yield huge data amounts of cells recorded in different experimental and pathological conditions. Tailored semi-automated and automated image analysis approaches allow the analysis of high-content screening data sets, saving time and avoiding bias. However, they were mostly designed for very specific experimental setups, which restricts their flexibility and usability. The general need for dedicated experiment-specific user-annotated training sets and experiment-specific user-defined segmentation parameters remains a major bottleneck for fully automating the analysis process. In this work we present LiveCellMiner, a highly flexible open-source software tool to automatically extract, analyze and visualize both aggregated and time-resolved image features with potential biological relevance. The software tool allows analysis across high-content data sets obtained in different platforms, in a quantitative and unbiased manner. As proof of principle application, we analyze here the dynamic chromatin and tubulin cytoskeleton features in human cells passing through mitosis highlighting the versatile and flexible potential of this tool set.


Conflict of interest statement

The authors have declared that no competing interests exist.

Figures

Fig 1
Fig 1. Graphical user interface for trajectory synchronization.
Using an intuitive annotation scheme, users can verify and potentially correct the cell synchronization. Moreover, erroneous tracks that do not contain a mitotic event can be discarded. An initial synchronization can be automatically obtained using both classical and machine learning-based synchronization methods as detailed in the main text. Colors indicate interphase frames (green), pro-, prometa-, meta- and early anaphase frames (magenta), late ana- and telophase (cyan) and erroneous trajectories (red).
Fig 2
Fig 2. Visualization options of LiveCellMiner.
The LiveCellMiner extension provides multiple ways of data visualization. (A) Temporally aligned heatmaps of feature time series (color encodes the feature value, e.g., the area in numbers of pixels as in this example), (B) mean ± std. dev. curves summarizing all trajectories of a particular position or experiment in a separate subplot, (C) mean curves of multiple experiments with error bars plotted in a single axis for better comparability, (D) violin or box plots of single feature values and (E) histograms of individual data points grouped according to the current selection. See S12 Fig for more information about the time axis used for plotting temporal features.
Fig 3
Fig 3. Grouped data visualizations.
The three panels illustrate the different grouped visualization possibilities and were obtained using four experiments showing the normalized mean intensity for two oligos (Scrambled, PP2A). Exp. 1, Rep. 1–3 are three repetitions of the same experiment and Exp. 2, Rep. 1 is one separate experiment that was acquired using a different modality (confocal instead of a widefield microscope). The settings for combining the experiments (from left to right) are: (A) average time series of all experiments and repeats, (B) time series averaged over the repeats with separate plots per experiment and (C) individual plots for all experiments and repeats. Error bars indicate one standard deviation and the vertical bars represent the IP and the MA transitions.
Fig 4
Fig 4. Platform comparison.
Reproducibility study with different microscope systems. The columns show exemplary quantifications of the same experiment conducted on different microscopy platforms. We compare Scrambled (control, blue) vs. PP2A knockdown cells (orange). The time series features involve the chromatin area (μm2) (A), the chromatin mean intensity (a.u.) (B), the normalized mean intensity (absolute intensity values divided by the interphase mean intensity of each cell, a.u.) (C), the minor axis vs. major axis ratio (D) and interphase-recovery feature as detailed in S2 Table (E). The violin plots show the duration between interphase-prophase and meta-anaphase transition in minutes (F) and the sum of the absolute angular changes in degrees (G). Widefield 10×: NScrambled = 1262, NPP2A = 1198; Confocal 10×: NScrambled = 2830, NPP2A = 1008; Confocal 20×: NScrambled = 792, NPP2A = 668.
Fig 5
Fig 5. Analysis of PP2A (Positive control), LSD1 and RecQL4 knockdowns.
Panels (A)-(I) show control (Scrambled) vs. LSD1–1, LSD1–2 and PP2A, whereas panels (J)-(O) show control (Scrambled) vs. RecQL4–1, RecQL4–2 and RecQL4–3 knockdown cells. The features involve the normalized area (A), the mean intensity (B), the normalized mean intensity (absolute intensity values divided by the interphase mean intensity of each cell, C), the minor axis vs. major axis ratio (D, J), the interphase recovery ratio (E, K), distance between sister chromatin masses (F, L) and cumulative histograms for the time in early mitotic progression until anaphase onset (G, M). The violin plots show the duration between interphase-prophase and meta-anaphase transition in minutes (H, N) and the mean angular difference in degrees (I, O). Images of panels (A)-(I) were acquired with a confocal microscope (LSM5L, 10×, 0.656μm/pixel). The plots combine extracted trajectories from three independent repeats with a total number of NScrambled = 1262, NLSD1-2 = 970, NLSD1-6 = 1332, NPP2A = 1198 cells. Images of panels (J)-(O) below the dashed line were acquired with a confocal microscope (LSM5L, 20X, 0.328μm/pixel). The plots combine extracted trajectories from three independent repeats with a total number of NScrambled = 1094, NRecQL4-1 = 814, NRecQL4-3 = 842, NRecQL4-4 = 786 cells. See S2 and S3 Tables for details on the depicted features.

Similar articles

Cited by

References

    1. Usaj MM, Styles EB, Verster AJ, Friesen H, Boone C, Andrews BJ. High-Content Screening for Quantitative Cell Biology. Trends in Cell Biology. 2016;26(8):598–611. doi: 10.1016/j.tcb.2016.03.008 - DOI - PubMed
    1. Li S, Xia M. Review of High-Content Screening Applications in Toxicology. Archives of Toxicology. 2019;93(12):3387–3396. doi: 10.1007/s00204-019-02593-5 - DOI - PMC - PubMed
    1. Chandrasekaran SN, Ceulemans H, Boyd JD, Carpenter AE. Image-based Profiling for Drug Discovery: Due for a Machine-Learning Upgrade? Nature Reviews Drug Discovery. 2021;20(2):145–159. doi: 10.1038/s41573-020-00117-w - DOI - PMC - PubMed
    1. Rajewsky N, Almouzni G, Gorski SA, Aerts S, Amit I, Bertero MG, et al.. LifeTime and Improving European Healthcare Through Cell-Based Interceptive Medicine. Nature. 2020;587(7834):377–386. doi: 10.1038/s41586-020-2715-9 - DOI - PMC - PubMed
    1. Boland MV, Murphy RF. A Neural Network Classifier Capable of Recognizing the Patterns of All Major Subcellular Structures in Fluorescence Microscope Images of HeLa Cells. Bioinformatics. 2001;17(12):1213–23. doi: 10.1093/bioinformatics/17.12.1213 - DOI - PubMed

Publication types