. 2022 May 12:19:1-10.
doi: 10.2142/biophysico.bppb-v19.0019. eCollection 2022.

Structures of oxygen dissociation intermediates of 400 kDa V2 hemoglobin provide coarse snapshots of the protein allostery

Affiliations

Structures of oxygen dissociation intermediates of 400 kDa V2 hemoglobin provide coarse snapshots of the protein allostery

Nobutaka Numoto et al. Biophys Physicobiol. .

Abstract

Ever since the historic discovery of the cooperative oxygenation of its multiple subunits, hemoglobin (Hb) has been among the most exhaustively studied allosteric proteins. However, the lack of structural information on the intermediates between oxygenated and deoxygenated forms prevents our detailed understanding of the molecular mechanism of its allostery. It has been difficult to prepare crystals of intact oxy-deoxy intermediates and to individually identify the oxygen saturation for each subunit. However, our recent crystallographic studies have demonstrated that giant Hbs from annelids are suitable for overcoming these problems and can provide abundant information on oxy-deoxy intermediate structures. Here, we report the crystal structures of oxy-deoxy intermediates of a 400 kDa Hb (V2Hb) from the annelid Lamellibrachia satsuma, following up on a series of previous studies of similar giant Hbs. Four intermediate structures had average oxygen saturations of 78%, 69%, 55%, and 26%, as determined by the occupancy refinement of the bound oxygen based on ambient temperature factors. The structures demonstrate that the cooperative oxygen dissociation is weaker, large ternary and quaternary changes are induced at a later stage of the oxygen dissociation process, and the ternary and quaternary changes are smaller with local perturbations. Nonetheless, the overall structural transition seemed to proceed in the manner of the MWC two-state model. Our crystallographic snapshots of the allosteric transition of V2Hb provide important experimental evidence for a more detailed understanding of the allostery of Hbs by extension of the Monod-Wyman-Changeux (MWC) model.

Keywords: allosteric effector; cooperativity; oxygenation property; structural change.


Figures

Figure 1
Figure 1
The overall structure and oxygen equilibrium curve of V2Hb. (A) Ribbon diagram of V2Hb. The A1, A2, B1 and B2 subunits are shown in red, green, yellow and blue, respectively. Six copies of each subunit form a spherical 24-mer assembly as a biological unit. (B) Hill plot of oxygen binding by V2Hb. Y, fractional saturation of Hb with oxygen; pO2, partial pressure of oxygen in mmHg. Note that the plot appears to be almost linear shape due to limited range of pO2. The slope of the black line corresponds to the nmax value of 1.4.
Figure 2
Figure 2
Absorption spectra of the oxy-deoxy intermediate crystals of V2Hb. Data were measured using thin platelike crystals independently of the diffraction experiments via microspectrophotometer. The soaking times are shown in the inset of the diagram. The peaks around 630 nm are derived from the emission lines of the Hg–Xe lamp.
Figure 3
Figure 3
Determination of the oxygen saturation fraction of each subunit. (A) Electron densities superposed on the ligand sites of each subunit. The 2Fo-Fc maps (blue, contoured at 1.0σ) and the oxygen-omitted Fo-Fc maps (green, contoured at 3.0σ) are represented with stick models of the heme, oxygen, proximal histidine and distal histidine. (B) The residues to which the atoms subjected to the B-factor analysis belong are shown as stick models. (C) Transition of oxygen saturation in each subunit (vertical axis). The overall oxygen saturation of the crystals (horizontal axis) was calculated as the average of that of each subunit. Subunits forming the dimer subassembly are shown as a pair in each graph.
Figure 4
Figure 4
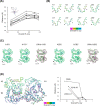
Ternary and quaternary structural transitions of V2Hb. (A) Changes of the distance between the Cβ atom of Val E11 and the iron of the heme (dashed line in the inset) for each subunit. Black circle, A1; black square, A2; black triangle, B1; black rhombus, B2; white circle, A1’; white square, A2’; white triangle, B1’; white rhombus, B2’. (B) Closeup views of the superpositions of the AB loops. Data 1, 2, 3, and 4 are drawn in magenta, yellow, green, and cyan, respectively. The A and B helices are labeled. (C) Quaternary changes of the dimer subassemblies. Superpositions of Data 3 (green) and 4 (cyan) of V2Hb of each dimer subassembly were calculated by only one subunit (upper subunit in the figures) to emphasize the quaternary changes. For comparison, the same superposition was performed for the dimer subassembly of OliHb (magenta, R-state; green, T-state). Distances at the GH loop (black arrows) are indicated. (D) Quaternary changes of the A1A2B1B2 tetramer subassemblies. The superposition was calculated by only the A2 subunit. The color schemes are the same as in panel B. The transition of the A helix of the A1 subunit (black arrow) was evaluated by the distances at the Cα atoms of Met12 between Data 1 and 2, 3, and 4, respectively, and plotted in the right panel. For comparison, the same calculations were performed for the A1’A2’B1’B2’ tetramer of V2Hb and the same tetramer of OliHb. Black square, transition of A1 of V2Hb; black triangle, transition of A1’ of V2Hb; white circle, transition of A1 of OliHb. All superpositions were calculated by an “align” command of program PyMOL (http://www.pymol.org/), in which a superposition is performed by utilizing the sequence alignment information and rejecting structural outlier atoms.

Similar articles

References

    1. Fenton, A. W. Allostery: An illustrated definition for the ‘second secret of life’. Trends Biochem. Sci. 33, 420–425 (2008). https://doi.org/10.1016/j.tibs.2008.05.009 - PMC - PubMed
    1. Liu, J., Nussinov, R.. Allostery: An overview of its history, concepts, methods, and applications. Plos Comput. Biol. 12, e1004966 (2016). https://doi.org/10.1371/journal.pcbi.1004966 - PMC - PubMed
    1. Monod, J. On chance and necessity in studies in the philosophy of biology: Reduction and related problems (Ayala, F. J., Dobzhansky, T. eds) pp. 357–375 (Macmillan Education UK, London, 1974). https://doi.org/10.1007/978-1-349-01892-5_20
    1. Bohr, C., Hasselbach, K. A., Krogh, A.. Über einen in biologischen beziehung wichtigen einfluss, den die kohlen-sauerspannung des blutes auf dessen sauerstoffbindung übt. Skand. Arch. Physiol. 15, 401–412 (1904).
    1. Monod, J., Wyman, J., Changeux, J. P.. On the nature of allosteric transitions: A plausible model. J. Mol. Biol. 12, 88–118 (1965). https://doi.org/10.1016/s0022-2836(65)80285-6 - PubMed