. 2022 Jul 7;18(7):e1010261.
doi: 10.1371/journal.pcbi.1010261. eCollection 2022 Jul.

Multi-scale model suggests the trade-off between protein and ATP demand as a driver of metabolic changes during yeast replicative ageing

Affiliations

Multi-scale model suggests the trade-off between protein and ATP demand as a driver of metabolic changes during yeast replicative ageing

Barbara Schnitzer et al. PLoS Comput Biol. .

Abstract

The accumulation of protein damage is one of the major drivers of replicative ageing, describing a cell's reduced ability to reproduce over time even under optimal conditions. Reactive oxygen and nitrogen species are precursors of protein damage and therefore tightly linked to ageing. At the same time, they are an inevitable by-product of the cell's metabolism. Cells are able to sense high levels of reactive oxygen and nitrogen species and can subsequently adapt their metabolism through gene regulation to slow down damage accumulation. However, the older or damaged a cell is the less flexibility it has to allocate enzymes across the metabolic network, forcing further adaptions in the metabolism. To investigate changes in the metabolism during replicative ageing, we developed an multi-scale mathematical model using budding yeast as a model organism. The model consists of three interconnected modules: a Boolean model of the signalling network, an enzyme-constrained flux balance model of the central carbon metabolism and a dynamic model of growth and protein damage accumulation with discrete cell divisions. The model can explain known features of replicative ageing, like average lifespan and increase in generation time during successive division, in yeast wildtype cells by a decreasing pool of functional enzymes and an increasing energy demand for maintenance. We further used the model to identify three consecutive metabolic phases, that a cell can undergo during its life, and their influence on the replicative potential, and proposed an intervention span for lifespan control.


Conflict of interest statement

The authors have declared that no competing interests exist.

Figures
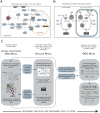
Fig 1
Fig 1. Multi-scale model construction.
(A) Yap1 and Sln1 signalling in response to oxidative stress via H2O2. The two pathways were added to Boolean signalling network. Trx1/2 exhibits cross-talk to Msn2/4, a component that is also part of the nutrient sensing pathway PKA. The figure is made with Cell Designer [72]. (B) ROS/RNS reactions that were added to the enzyme-constrained FBA model. The cell is exposed to oxidative stress as a consequence of electron leakage in the electron transport chain (ETC). (C) Schematic view of one time step in the multi-scale model. The enzyme-constrained FBA fluxes based on the current fraction of intact and damaged proteins determine the input states of the Boolean signalling layer. A set of Boolean rules alter the states of the signalling proteins, that eventually induce gene ex-/repression via a transcriptional layer, leading to constraints in individual enzyme usages. Solving the regulated enzyme-constrained FBA gives rise to a growth rate as well as a metabolic damage formation rate, that feed into the ODE model of growth and damage accumulation that is then solved for one time step. If the cell has accumulated enough biomass, the cell divides in an instantaneous event. Iterating the model over time-steps until the model becomes infeasible corresponds to a lifespan simulation.
Fig 2
Fig 2. Lifespan simulations of yeast wildtype cells.
(A) Replicative lifespans for typical yeast wildtype cells with varying damage repair r0 and non-metabolic damage formation rates f0. The model reproduces 17–32 divisions. (B) Zoom into variables of all three model parts over time for a specific exemplary parameter set (f0 = 0.0001, r0 = 0.0005): cell mass, fraction of intact and damaged proteins, growth rate, exchange fluxes normalised by the glucose uptake rate in the metabolic model (> 0: production rates, < 0: uptake rates), functional enzyme pool and input signals received by the signalling network (green: present, grey: not present). As cells age they accumulate damage, the growth rate drops and the metabolism needs to adapt. (C) Zoom out for varying damage repair r0 and non-metabolic damage formation rates f0 and regulation factors ϵ. If the tile is not filled (f0 = 0.0 and ϵ = 0.04), the simulated cell did not stop dividing in the simulation time. Stronger regulation increases the replicative lifespan and wildtype cells with more than 22 divisions cannot be achieved in this resolution if the regulation factor ϵ < 0.04. (D) Schematic view of the metabolic phases a cells undergoes during its replicative life: from maximal growth and fermentation (I) it slowly switches to respiration when the growth rate drops (II) until it eventually can also take up ethanol to produce energy close to cell death (III).
Fig 3
Fig 3. Effect of regulation and NGAM on lifespan.
All distributions are based on 29 wildtype parameter sets with f0 ≤ 5 ⋅ 10−4 and r0 ≤ 2 ⋅ 10−2 that lead to 23 divisions (from data in Fig 2A). (A) Effect of the regulation factor ϵ, i.e. how strong gene expression changes caused by stress signalling affect the metabolic model, on the lifespan simulations (line: mean, ribbons: 5% and 95% quantiles). Our model can only handle ϵ ≤ 5%. Weak regulation ϵ ≤ 2.5% mostly affects phase I, and stronger regulation ϵ > 2.5% phase II. (B) Distributions of replicative lifespans and average generation times for cells with knockouts of signalling proteins in the different pathways of the Boolean model (line: median, box: IQR, whiskers: median ±1.5 IQR). (C) Effect of the age-dependent non-growth associated maintenance NGAM (Eq (5)) on the transition between the phases (line: mean, ribbons: 5% and 95% quantiles). Increasing cost for non-growth associated maintenance, such as damage repair, can explain the switch from fermentation to respiration in phase II, indicated by higher O2 uptake, lower ethanol and higher CO2 and acetate production. The fluxes are normalised by the glucose uptake rate, negative fluxes are uptake and positive production rates. (D) Damage at cell death depending on NGAM (line: mean, ribbons: 5% and 95% quantiles). Increasing NGAM leads to lower damage tolerance before cell death, that happens in phase II for low NGAM and in phase III for higher NGAM.
Fig 4
Fig 4. Effect of enzyme perturbations on lifespan.
The simulations are based on f0 = 0.0001 and r0 = 0.0005 (as in Fig 2B) and perturbations (deletion or overexpression) in individual enzymes or isoenzyme combinations (140 + 23 cases) for different phases in the metabolic model. (A-B) Distribution (line: median, box: IQR, whiskers: median ±1.5 IQR) of the number of divisions in total and in particular phases upon overexpression or deletion of enzymes during specific times (facets) in relation to the wildtype (grey lines). An intervention in a specific phase can have a different effect than an intervention over the whole lifespan. (C-D) Relation between replicative lifespan and total enzyme usage relative to the wildtype. Each dot represents one simulation with the perturbation in a specific phase of an enzyme/isoenzymes. Both enzyme deletion and overexpression can lead to an increased but also decreased total usage of the enzyme compared to the wildtype.

Similar articles

Cited by

References

    1. López-Otín C, Blasco MA, Partridge L, Serrano M, Kroemer G. The Hallmarks of Aging. Cell. 2013;153(6):1194–1217. doi: 10.1016/j.cell.2013.05.039 - DOI - PMC - PubMed
    1. Jazwinski SM. Growing Old: Metabolic Control and Yeast Aging. Annu Rev Microbiol. 2002;56(1):769–792. doi: 10.1146/annurev.micro.56.012302.160830 - DOI - PubMed
    1. Fontana L, Partridge L, Longo VD. Extending Healthy Life Span—From Yeast to Humans. Science. 2010;328(5976):321–326. doi: 10.1126/science.1172539 - DOI - PMC - PubMed
    1. Denoth Lippuner A, Julou T, Barral Y. Budding yeast as a model organism to study the effects of age. FEMS Microbiology Reviews. 2014;38(2):300–325. doi: 10.1111/1574-6976.12060 - DOI - PubMed
    1. Young TZ, Liu P, Urbonaite G, Acar M. Quantitative Insights into Age-Associated DNA-Repair Inefficiency in Single Cells. Cell Reports. 2019;28(8):2220–2230.e7. doi: 10.1016/j.celrep.2019.07.082 - DOI - PMC - PubMed

Publication types

MeSH terms

LinkOut - more resources