Review
. 2022 Oct 26;122(20):15865-15913.
doi: 10.1021/acs.chemrev.1c01031. Epub 2022 Jul 7.

High-Throughput Glycomic Methods

Affiliations
Review

High-Throughput Glycomic Methods

Irena Trbojević-Akmačić et al. Chem Rev. .

Abstract

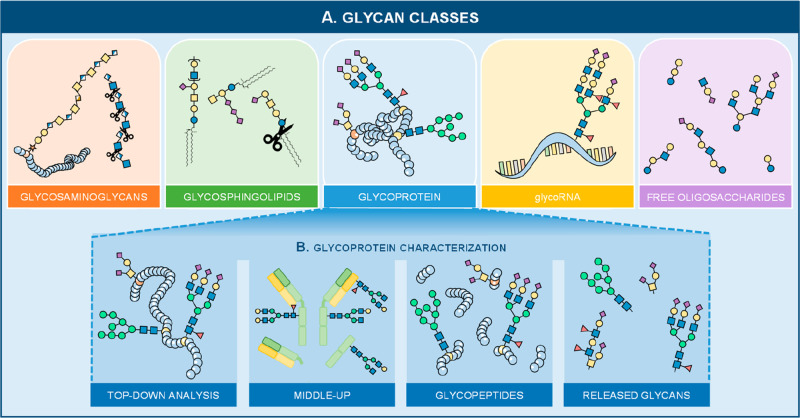
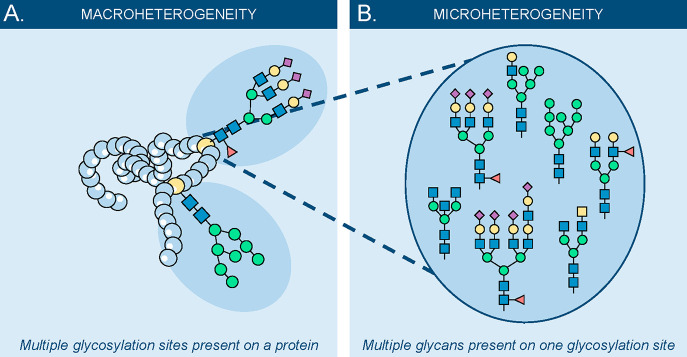
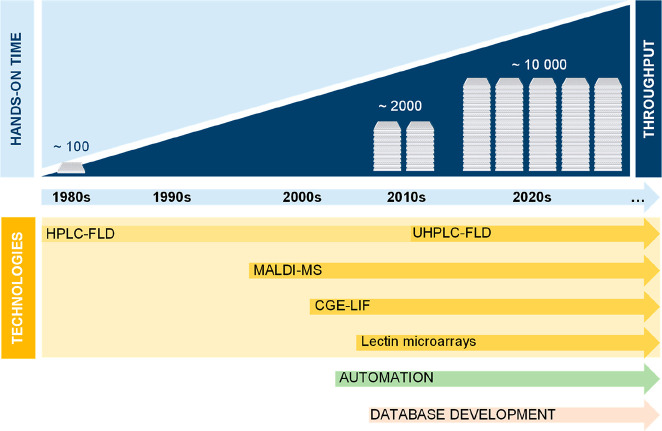
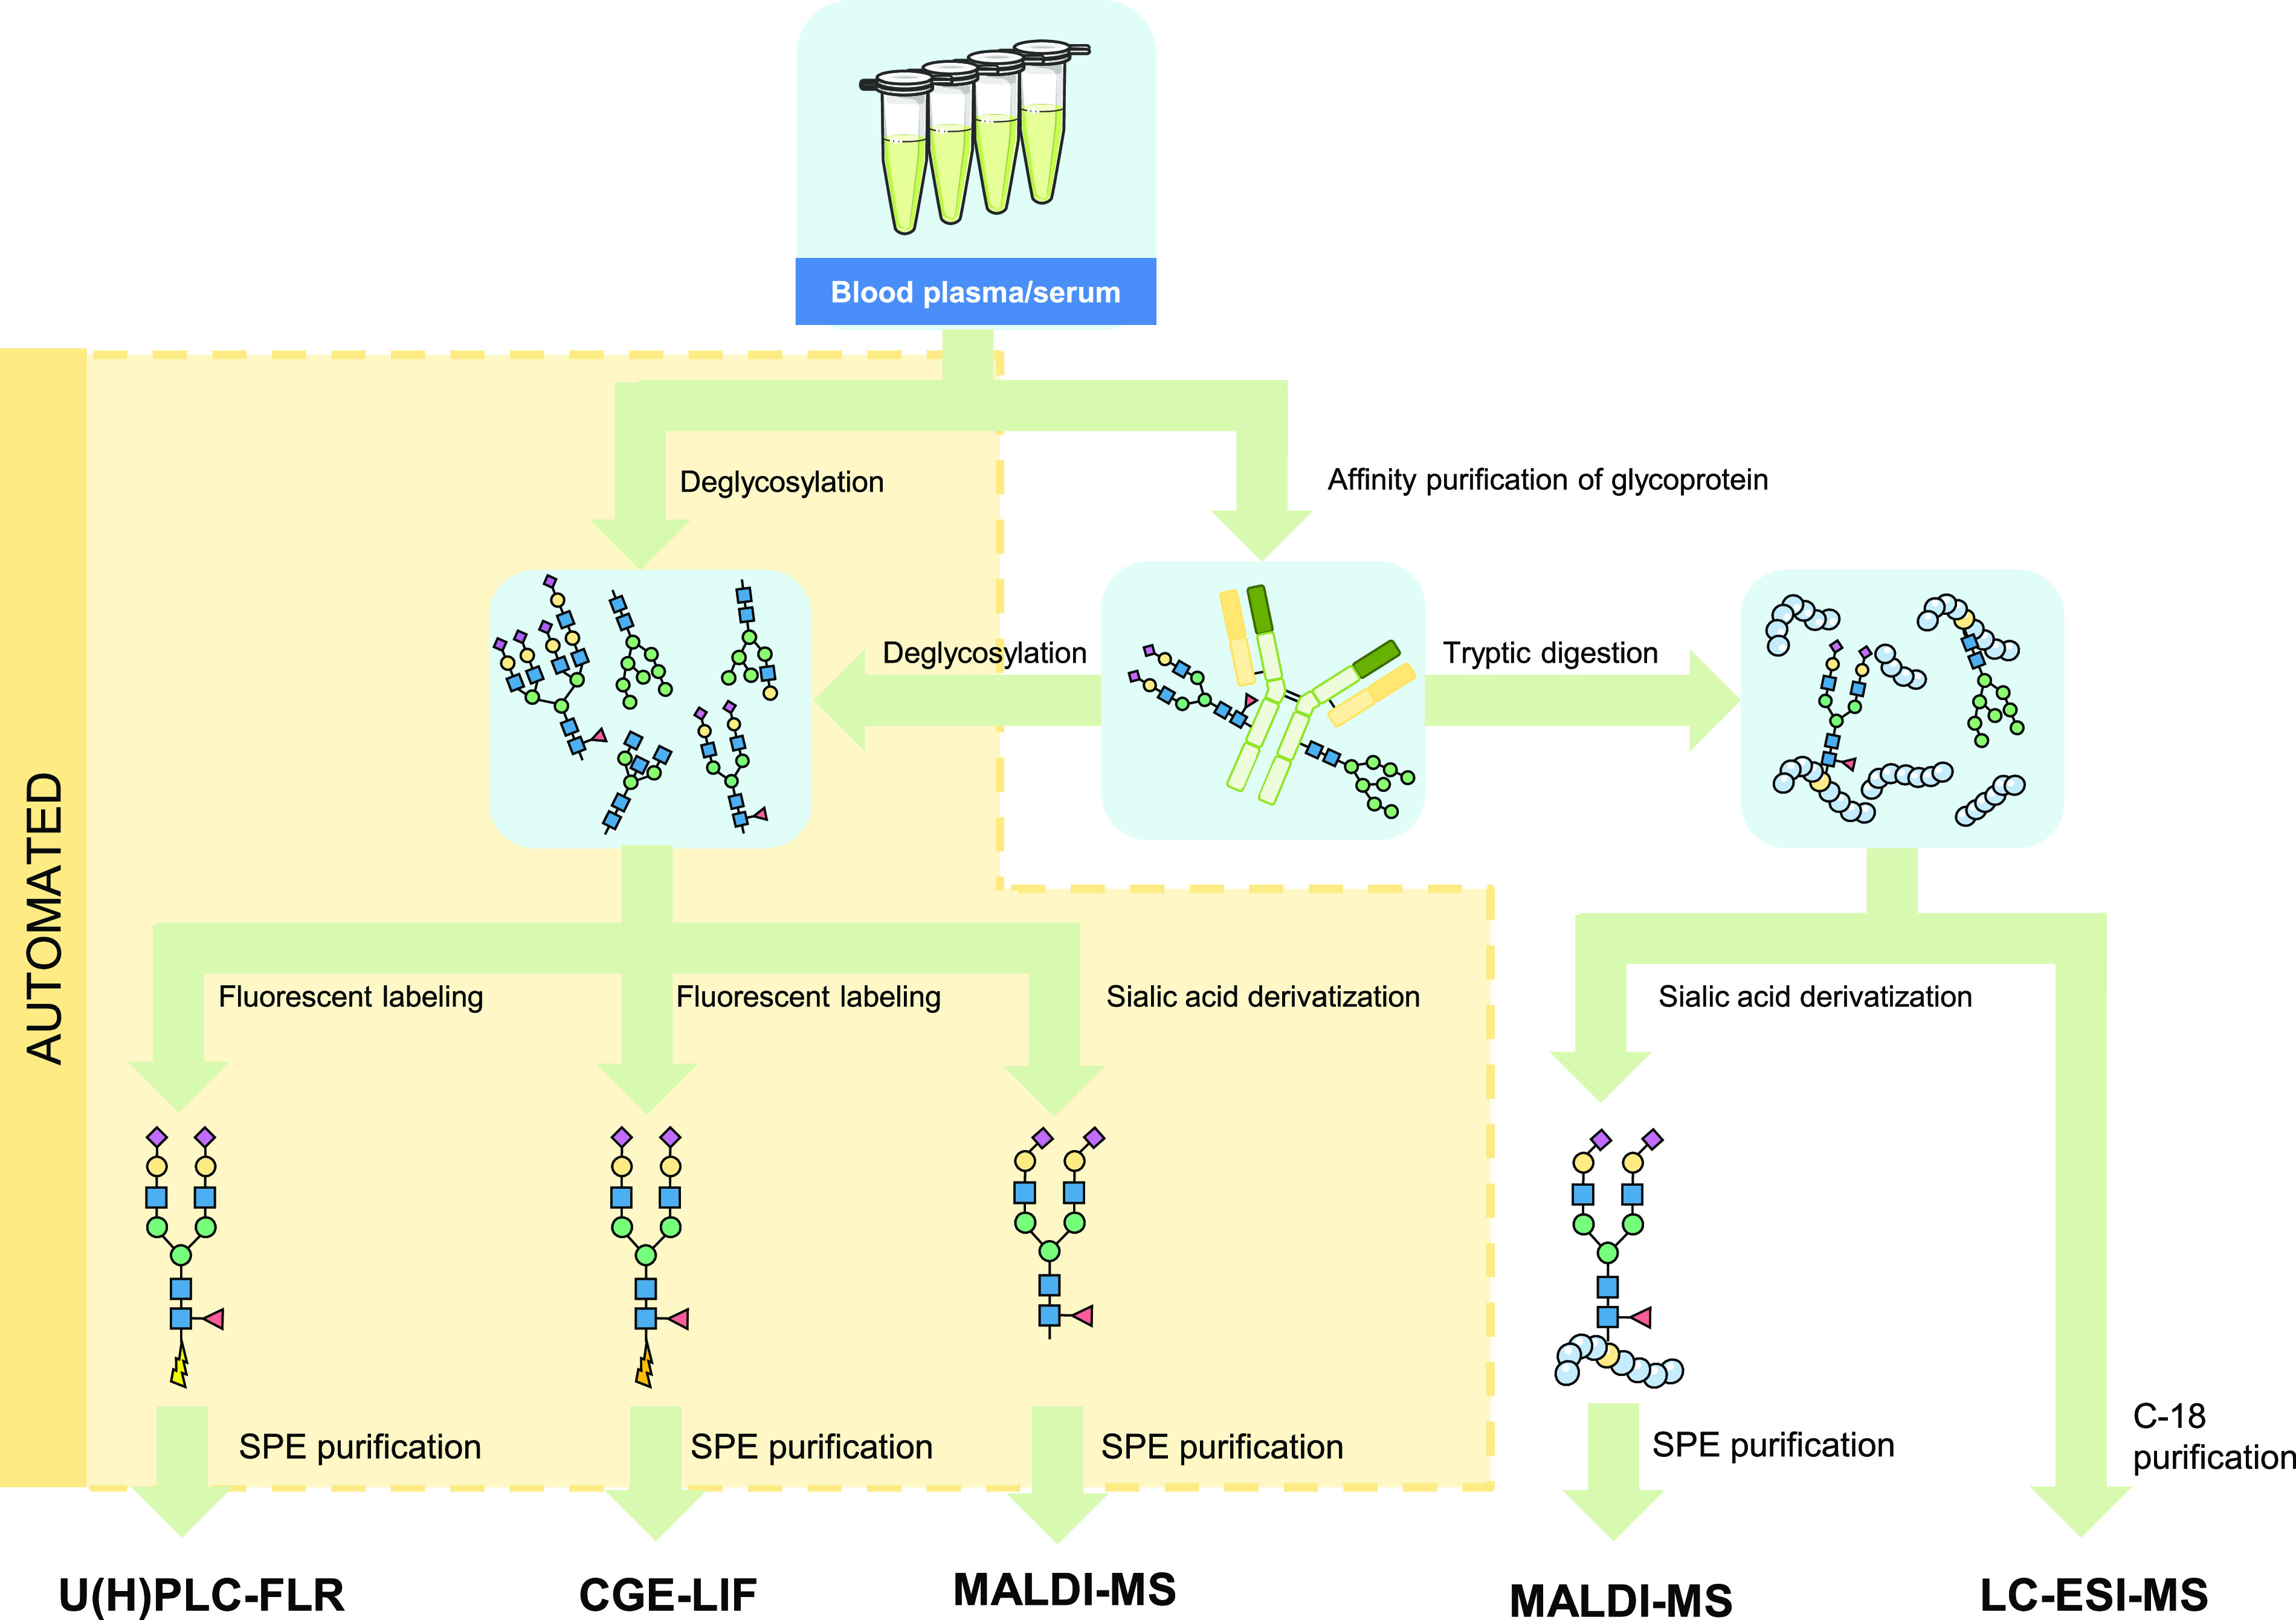
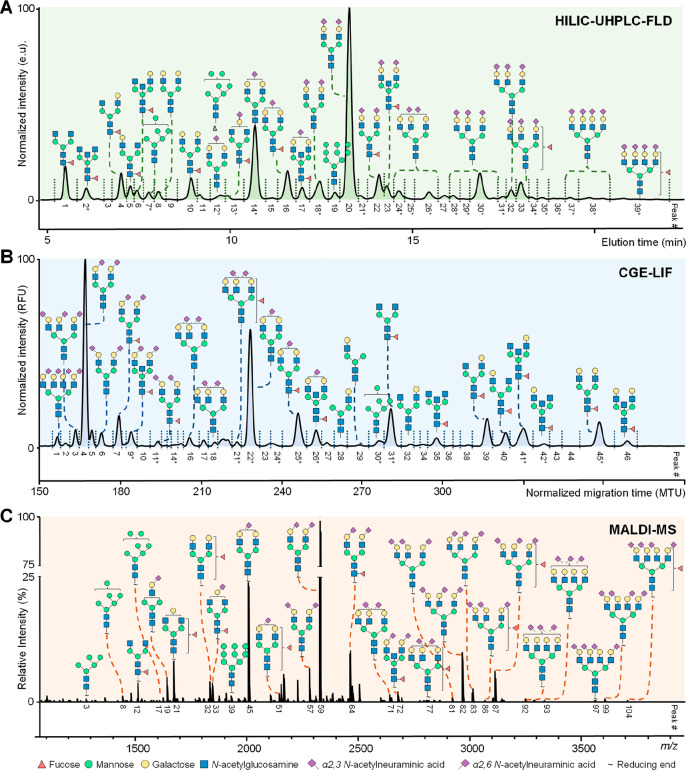
Glycomics aims to identify the structure and function of the glycome, the complete set of oligosaccharides (glycans), produced in a given cell or organism, as well as to identify genes and other factors that govern glycosylation. This challenging endeavor requires highly robust, sensitive, and potentially automatable analytical technologies for the analysis of hundreds or thousands of glycomes in a timely manner (termed high-throughput glycomics). This review provides a historic overview as well as highlights recent developments and challenges of glycomic profiling by the most prominent high-throughput glycomic approaches, with N-glycosylation analysis as the focal point. It describes the current state-of-the-art regarding levels of characterization and most widely used technologies, selected applications of high-throughput glycomics in deciphering glycosylation process in healthy and disease states, as well as future perspectives.


Conflict of interest statement

The authors declare the following competing financial interest(s): GL is the founder and owner of Genos Ltd, a private research organization that specializes in high-throughput glycomic analysis and has several patents in this field. IT-A, TP, and HD are employees of Genos Ltd.

Figures

Figure 1
Figure 1
(A) Various glycan classes exist such as glycosaminoglycans (GAGs), glycosphingolipids (GSLs), glycoRNA, free oligosaccharides, and glycoproteins. (B) A distinction can be made in various characterization categories of the latter glycan type. Namely, glycoproteins can be analyzed intact using a top-down method or a middle-up approach that can be used to study the subunits of (monoclonal) antibodies. Other methods include enzymatic digestions, which either cleave the protein into (glyco)peptides, also known as the bottom-up approach, or cleave the glycan portion from its conjugate (released glycan analysis). The latter two are currently the only characterization approaches that can be processed and analyzed in a HT manner. Several enzymes are available for GAGs which will result in disaccharides (indicated by the scissors), while enzymes available for GSL analysis will release the glycan headgroup from the lipid portion (indicated by the scissors).
Figure 2
Figure 2
Macro- versus microheterogeneity of a glycoprotein. (A) Macroheterogeneity is the diversity of (multiple) glycosylation sites on a single glycoprotein. (B) Microheterogeneity is the variety on a single glycosylation site, where various glycan structures can be found.
Figure 3
Figure 3
A diversity of different chemistries is available to enable glycan analysis. (A) The most common derivatization strategies applied on terminal sialic acids, enabling stabilization and, in regard to esterification or dimethylamidation, also identification of the different isomers based upon mass difference by MS. In regard to the dimethylamidation procedure, the reaction consists of two parts. In the first step, α2,3-linked sialic acids react with the adjacent galactose to form a lactone, and the α2,6-linked sialic acids form a stable dimethylamide. The second step involves the addition of ammonia, with the lactone undergoing aminolysis, thereby transforming the carboxylic acid into a stable amide. (B) Illustration how an N-glycan attached to a protein (via an asparagine) is cleaved using the enzyme PNGase F. (C) Common procedures that are performed at the reducing end of the glycan: fluorescence detection can be enabled by introducing a label with a fluorophore, or MS ionization can be improved by adding a permanent positive charge (e.g., hydrazide labeling) or introducing a tertiary amine (e.g., carbamate chemistry), which could also allow the simultaneous analysis of glycans from different samples through the incorporation of stable isotopes (e.g., TMT-labeling).
Figure 4
Figure 4
Historical overview of HT glycomic technologies applied for released N-glycan analysis.
Figure 5
Figure 5
A diversity of workflows are available for HT glycomic analysis. For the different derivatization and labeling procedures as well as specific labels, see Figures 3 and 7, respectively. Please note that the sialic derivatization step of the glycopeptides will also modify the peptide backbone.
Figure 6
Figure 6
Exemplary profiles of the total serum N-glycome using (A) HILIC-UHPLC-FLD, (B) CGE-LIF, and (C) MALDI-MS. (A) Chromatogram after 2-AB labeling by HILIC-UHPLC-FLD. (B) Electropherogram after APTS labeling by CGE-LIF. (C) Mass spectrum after differential sialic acid esterification by MALDI-FT-ICR-MS. The assigned signals in the MS spectra correspond to [M + Na]+. Please note that HILIC-UHPLC-FLD and CGE-LIF provide (in some cases) isomer separation in regard to branching (galactose arm, bisection, and fucose position). Structures are assigned based on exoglycosidase treatment and/or tandem MS data as well as literature knowledge on biosynthetic pathway of N-glycans. *Some signals for the HILIC-UHPLC-FLD and CGE-LIF correspond to multiple N-glycan compositions for which the most abundant one is assigned in the figure.
Figure 7
Figure 7
A diversity of commonly used labels that can be attached to the reducing end of the glycan. Labeling is performed to enable fluorescence detection (all labels), to improve retention on RP-LC-FLD (2-AA, 2-AB, and 2-PA), to enable separation by introducing a negative charge for CGE-LIF (APTS, ANTS, 2-AA, or 2-PA), or to enhance MS ionization by introducing a tertiary amine through carbamate chemistry (InstantPC, RapiFluor-MS, ProA). 2-AB, 2-AA, and 2-PA can also be used as reactive MALDI matrices as these labels absorb UV light that is in the wavelength range of most common MALDI lasers (330–360 nm).
Figure 8
Figure 8
Exoglycosidase digestions of 2-AB labeled human plasma transferrin (Tf) N-glycans. (i) Undigested samples. (ii) Streptococcus pneumoniae α2–3 neuraminidase S. (iii) Arthrobacter ureafaciens α2-3,6,8,9 neuraminidase A (SIA). (iv) Streptococcus pneumoniae β1–4 galactosidase S (GAL) + SIA. (v) Streptococcus pneumoniae β-N-acetylglucosaminidase S (GlcNAc) + GAL + SIA. (vi) Omnitrophica bacterium α1-2,4,6 fucosidase O (FUC) + GlcNAc + Gal + SIA.
Figure 9
Figure 9
Multiplexed sample preparation workflow for N- and O-glycan profiling. Intra- and interday repeatability of the optimized method. (A) Proteins are immobilized on a polyvinylidene fluoride (PVDF) membrane by the addition of a (pure) glycoprotein, cell lysates, or derived from biological material (e.g., plasma). N-Glycans are released by the addition of PNGase F and eluted from the PVDF membrane. The O-glycans are released by adding a release agent and eluted from the PVDF membrane followed by a labeling procedure (2-AB). Eventually, the samples were analyzed using C18 nano-LC-MS/MS followed by data analysis. (B) Inter- and intraday repeatability of the O-glycan workflow. Average relative intensities for the O-glycans are displayed for those with a relative abundance above 1% per day. Error bars represent the standard deviations. Graphics in (A) were created using https://biorender.com/: H, hexose; N, N-acetylhexosamine; F, fucose; S, N-acetylneuraminic acid. Reproduced with permission from ref (24). Copyright 2022 de Haan et al.
Figure 10
Figure 10
Automation of released N-glycan analysis by MALDI-TOF-MS. A graphical representation of the setup is provided and the consecutive processing steps are as follows: (1) PNGase F release, (2) ethyl esterification, (3) glycan enrichment by hydrophilic polypropylene (GH Polypro, GHP) HILIC–SPE, (4) glycans are eluted from the GHP membrane, and (5) MALDI target spotting followed by (6) MALDI-TOF–MS analysis. Reprinted with permission from ref (193). Copyright 2015 American Chemical Society.
Figure 11
Figure 11
Results of the HT and site-specific N-glycosylation LC-MS analysis of human AGP. (A) Typical chromatogram with extracted ion traces of the most abundant glycopeptides from each glycosylation site. Trifluoroacetic acid was used in the mobile phase as an ion-pairing agent. (B) Summed mass spectrum for glycopeptide I1 with the most abundant glycan structures annotated. (C) MS/MS fragmentation spectrum for the peptide part of glycopeptide I1 with glycan composition N5H6S3. (D) MS/MS fragmentation spectrum for the glycan part of glycopeptide I1 N5H6S3. Reproduced with permission from ref (20). Copyright 2022 Keser et al. under the CC BY license (http://creativecommons.org/licenses/by/4.0/).
Figure 12
Figure 12
Glycan microarray analysis. A graphical representation of a glycan microarray workflow, the consecutive processing steps are as follows: (1) glycoprotein is labeled with a fluorescent tag through Cy3 labeling, (2) the glycoprotein binds at the lectin microarray based upon the presented lectin on the microarray, and (3) the microarray is scanned, followed by (4) the interpretation of the signals.
Figure 13
Figure 13
Workflow for data (pre)processing and analysis. The various steps (1–8) involve preprocessing of raw data into clean data. Eventually, the data is normalized, and each analyte will be relatively quantified based upon the total summed area of all analytes observed in a measurement (%area), also known as direct glycosylation traits. To obtain insights in the biosynthetic pathway specific glycosylation features can be summed (e.g., galactosylation, sialylation, fucosylation). Either the direct or derived glycosylation traits can be used for statistical evaluation and the whole data set can be integrated with other data sets (e.g., proteomics or genomics).
Figure 14
Figure 14
RP-LC-MS separation of tryptic Fc glycopeptides of a polyclonal serum IgG standard. (A) Extracted ion chromatograms (EIC) of the most abundant Fc glycopeptides per IgG subclass from polyclonal human serum IgG. The separation is mainly driven by the hydrophobicity of the peptide backbone and separate clusters are obtained where all glycoforms of a specific subclass elute. (B) Illustration of a summed mass spectrum of the cluster containing IgG Fc glycopeptides from subclass IgG1. Only the mass range of the triply charged species is displayed. IgG1 = EEQYNSTYR; IgG2/3 = EEQFNSTFR; IgG4 = EEQFNSTYR.
Figure 15
Figure 15
Representative MALDI-TOF-MS spectrum of permethylated HMOs. All masses correspond to fully permethylated, free reducing end, sodium adducts of HMOs. Possible structures for each mass are shown. Free lactose was excluded from the spectrum. HMOs were identified using GlycoMod. Reproduced with permission from ref (16). Copyright 2020 Oxford University Press.
Figure 16
Figure 16
Relative quantitative evaluation of MS-based method performance in the analysis of therapeutic IgG Fc glycosylation. Each analytical method was applied in a batch of six replicates (the first set taken from the data set). Error bars represent the standard deviation. G1[H4N4] was not quantified for the ESI-MS after IdeS method. M6[H6N2], G1FS[H4N4FS1], and G2S1F [H5N4FF1S1] were not quantified for the analysis of glycopeptides in positive and negative ionization mode using MALDI-MS. All other missing bar graphs indicate those species were not detected with that specific method. Key: H, hexose; N, N-acetylhexosamine; F, deoxyhexose; S, N-acetylneuraminic acid (sialic acid); G0F-N, agalactosylated, core-fucosylated, monoantennary species. Data was obtained from ref (394) Copyright 2015 Reusch, et al.

References

    1. Flynn R. A.; Pedram K.; Malaker S. A.; Batista P. J.; Smith B. A. H.; Johnson A. G.; George B. M.; Majzoub K.; Villalta P. W.; Carette J. E.; et al. Small RNAs Are Modified with N-Glycans and Displayed on the Surface of Living Cells. Cell 2021, 184, 3109–3124. 10.1016/j.cell.2021.04.023. - DOI - PMC - PubMed
    1. Kristic J.; Zaytseva O. O.; Ram R.; Nguyen Q.; Novokmet M.; Vuckovic F.; Vilaj M.; Trbojevic-Akmacic I.; Pezer M.; Davern K. M.; et al. Profiling and Genetic Control of the Murine Immunoglobulin G Glycome. Nat. Chem. Biol. 2018, 14, 516–524. 10.1038/s41589-018-0034-3. - DOI - PubMed
    1. Seeling M.; Bruckner C.; Nimmerjahn F. Differential Antibody Glycosylation in Autoimmunity: Sweet Biomarker or Modulator of Disease Activity?. Nat. Rev. Rheumatol. 2017, 13, 621–630. 10.1038/nrrheum.2017.146. - DOI - PubMed
    1. Gudelj I.; Lauc G.; Pezer M. Immunoglobulin G Glycosylation in Aging and Diseases. Cell Immunol. 2018, 333, 65–79. 10.1016/j.cellimm.2018.07.009. - DOI - PubMed
    1. Shields R. L.; Lai J.; Keck R.; O’Connell L. Y.; Hong K.; Meng Y. G.; Weikert S. H.; Presta L. G. Lack of Fucose on Human IgG1 N-Linked Oligosaccharide Improves Binding to Human Fcgamma RIII and Antibody-Dependent Cellular Toxicity. J. Biol. Chem. 2002, 277, 26733–26740. 10.1074/jbc.M202069200. - DOI - PubMed

Publication types

Substances