. 2022 Aug 8;32(15):3334-3349.e6.
doi: 10.1016/j.cub.2022.06.031. Epub 2022 Jul 6.

Structured sampling of olfactory input by the fly mushroom body

Affiliations

Structured sampling of olfactory input by the fly mushroom body

Zhihao Zheng et al. Curr Biol. .

Abstract

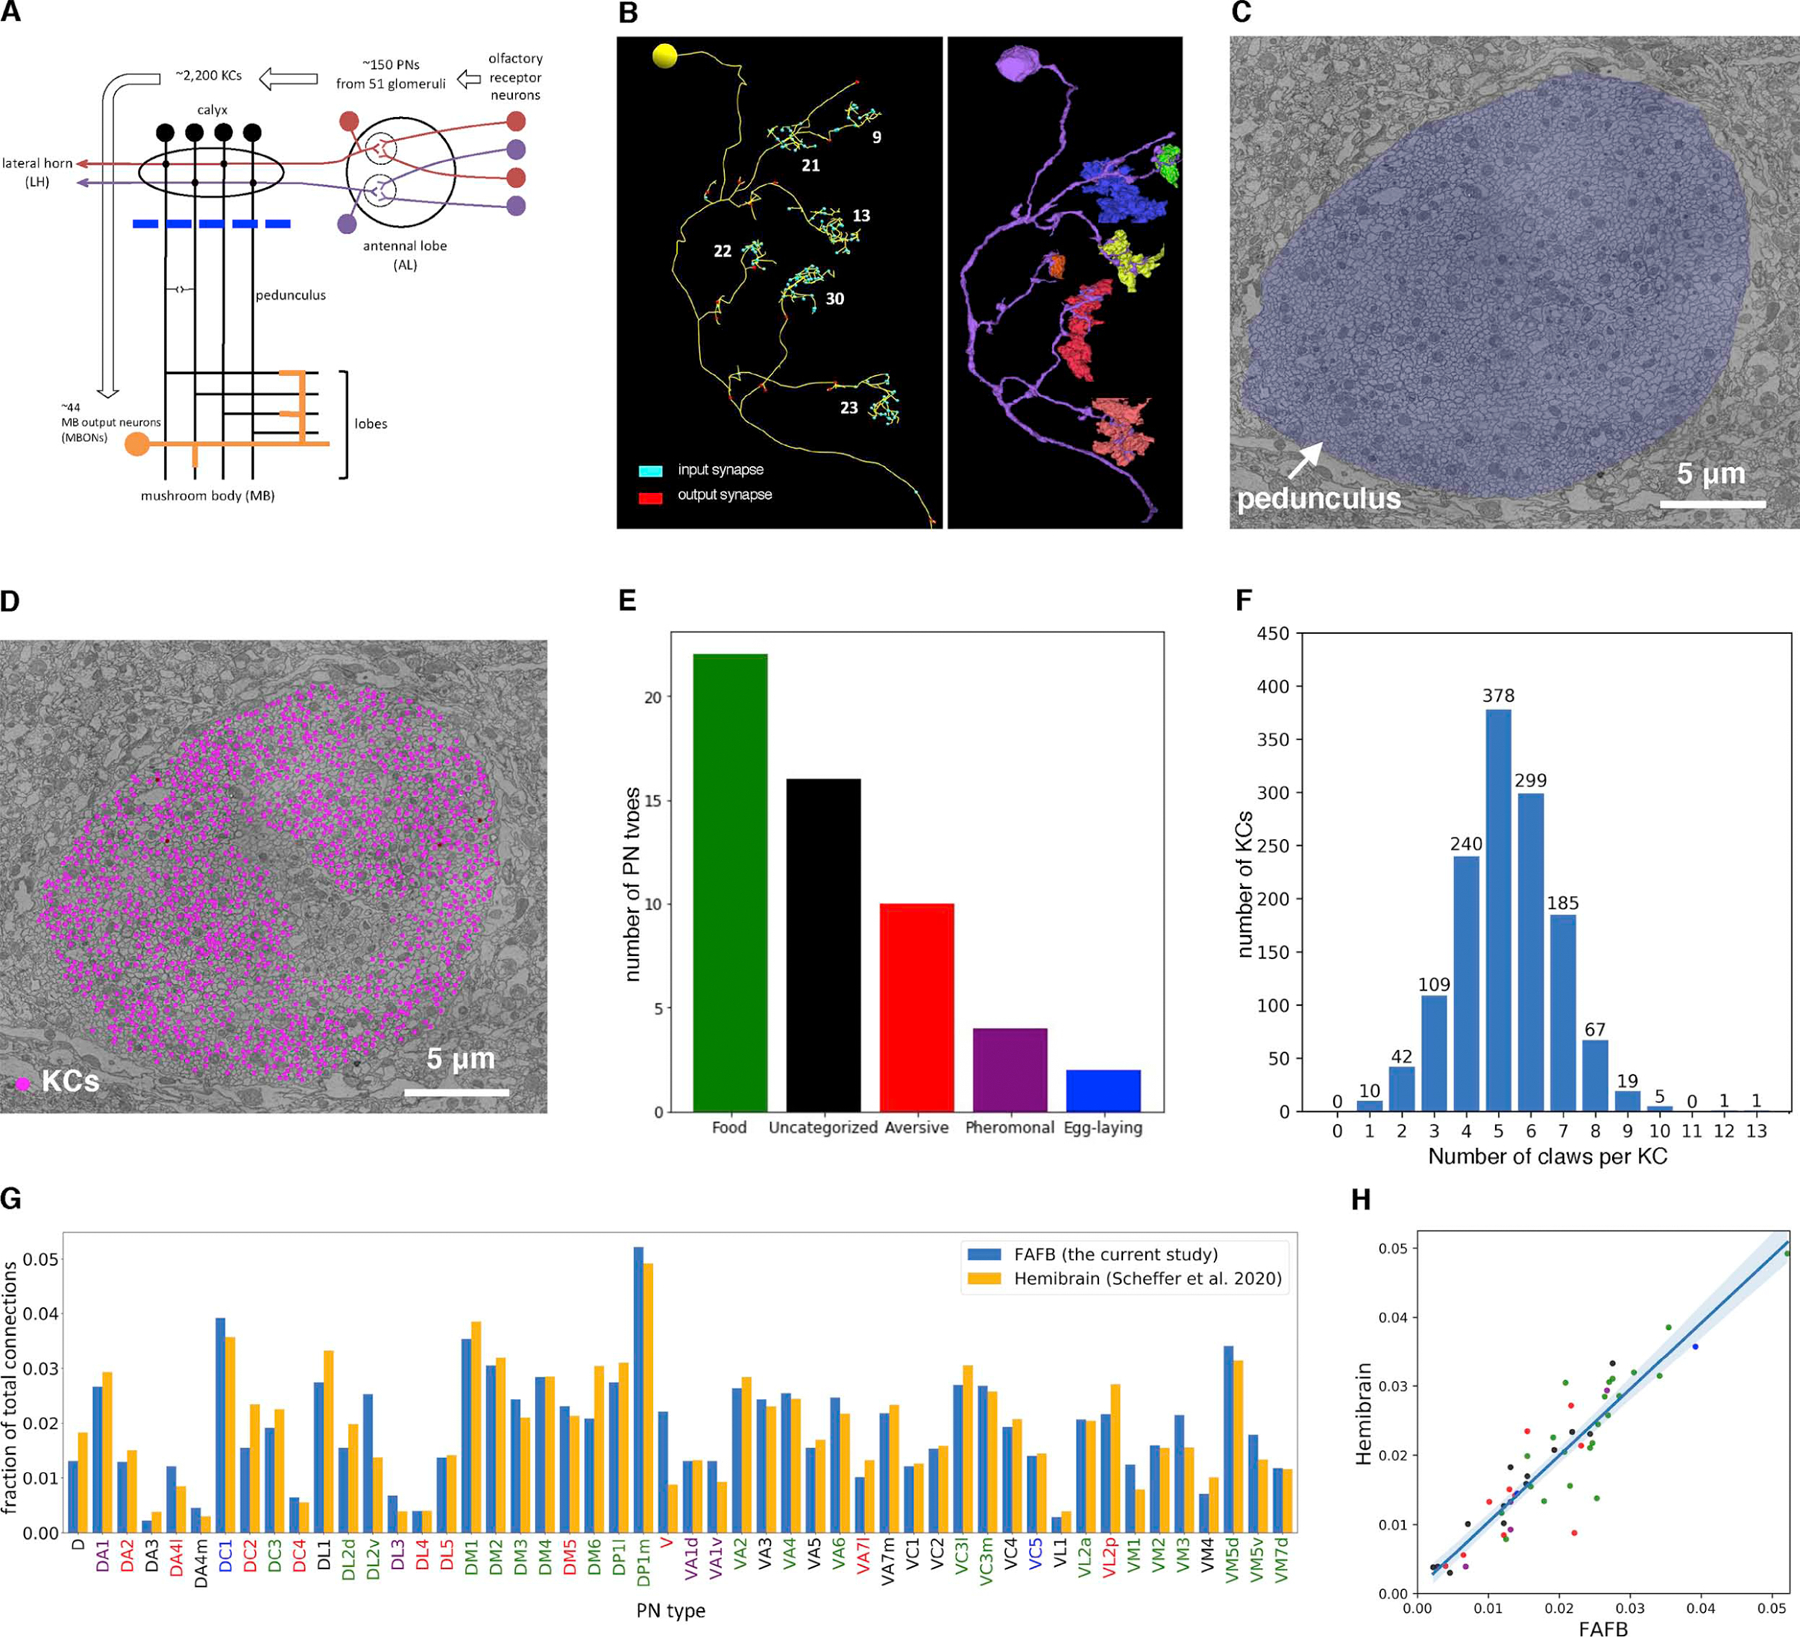
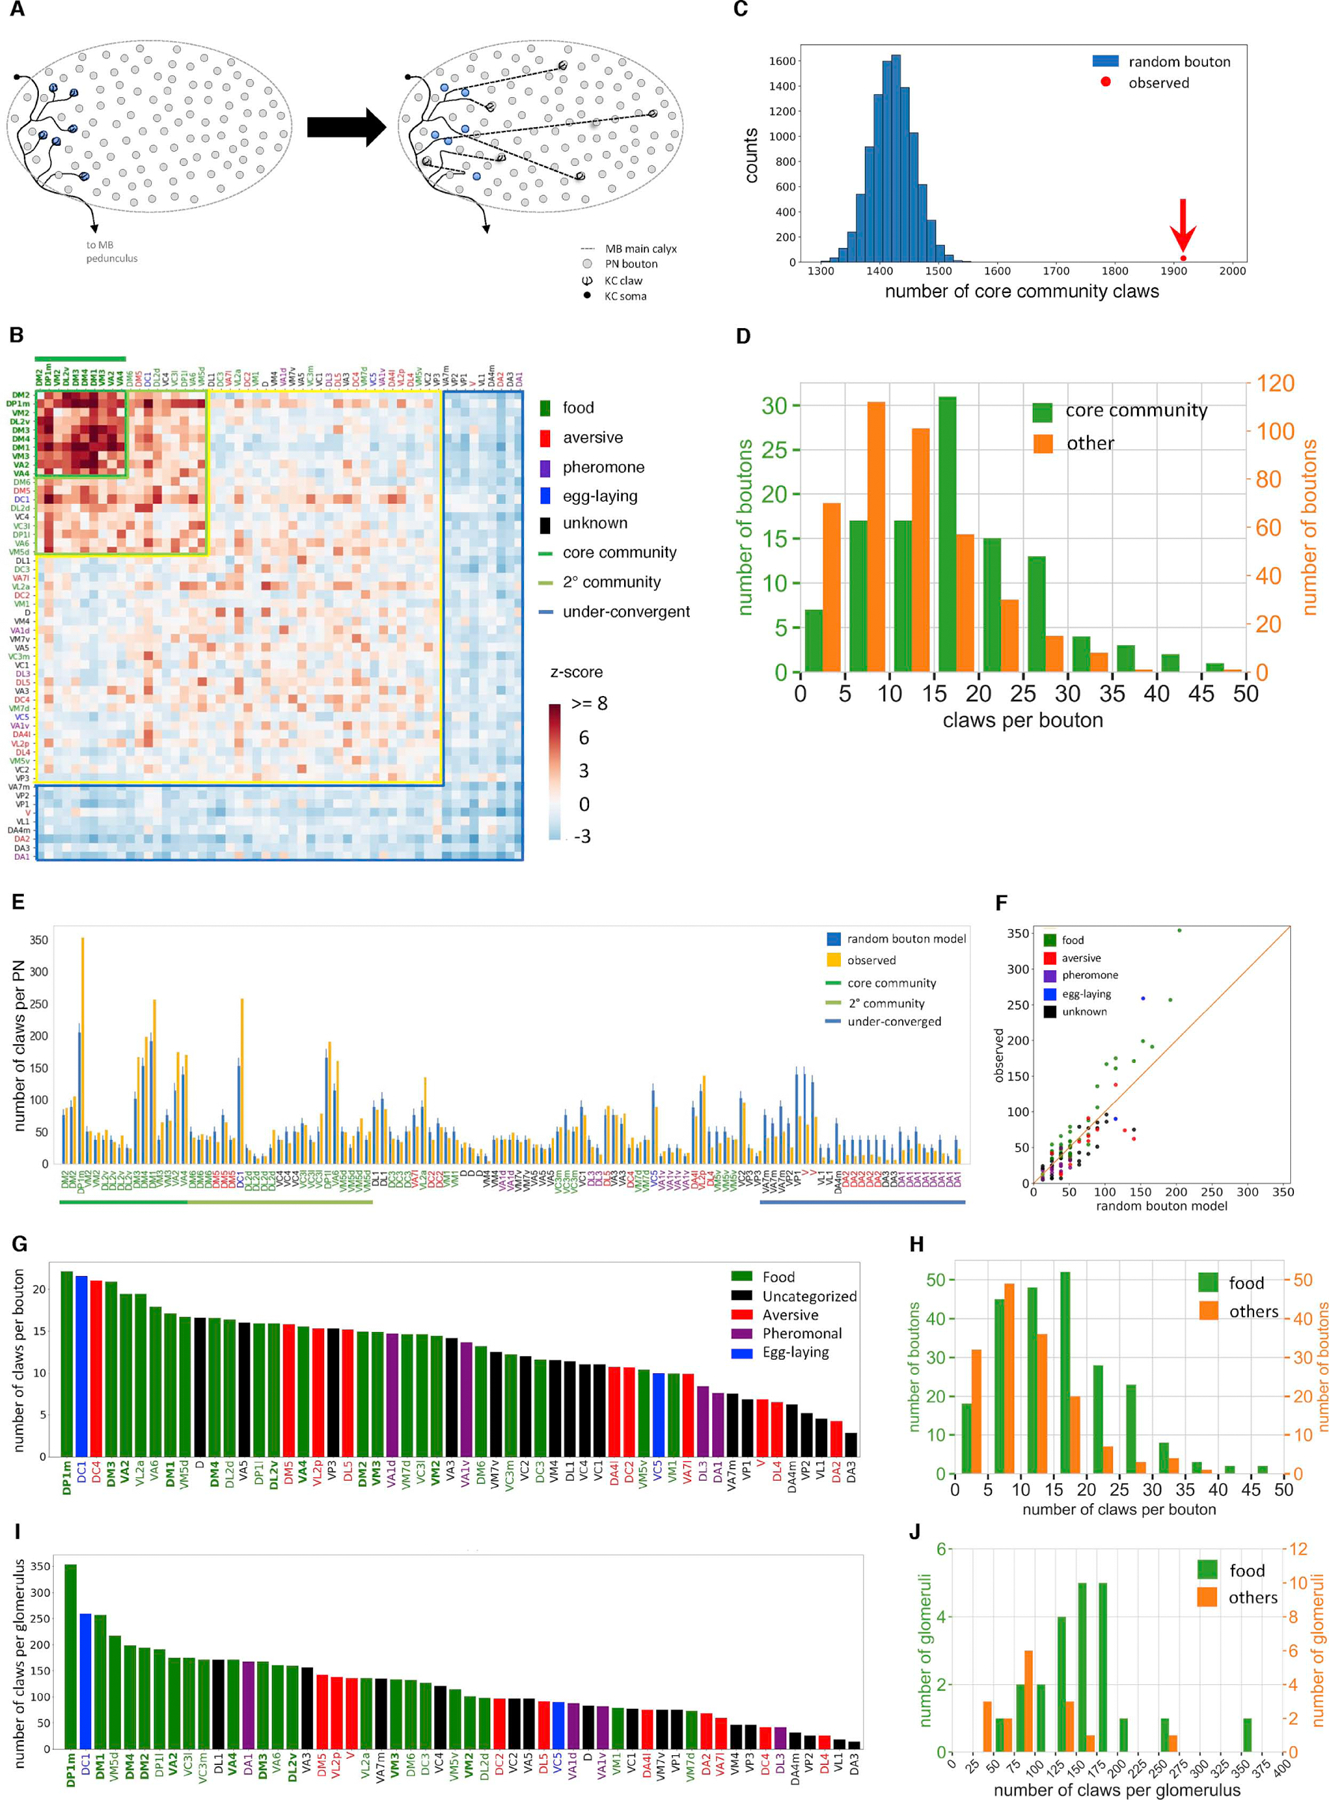
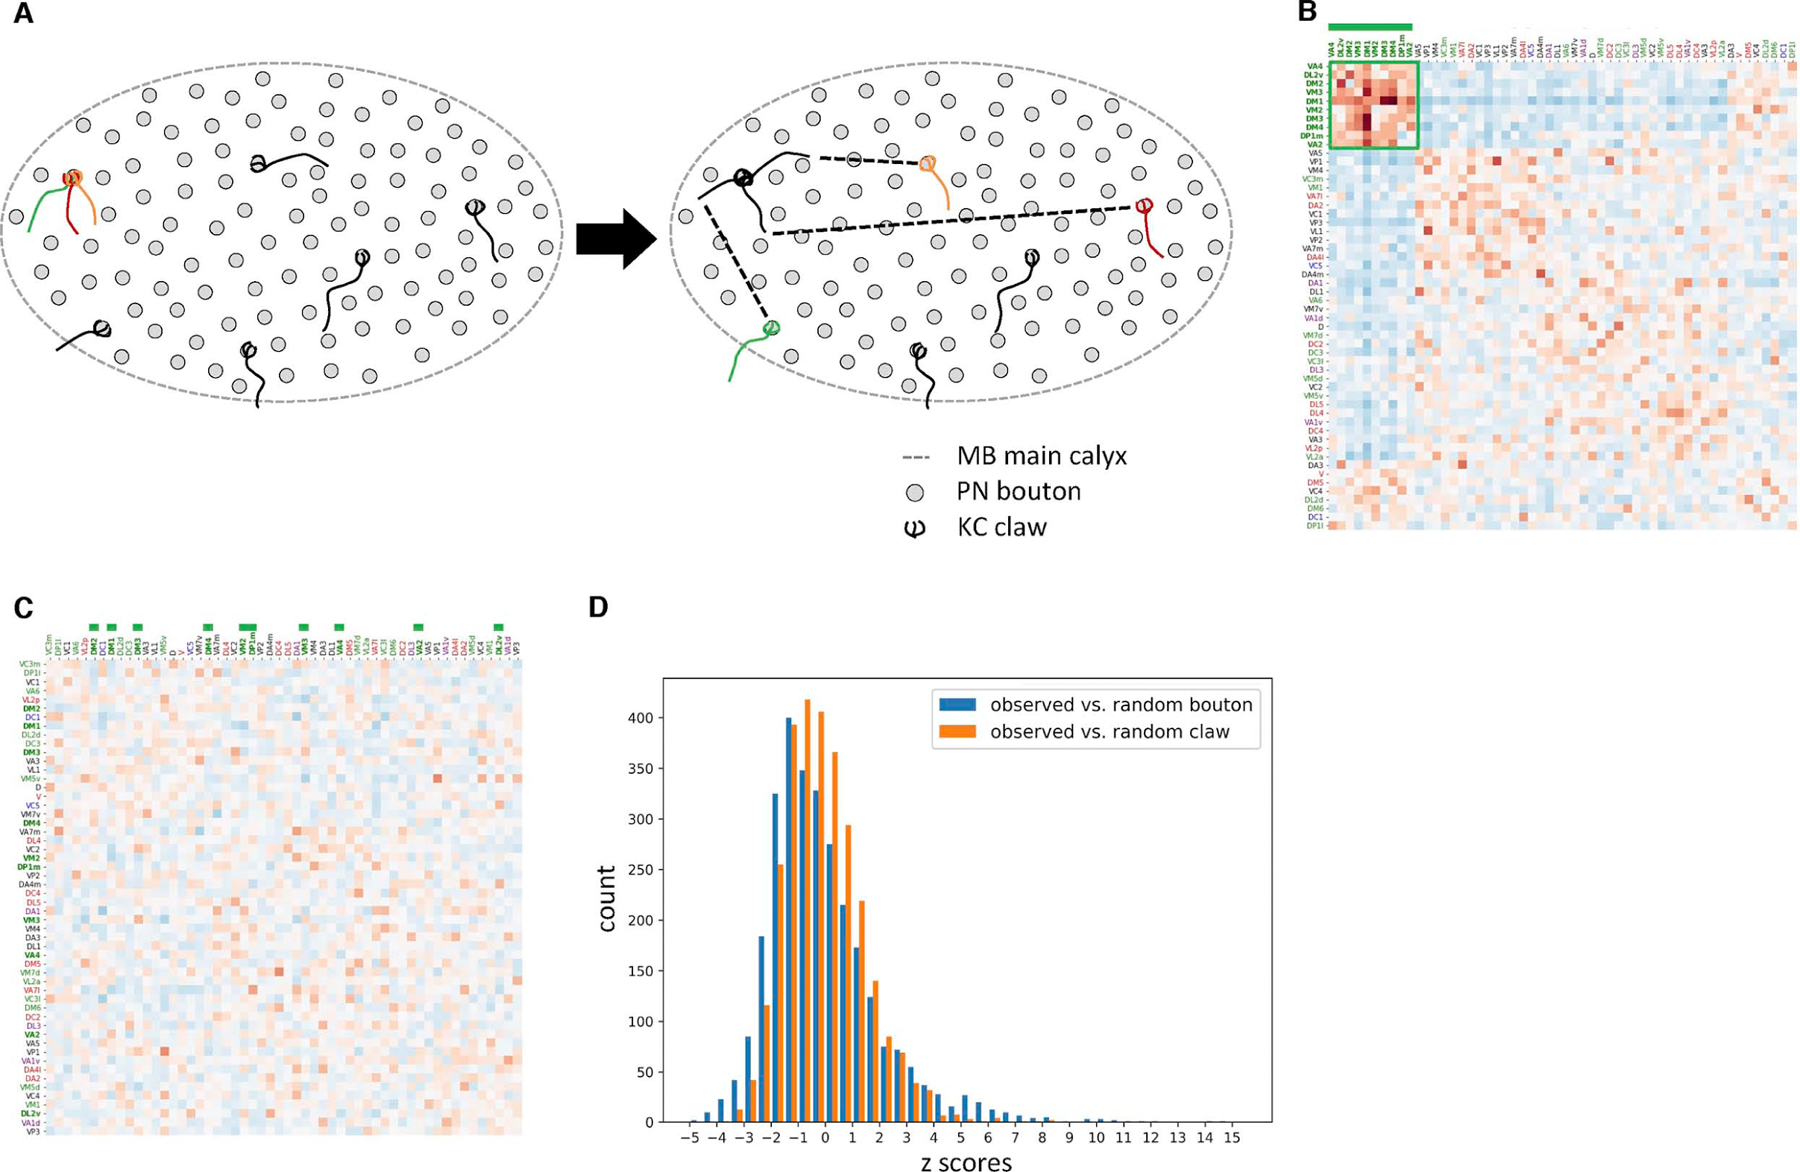
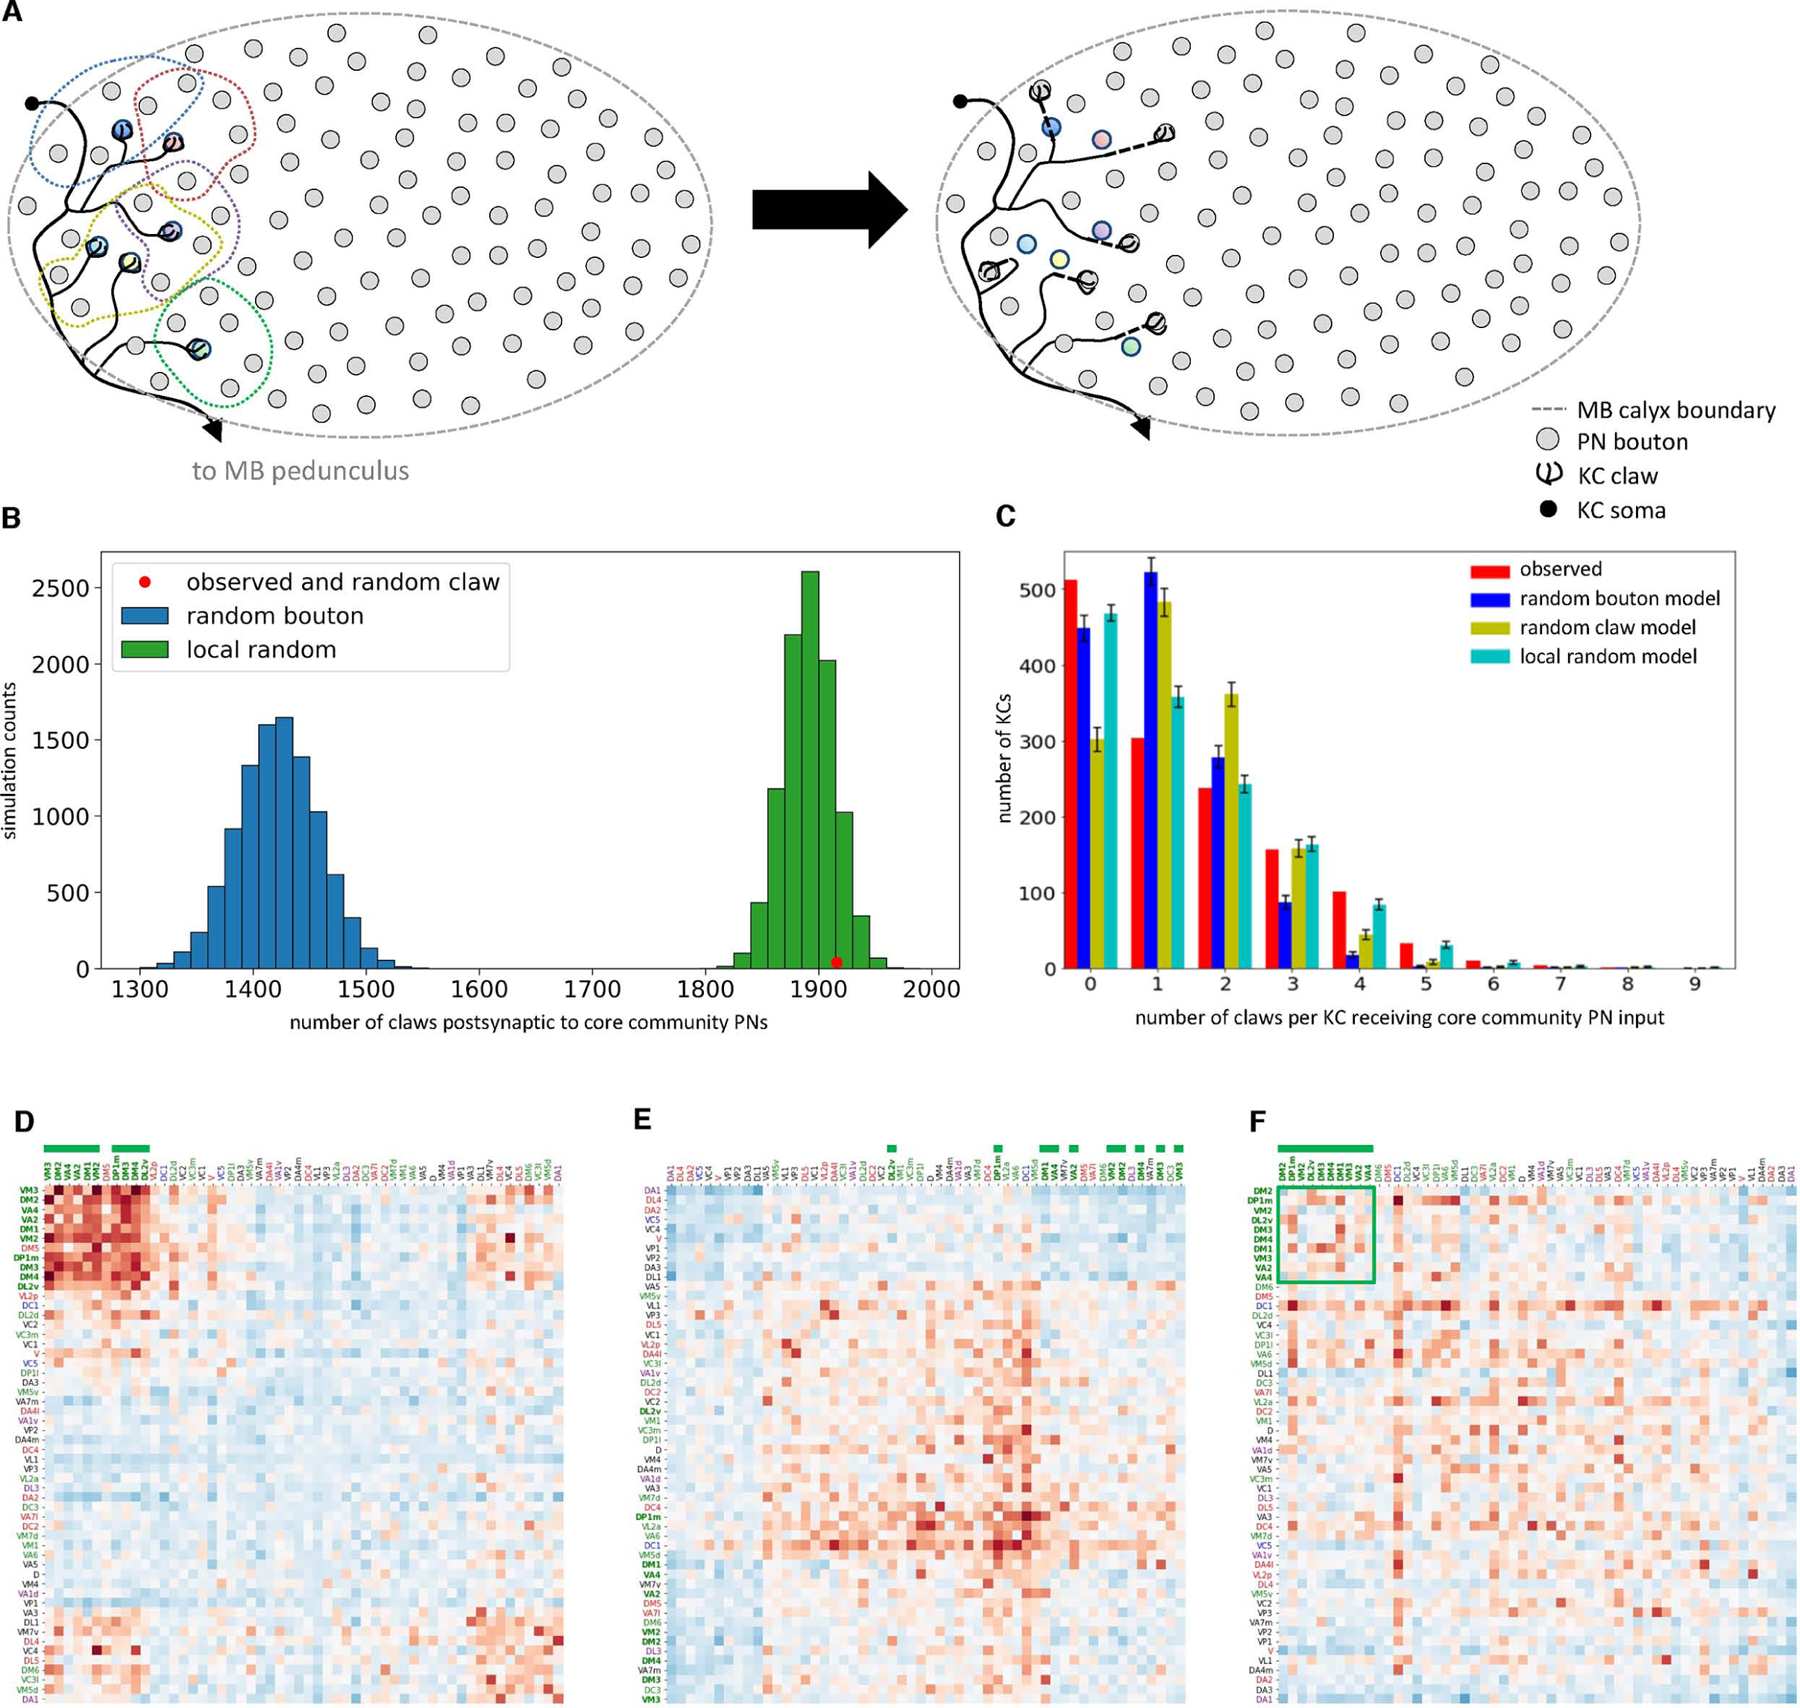
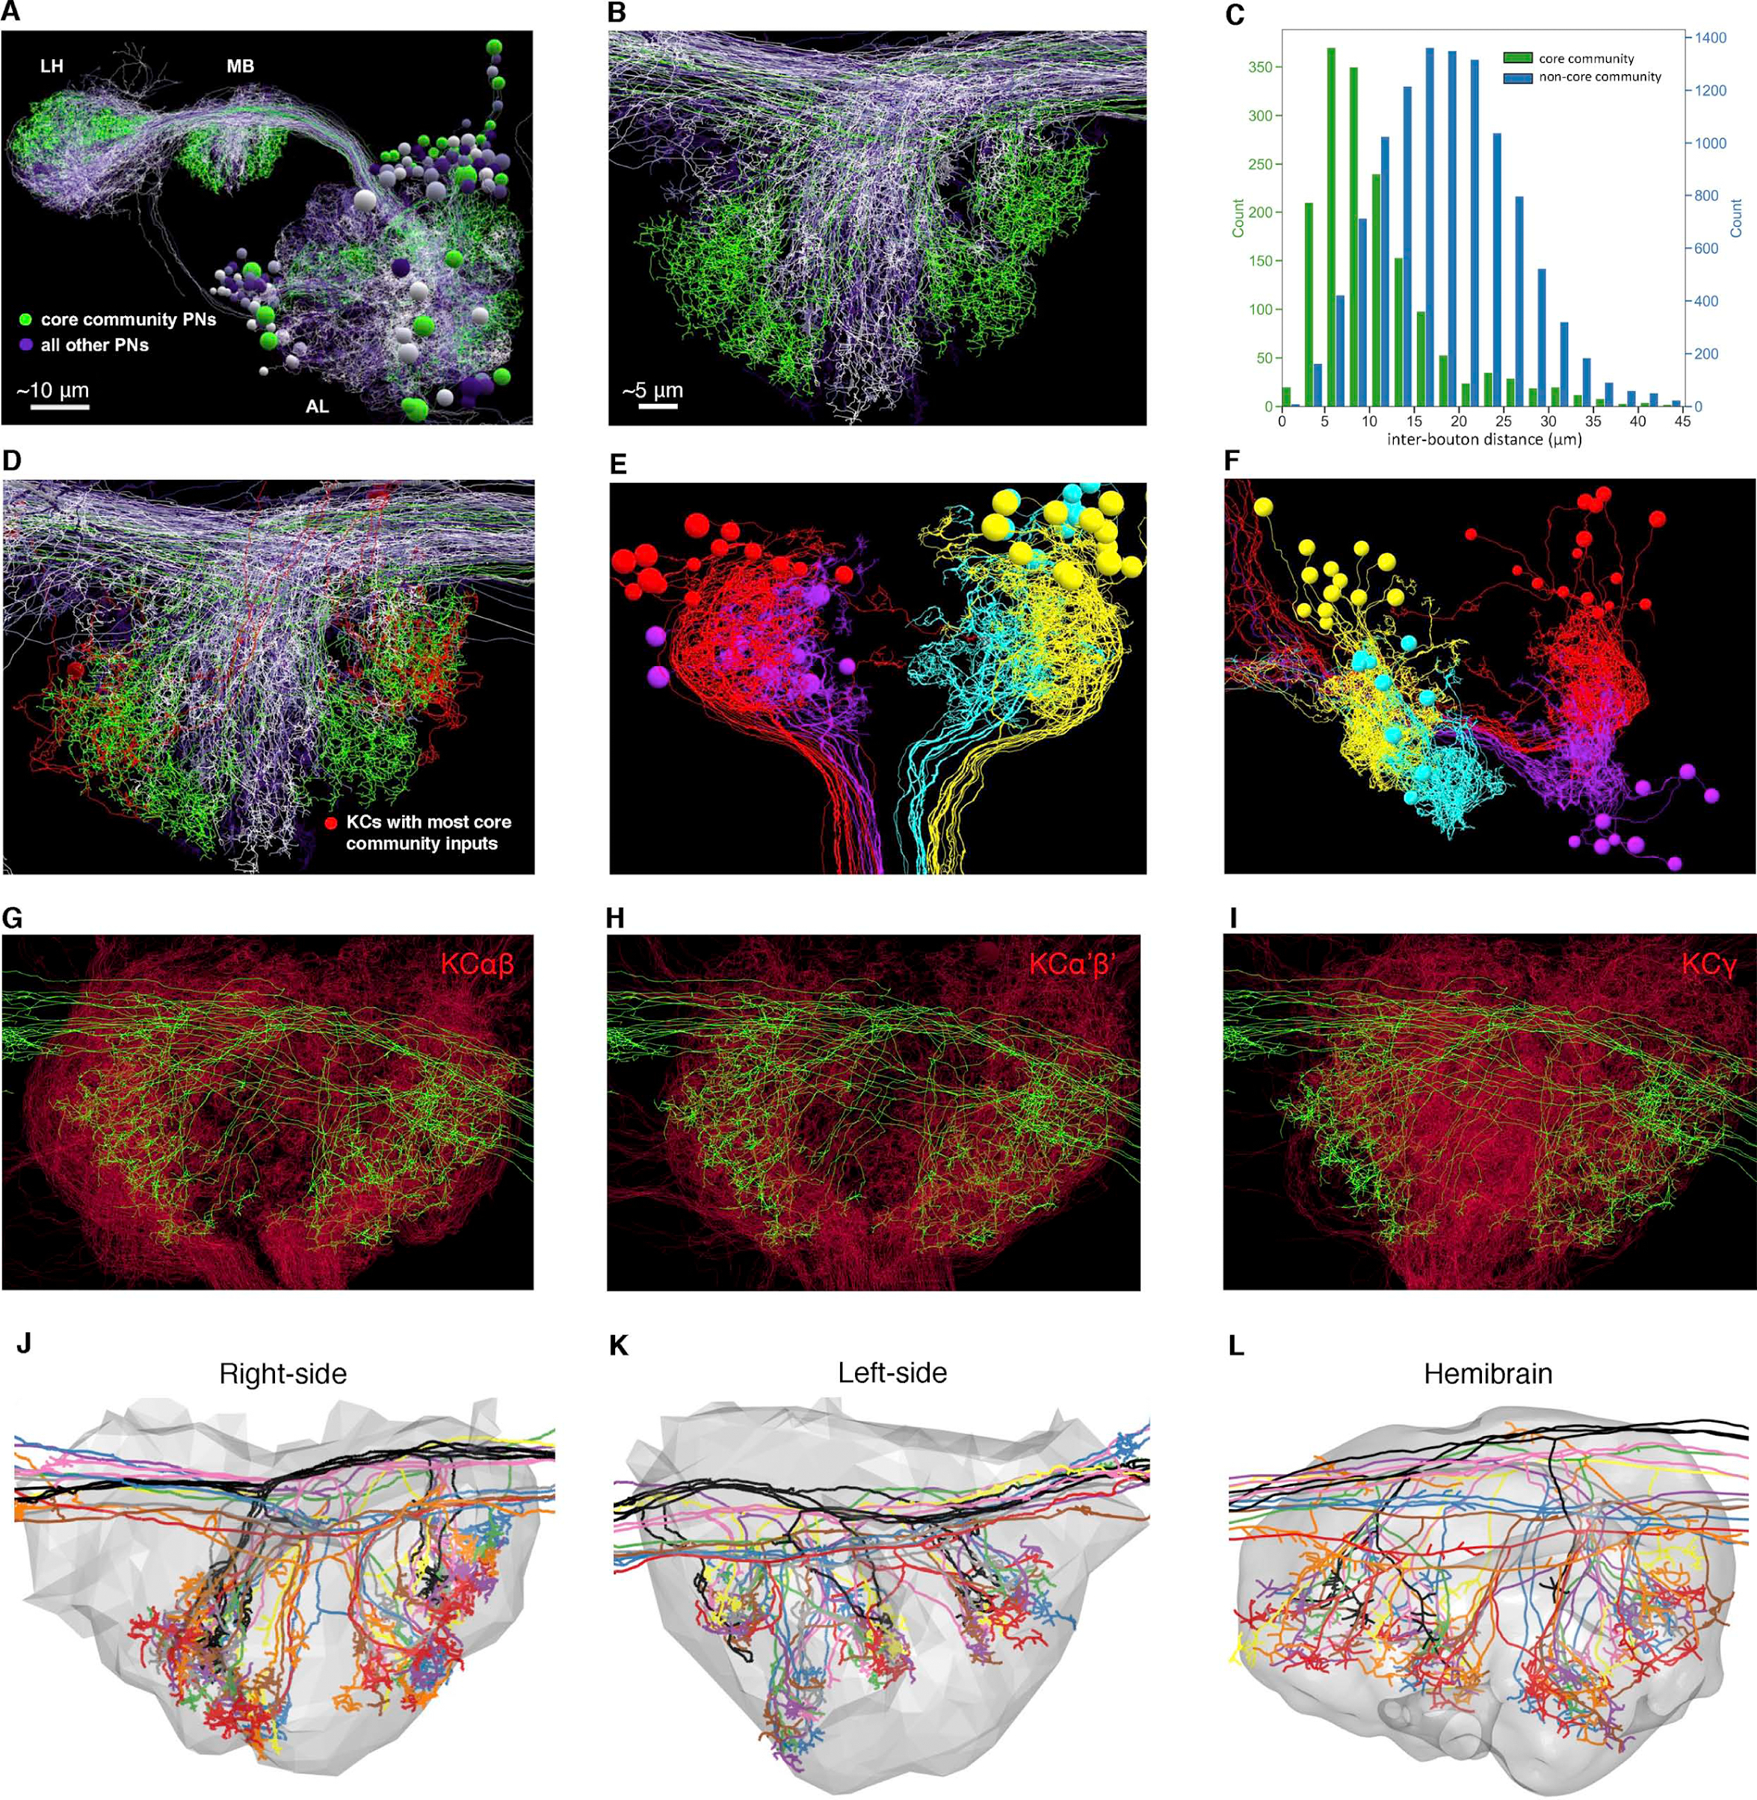
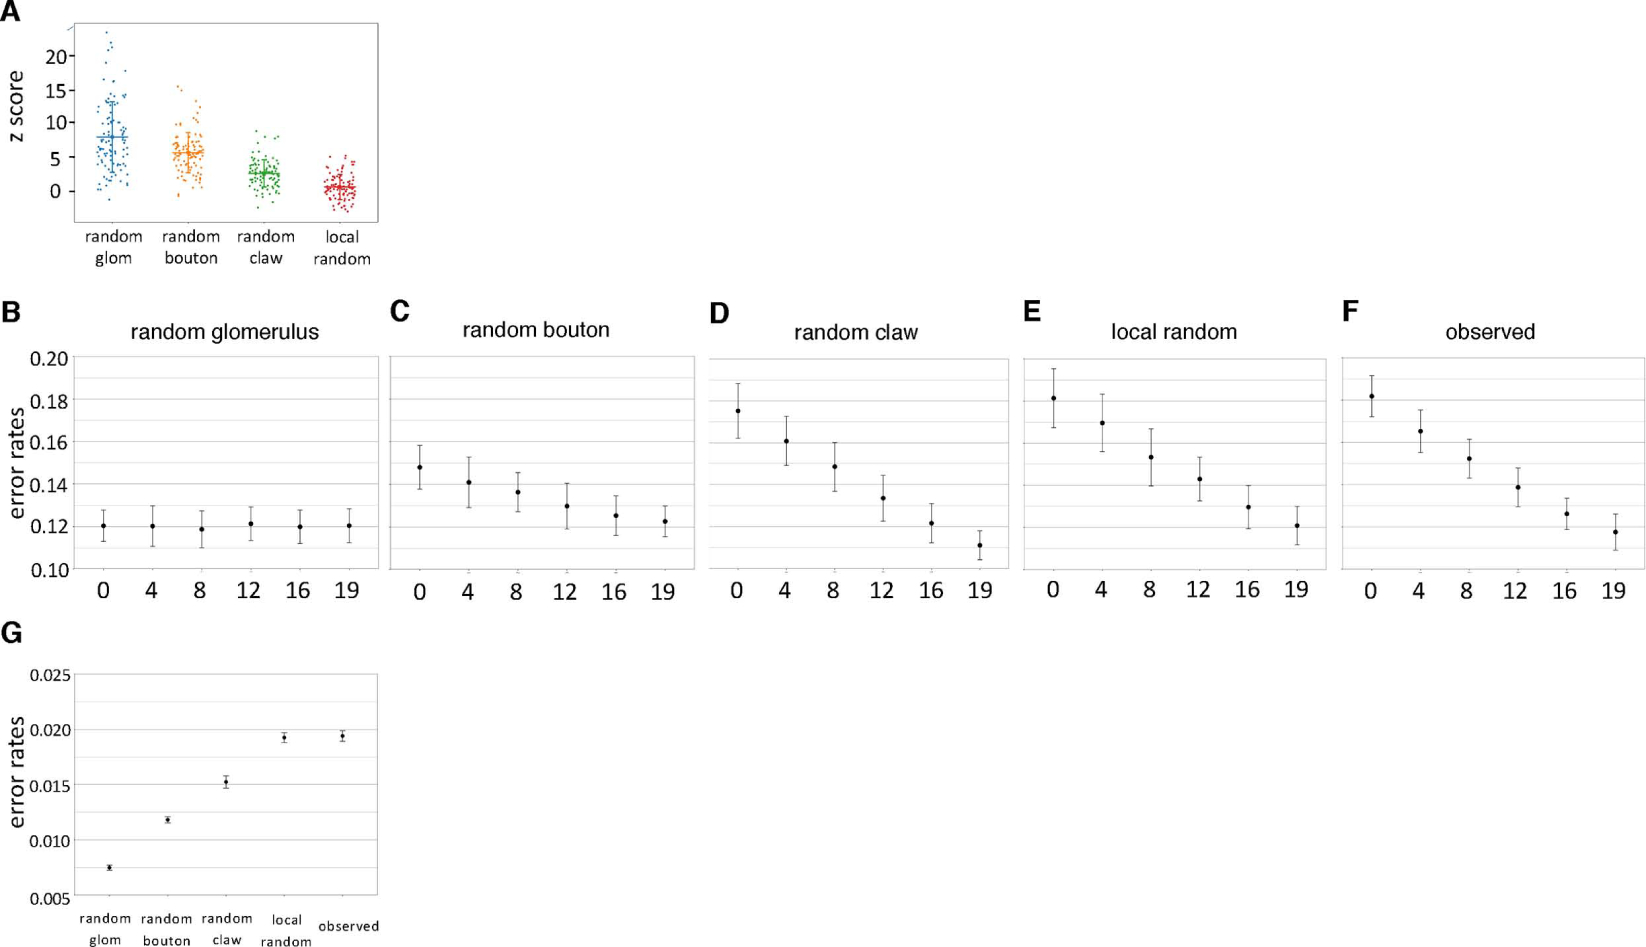
Associative memory formation and recall in the fruit fly Drosophila melanogaster is subserved by the mushroom body (MB). Upon arrival in the MB, sensory information undergoes a profound transformation from broadly tuned and stereotyped odorant responses in the olfactory projection neuron (PN) layer to narrowly tuned and nonstereotyped responses in the Kenyon cells (KCs). Theory and experiment suggest that this transformation is implemented by random connectivity between KCs and PNs. However, this hypothesis has been challenging to test, given the difficulty of mapping synaptic connections between large numbers of brain-spanning neurons. Here, we used a recent whole-brain electron microscopy volume of the adult fruit fly to map PN-to-KC connectivity at synaptic resolution. The PN-KC connectome revealed unexpected structure, with preponderantly food-responsive PN types converging at above-chance levels on downstream KCs. Axons of the overconvergent PN types tended to arborize near one another in the MB main calyx, making local KC dendrites more likely to receive input from those types. Overconvergent PN types preferentially co-arborize and connect with dendrites of αβ and α'β' KC subtypes. Computational simulation of the observed network showed degraded discrimination performance compared with a random network, except when all signal flowed through the overconvergent, primarily food-responsive PN types. Additional theory and experiment will be needed to fully characterize the impact of the observed non-random network structure on associative memory formation and recall.

Keywords: Drosophila melanogaster; Kenyon cell; connectomics; electron microscopy; memory; mushroom body; neural circuit; neuroanatomy; olfaction; projection neuron.


Conflict of interest statement

Declaration of interests The authors declare no competing interests.

Figures

Figure 1.
Figure 1.. Reconstruction of the PN-to-KC network
(A) Olfactory pathway schematic. Blue line, the frontal plane where KCs were randomly sampled for reconstruction (C-D). (B) A representative EM-reconstructed KC. Each claw receives a variable number of synapses (numbers in white) from a single ensheathed PN bouton. Left, skeletonized reconstructions. Right, volumetric segmentation of the same KC (purple) and ensheathed PN boutons (various colors). (C) Subarea of a frontal section from the whole-brain EM volume, showing the cross-section through pedunculus (blue false color) used for random sampling (D). (D) Randomly sampled KCs (magenta dots) in the pedunculus. A discrete region in the middle is devoid of magenta points, as it is occupied by other cell classes such as APL and non-olfactory KCs from accessory calyces (i.e. KC-α/βp and KC-γd). (E) Number of PN types for each category of behavioral significance based on a literature review (Table S1). (F) Distribution of number of claws per KC for all randomly sampled KCs (mean ± s.d., 5.2 ± 1.6). (G-H) The number of PN-KC connections per PN type is consistent between the current study and the ‘hemibrain’ dataset. (G), Three or more synapses between each PN-KC pair is counted as a connection. The fraction of connections made by each PN type out of the total number of connections in each dataset is shown. (H), the fraction of output per PN type is highly correlated across the two datasets (r2=0.83; blue shade, 95% confidence interval). Bar labels (G) and points (H) are colored according to behavioral category (E). See also Table S1.
Figure 2.
Figure 2.. Non-uniformity of olfactory input to the mushroom body
(A-C) For each PN type, the number of PNs (A); average number of boutons per PN (B); and number of boutons (C), in descending order. See also Figure S1.
Figure 3.
Figure 3.. Non-random sampling of olfactory PN input by KCs
(A) Random bouton null model schematic. Each claw is reassigned to a bouton chosen randomly from all boutons in the MB calyx. This null model ignores the fact that KC dendrites and PN arbors have restricted territories within the calyx, but ensures that the number of claws assigned to a given PN type is proportional to the number of boutons. (B) Observed PN-to-KC connectivity compared to the random bouton model. Conditional input analysis was applied to 1,356 randomly sampled KCs. A group of PN types (‘community’ PNs, dark and light green lines) provide above-chance levels of convergent input to downstream KCs. All PN types in the core community (dark green with overline), and most in the secondary community (light green), have been reported to primarily respond to food-related odorants (Table S1). In this and subsequent z-score matrices, PN types are color-coded according to behavioral category as in Figure 1E, and core community PN types are decorated with overlines. (C) Kenyon cells over-sample inputs from core community PN types. The observed number of claws receiving input from core community PNs (1,916; red dot) greatly exceeds the random bouton null model prediction (blue histogram; 10,000 random networks, mean ± s.d., 1,421.7 ± 35.7; z-score, 13.8). (D) Core community PNs have more claws per bouton than other PNs (mean ± s.d., 17.4 ± 9.3 vs. 11.5 ± 7.4; K-S test p<1×10⁻⁹). (E-F) Core community PNs in the observed network are presynaptic to more KC claws than predicted by the random bouton model (error bars, s.d. of 10,000 random networks; Chi-square test p<1×10⁻¹⁰). Each bar in (E) and dot in (F) represents a PN. Bar labels (E) and points (H) are colored according to behavioral category (Figure 1E). (G, I) Number of claws per bouton (G) and number of claws (I) per PN type, in descending order. (H, J) Food-responsive PNs provided output to more claws than non-food PNs on both a per-bouton (H, mean ± s.d., 15.66 ± 3.08 vs. 10.53 ± 7.3, K-S test p<1.3×10⁻⁹) and per-glomerulus (J, mean ± s.d., 162.95 ± 60.74 vs. 100.06 ± 56.17, K-S test p<2.5×10⁻⁵) basis. See also Figure S2–4 and Table S2–4.
Figure 4.
Figure 4.. Preferential ensheathment of food-responsive PN boutons by KC claws
(A) Random claw null model schematic. The biased ensheathment of PN boutons by KCs according to PN subtype is maintained in this null model, while territoriality in the distribution of boutons and claws within the MB calyx is ignored. (B) Core community PNs types converge more frequently than predicted by the random claw model, suggesting that the preferential ensheathment of their boutons is insufficient to explain the observed network structure. (C) Conditional input analysis of a single representative network generated using the random claw model shows no clustered structure. (D) Z-scores for the random claw model (Figure 4B) vary less than for the random bouton model (Figure 3B; mean ± s.d., −0.044 ± 2.11 vs. −0.058 ± 1.47; K-S test p<1×10⁻¹⁰), indicating random claw model captures more of the observed network structure. See also Figure S5.
Figure 5.
Figure 5.. Neurogeometry of PN and KC arbors best explains the observed network structure
(A) Local random null model schematic. Left: each dashed line circumscribes a claw and its five nearest PN boutons. Right: after randomization, each claw is randomly assigned to one of the five nearest boutons. (B) The local random model recapitulates the greater number of claws ensheathing core community PN boutons. The observed number of claws receiving inputs from core community PNs (red dot; 1,916 claws) was nearly identical to the mean of the local random model (mean ± s.d., 1,890.6 ± 22.5). By definition, all networks created using the random claw model also have 1,916 claws. (C) The local random model best recapitulates the number of claws per KC postsynaptic to core community PNs. Observed vs. random bouton, Chi-square test p<1×10⁻¹⁰; observed vs. random claw, Chi-square test p<1×10⁻¹⁰; observed vs. local random, Chi-square test p<0.028 (error bars, ± s.d.). (D) A single, representative network generated using the local random model recapitulates much of the core community of overconvergent PN types when compared to the random bouton null model. (E-F) Core community PN types do not converge more often than predicted by the local random model, indicating this more geometrically realistic null model captures much of the observed network structure. (F), Z-scores for the core community PNs (green square) are not elevated compared to other PN types (columns and rows ordered as in Figure 3B).
Figure 6.
Figure 6.. Arbor overlap between core community PNs and KCs
(A-B) Olfactory PNs project from AL to two higher brain centers, MB and LH. Core community PNs (green) have regionalized projection patterns in MB and LH compared to non-core community PNs (varying shades of purple). Scale bar in (B) applies also to (D-L). (C) Core community PN boutons are closer to each other than to non-core community boutons. Each count represents the distance between a given bouton and the nearest bouton of a PN of a different type (green: core community PN bouton pairs; blue: pairs consisting of a core community PN bouton and a non-core community PN bouton; K-S test p<1×10⁻¹⁰; mean ± s.d., 10.9 ± 6.8 vs. 18.6 ± 7.4) (D) Core community PN axon territories (green) overlap with the dendritic arbors of the 6 KCs (red) receiving 6 or more bouton inputs from core community PNs (same view as B). (E-F) Dorsal (E) and posterior (F) view of MB calyx shows the 46 KCs that receive 5 or more inputs from core community PNs. The dendrites, somata, and axonal bundles (proximal pedunculus; see E, bottom) of the KCs, respectively, are segregated into 4 clusters (4 arbitrary colors) that may correspond to the 4 KC neuroblasts in development., (G-I) In frontal view of MB calyx, dendritic arbors of KCαβ (G) and KCα’β’ (H) subtypes are more constrained than those of KCγ (I) to territory innervated by core community PN axons. To equalize the number of KC arbors plotted for each subtype, 246 out of 478 αβ KCs and 246 out of 575 γ KCs, were randomly selected for visualization, to be consistent with 246 reconstructed α’β’ KCs. (J-L) Regionalized arbor distribution of core community PNs in three calyces: right side of FAFB (J), left side of FAFB (K), and hemibrain (L). The PNs are arbitrarily colored by type; colors are consistent across datasets (gray, calyx surface). See also Figure S6.
Figure 7.
Figure 7.. Effect of the observed PN-to-KC network structure on a simulated discrimination task
(A) The z-scores of core community PN types compared to the random glomerulus (Figure S7A); random bouton (Figure 3B); random claw (Figure 4B); and local random (Figure 5F) null models. The least realistic null model (random glomerulus) has the highest mean z-score, while the local random model has lowest, indicating it best recapitulates the observed connectivity (horizontal lines: mean; vertical bars: s.d.). (B-F) Activation of more community PNs (including core and secondary community) leads to rescue of performance in a simulated discrimination task, for all connectivity models incorporating the observed non-uniformity of PN type input to MB calyx. A constant number of PN types (19; i.e., the number of core and secondary PN types) is activated, while the fraction of community PN types activated ranges from 0 to 100%. Error bars: ± s.d. (G) Overall discrimination performance worsens as with decreasing randomness and increasing connectivity model realism. All 51 PN types provide input to the classifier. See also Figure S7.

Similar articles

Cited by

References

    1. Lichtman JW, and Sanes JR (2008). Ome sweet ome: what can the genome tell us about the connectome? Current opinion in neurobiology 18, 346–353. 10.1016/j.conb.2008.08.010. - DOI - PMC - PubMed
    1. Zheng Z, Lauritzen JS, Perlman E, Robinson CG, Nichols M, Milkie D, Torrens O, Price J, Fisher CB, Sharifi N, et al. (2018). A Complete Electron Microscopy Volume of the Brain of Adult Drosophila melanogaster. Cell 174, 730–743 e722. 10.1016/j.cell.2018.06.019. - DOI - PMC - PubMed
    1. Ofstad TA, Zuker CS, and Reiser MB (2011). Visual place learning in Drosophila melanogaster. Nature 474, 204–207. 10.1038/nature10131. - DOI - PMC - PubMed
    1. DasGupta S, Ferreira CH, and Miesenbock G (2014). FoxP influences the speed and accuracy of a perceptual decision in Drosophila. Science 344, 901–904. 10.1126/science.1252114. - DOI - PMC - PubMed
    1. Owald D, and Waddell S (2015). Olfactory learning skews mushroom body output pathways to steer behavioral choice in Drosophila. Current opinion in neurobiology 35, 178–184. 10.1016/j.conb.2015.10.002. - DOI - PMC - PubMed

Publication types

LinkOut - more resources