. 2022 Sep;609(7925):101-108.
doi: 10.1038/s41586-022-05049-6. Epub 2022 Jul 7.

Wastewater sequencing reveals early cryptic SARS-CoV-2 variant transmission

Smruthi Karthikeyan #  1 Joshua I Levy #  2 Peter De Hoff  3   4   5 Greg Humphrey  1 Amanda Birmingham  6 Kristen Jepsen  7 Sawyer Farmer  1 Helena M Tubb  1 Tommy Valles  1 Caitlin E Tribelhorn  1 Rebecca Tsai  1 Stefan Aigner  3 Shashank Sathe  3 Niema Moshiri  8 Benjamin Henson  7 Adam M Mark  6 Abbas Hakim  3   4   5 Nathan A Baer  3 Tom Barber  3 Pedro Belda-Ferre  3 Marisol Chacón  3 Willi Cheung  3   4   5 Evelyn S Cresini  3 Emily R Eisner  3 Alma L Lastrella  3 Elijah S Lawrence  3 Clarisse A Marotz  3 Toan T Ngo  3 Tyler Ostrander  3 Ashley Plascencia  3 Rodolfo A Salido  3 Phoebe Seaver  3 Elizabeth W Smoot  3 Daniel McDonald  1 Robert M Neuhard  9   10 Angela L Scioscia  4   11 Alysson M Satterlund  12 Elizabeth H Simmons  13 Dismas B Abelman  10 David Brenner  10 Judith C Bruner  10 Anne Buckley  10 Michael Ellison  10 Jeffrey Gattas  10 Steven L Gonias  14 Matt Hale  10 Faith Hawkins  10 Lydia Ikeda  10 Hemlata Jhaveri  10 Ted Johnson  10 Vince Kellen  10 Brendan Kremer  10 Gary Matthews  10 Ronald W McLawhon  10 Pierre Ouillet  10 Daniel Park  10 Allorah Pradenas  10 Sharon Reed  10 Lindsay Riggs  10 Alison Sanders  10 Bradley Sollenberger  10 Angela Song  9   10 Benjamin White  10 Terri Winbush  10 Christine M Aceves  2 Catelyn Anderson  2 Karthik Gangavarapu  2 Emory Hufbauer  2 Ezra Kurzban  2 Justin Lee  2 Nathaniel L Matteson  2 Edyth Parker  2 Sarah A Perkins  2 Karthik S Ramesh  2 Refugio Robles-Sikisaka  2 Madison A Schwab  2 Emily Spencer  2 Shirlee Wohl  2 Laura Nicholson  15 Ian H McHardy  15 David P Dimmock  16 Charlotte A Hobbs  16 Omid Bakhtar  17 Aaron Harding  17 Art Mendoza  17 Alexandre Bolze  18 David Becker  18 Elizabeth T Cirulli  18 Magnus Isaksson  18 Kelly M Schiabor Barrett  18 Nicole L Washington  18 John D Malone  19 Ashleigh Murphy Schafer  19 Nikos Gurfield  19 Sarah Stous  19 Rebecca Fielding-Miller  20   21 Richard S Garfein  20 Tommi Gaines  21 Cheryl Anderson  20 Natasha K Martin  21 Robert Schooley  21 Brett Austin  17 Duncan R MacCannell  22 Stephen F Kingsmore  16 William Lee  18 Seema Shah  19 Eric McDonald  19 Alexander T Yu  5 Mark Zeller  2 Kathleen M Fisch  4   6 Christopher Longhurst  1   23 Patty Maysent  24 David Pride  14   25 Pradeep K Khosla  8 Louise C Laurent  3   4   26 Gene W Yeo  3   26   27 Kristian G Andersen  2 Rob Knight  28   29   30
Affiliations

Wastewater sequencing reveals early cryptic SARS-CoV-2 variant transmission

Smruthi Karthikeyan et al. Nature. 2022 Sep.

Abstract

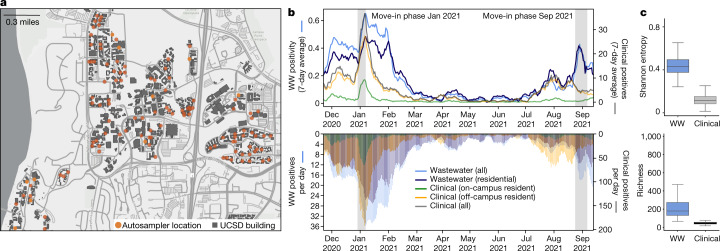
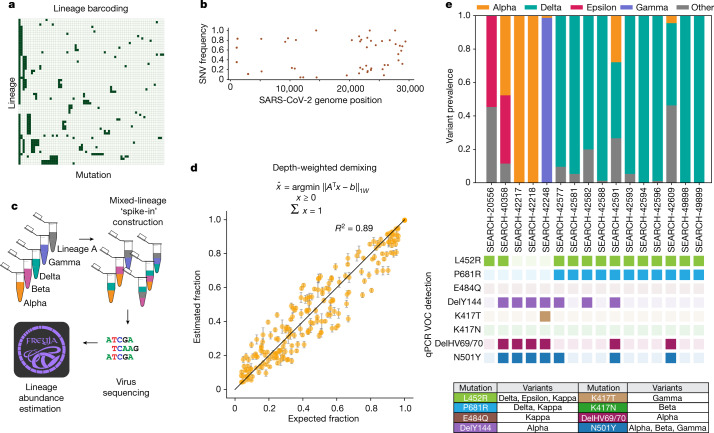
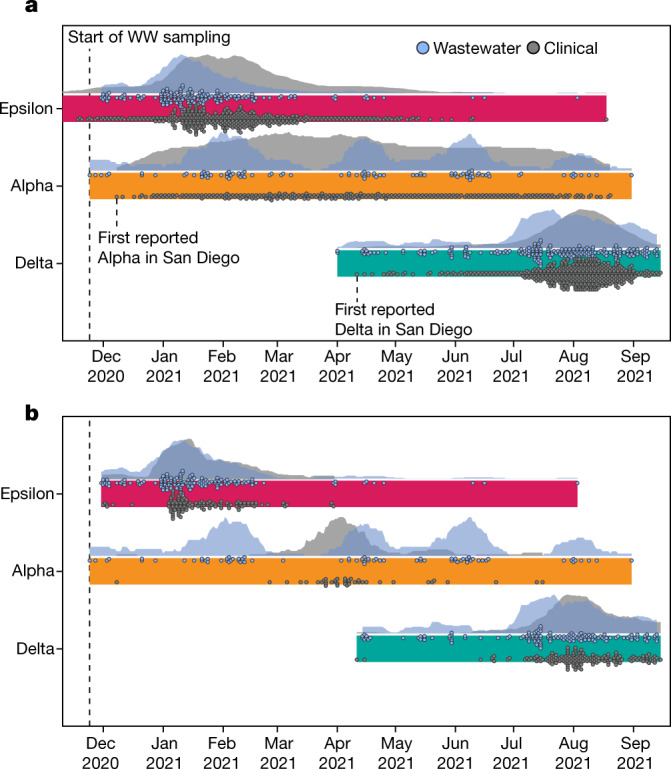
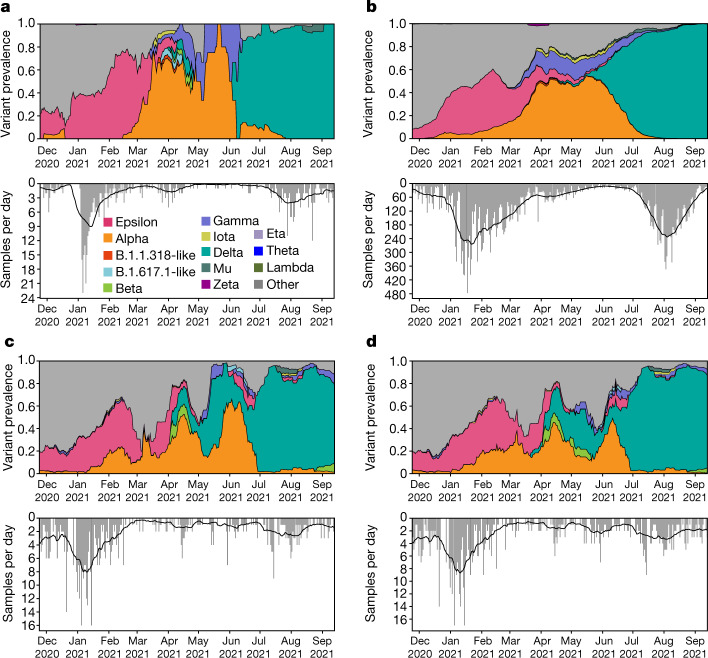
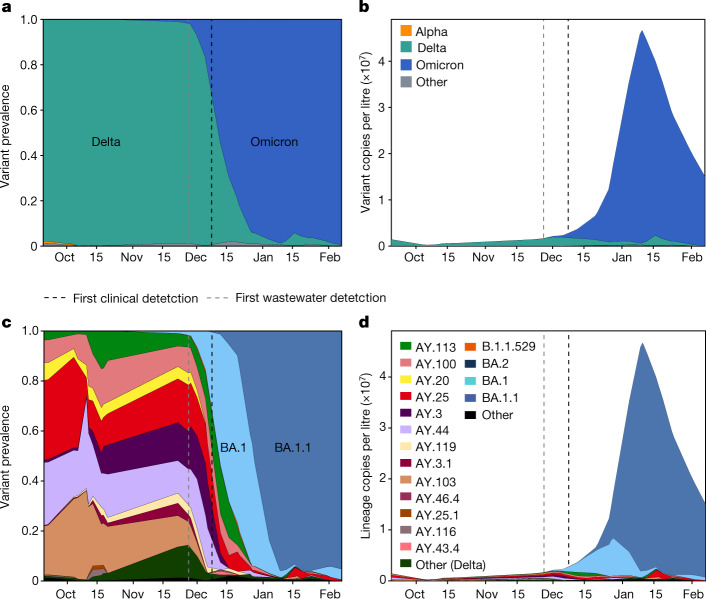
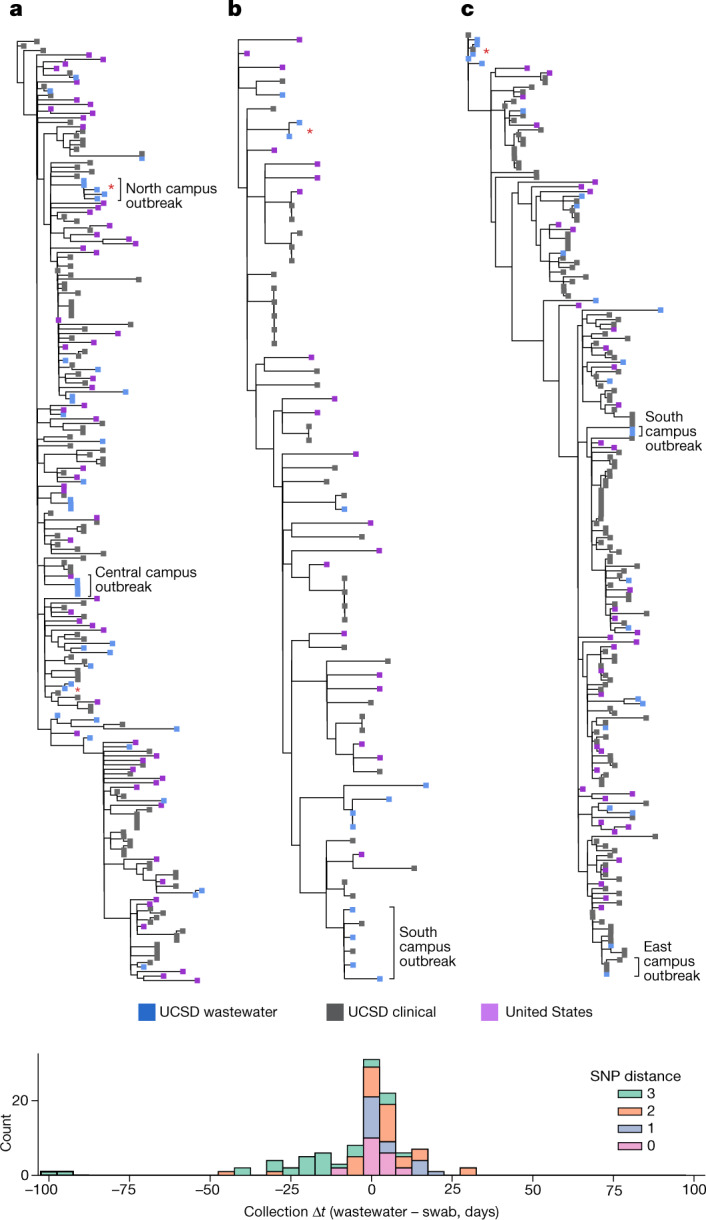
As SARS-CoV-2 continues to spread and evolve, detecting emerging variants early is critical for public health interventions. Inferring lineage prevalence by clinical testing is infeasible at scale, especially in areas with limited resources, participation, or testing and/or sequencing capacity, which can also introduce biases1-3. SARS-CoV-2 RNA concentration in wastewater successfully tracks regional infection dynamics and provides less biased abundance estimates than clinical testing4,5. Tracking virus genomic sequences in wastewater would improve community prevalence estimates and detect emerging variants. However, two factors limit wastewater-based genomic surveillance: low-quality sequence data and inability to estimate relative lineage abundance in mixed samples. Here we resolve these critical issues to perform a high-resolution, 295-day wastewater and clinical sequencing effort, in the controlled environment of a large university campus and the broader context of the surrounding county. We developed and deployed improved virus concentration protocols and deconvolution software that fully resolve multiple virus strains from wastewater. We detected emerging variants of concern up to 14 days earlier in wastewater samples, and identified multiple instances of virus spread not captured by clinical genomic surveillance. Our study provides a scalable solution for wastewater genomic surveillance that allows early detection of SARS-CoV-2 variants and identification of cryptic transmission.


Conflict of interest statement

A. Bolze, D. Becker, E.T.C., M.I., K.M.S.B., N.L.W. and W.L. are employees of Helix. K.G.A. has received consulting fees for advising on SARS-CoV-2, variants and the COVID-19 pandemic.

Figures

Fig. 1
Fig. 1. Campus sampling locations and SARS-CoV-2 testing statistics.
a, Geospatial distribution of the 131 actively deployed wastewater autosamplers and the corresponding 360 university buildings on the campus sewer network. Building-specific data have been de-identified in accordance with university reporting policies. b, Campus wastewater (WW) and diagnostic testing statistics over the 295-day sampling period (positivity is the fraction of WW samplers with a positive qPCR signal). c, Virus diversity in wastewater and clinical samples; boxplots of Shannon entropy (top) and richness (bottom) for each sample type (n = 153 WW—a subset chosen to maximize sample independence; see Methods—and n = 5,888 clinical). Box edges specify the first and third quartiles, the solid line indicates the median, and the whiskers delimit the maximum and minimum values. Map in a is the intellectual property of Esri and its licensors and are used herein under license. Copyright © 2022 Esri and its licensors. All rights reserved.
Fig. 2
Fig. 2. Sample deconvolution robustly recovers relative virus abundance.
a, Subset of lineage defining mutation ‘barcode’ matrix. Each row represents one lineage (out of more than 1,000 lineages included in the UShER global phylogenetic tree), and individual nucleotide mutations are represented as columns. b, Single-nucleotide variant (SNV) frequencies obtained from iVar used for recovering relative abundance of each lineage. c, Schematic of the spike-in validation experiment. d, Depth-weighted demixing estimates of the virus abundance versus expected or known abundance. Details on lineage-specific predictions are provided in Extended Data Fig. 3. Error bars indicate s.d. of estimates across mixture replicates. e, Comparison of wastewater sample deconvolution with VOC qPCR panel, with lookup table (bottom) showing amino acid mutations corresponding to each variant.
Fig. 3
Fig. 3. Freyja recovers early and cryptic transmission of SARS-CoV-2 variants of concern.
a, Timeline and normalized epidemiological curves for VOC detection in both wastewater and clinical sequences from San Diego County (includes wastewater samples collected from Point Loma wastewater treatment plant, UCSD, as well as public schools in the San Diego districts) for the three major VOCs in circulation during the sampling period (n = 475 wastewater, n = 22,504 clinical). Both Alpha and Delta variants are detected first in wastewater before clinical samples. Markers for clinical detections correspond to the ceiling of the daily detection count divided by 30 (for example, 1–30 samples = one marker, 31–60 = two markers), whereas wastewater markers correspond to a single detection. b, Timeline and epidemiological curves for VOC detection in the campus samples (n = 364 wastewater, n = 333 clinical). Markers correspond to a single detection event for both clinical and wastewater surveillance. All wastewater detections correspond to an estimated VOC prevalence of at least 10%.
Fig. 4
Fig. 4. Deconvolution recovers a fine-grained estimate of virus population dynamics.
a,b, Prevalence of SARS-CoV-2 variants in UCSD clinical surveillance (a) and variant prevalence in all clinical samples collected in San Diego County (b). c,d, Variant prevalence in wastewater at UCSD (c) and the greater San Diego County (d). Further analysis of Point Loma wastewater samples is shown in Extended Data Fig. 5. All curves show the rolling average, with a window of ±10 days. ‘Other’ contains all lineages not designated as VOCs. The bottom panels show the number of sequenced samples per day.
Fig. 5
Fig. 5. Community wastewater enables early Omicron detection and reveals lineage dynamics.
a, Prevalence of SARS-CoV-2 VOCs in wastewater collected from the Point Loma wastewater treatment plant from late September 2021 to early February 2022. b, Estimated VOC concentrations; prevalence estimates were scaled by normalized viral load in wastewater. c,d, Lineage-specific estimates of prevalence (c) and concentration (d). All curves show an adaptive rolling average calculated using a local linear approximation (Savitzky–Golay filter) of virus copies per litre, with a window size of ±1 sampling date.
Fig. 6
Fig. 6. Wastewater identifies clinically known and unknown virus transmission.
ac, Maximum likelihood phylogenetic trees for each of the dominant VOCs (Epsilon (a), Alpha (b) and Delta (c)) using high-quality samples obtained at UCSD, as well as a representative set of sequences from the entire United States. Wastewater sequences from the same sampler that differ by one or fewer SNPs are denoted with a red asterisk. For all sequences, consensus bases were called at sites with more than 50% nucleotide frequency. Location information is provided for select outbreaks. d, Pairwise comparison of collection date for matching and near-matching wastewater and nasal swab samples obtained at UCSD. Positive values indicate earlier collection in nasal swabs and negative values indicate earlier detection in wastewater.
Extended Data Fig. 1
Extended Data Fig. 1. Relationship of daily UCSD campus wastewater sampler positivity and campus clinical positives.
Black line indicates the linear regression fit (slope = 1.88 %/clinical positive, intercept = −0.45%) to the data (n = 321), with bootstrap 95% confidence interval (resampled 1000 times with replacement) shown in gray (median slope = 1.88%/clinical positive, intercept = −0.47%).
Extended Data Fig. 2
Extended Data Fig. 2. Relationship between genome coverage and cycle quantification values.
10x genome coverage (fraction of sites with 10 reads or greater) remains high, even for Cq values of nearly 38 (n = 786). Points indicate median value in each bin, while error bars indicate the median absolute deviation.
Extended Data Fig. 3
Extended Data Fig. 3. Lineage-specific prediction of variant abundance in spike-in validation samples.
A. Schematic of “spike-in” sample design. B-F. Lineage specific prediction. Proportions of each lineage in the sample are shown as a pie chart marker (Grey = Lineage A, Orange = Alpha, Pink = Beta, Turquoise = Delta, and Purple = Gamma) with error bars indicating the standard deviation from the mean, across four replicates (n = 380, four samples per mixture type).
Extended Data Fig. 4
Extended Data Fig. 4. Freyja more accurately estimates virus abundance, with fewer false positives.
A-B. Estimated vs expected fraction of each lineage in the mixture (n = 95, one sample per mixture type). The Kallisto-based approach from Baaijens et. al shows a wider range of estimates for each known mix fraction, and generally underestimates the fraction. C. False positives with abundance greater than 0.5%.
Extended Data Fig. 5
Extended Data Fig. 5. The rise of the Delta variant during Summer 2021.
A. Mean SARS-CoV-2 viral gene copies/L of raw sewage (blue) collected from the Point Loma Wastewater Treatment Plant and caseload (gray) reported by the county during the same period. SARS-CoV-2 concentrations were normalized by PMMoV (pepper mild mottle virus) concentration to adjust for load changes. B. Lineage distribution in UCSD campus wastewater. C. Monthly lineage averages for wastewater collected at Point Loma Wastewater Treatment Plant during the Delta surge (N = 5, 20, 25, 7).
Extended Data Fig. 6
Extended Data Fig. 6. Quantification of deconvolution uncertainty in first detection of VOCs.
A-D. Bootstrap distributions of Freyja abundance estimates obtained by resampling read data from each sample corresponding to the first detection of that VOC in San Diego 1000 times with replacement. In all boxplots, box edges specify the first and third quartiles, solid line indicates the median, and whiskers delimit the maximum and minimum values within 1.5 times the inter-quartile range (IQR) of box edges. Outliers are denoted with individual markers. Two samplers were found to contain Delta on the same day. First detections were also confirmed using a VOC qPCR panel, as shown in Fig. 2 and Extended Data Table 3. 95% Confidence intervals for variant prevalence for each first detection event: A. Alpha: (0.232, 0.278), B. Delta: (0.336, 0.397), C. Delta: (0.676, 0.772), D. Omicron: (0.017, 0.021). E. Estimated proportion of Omicron sequences in clinical data. Omicron estimates tracked via S-gene target failure, SGTF (characteristic of Omicron lineage BA.1 and its descendants) qPCR assays for clinical samples in San Diego between November 27th, 2021-February 7th, 2022. First detection of Omicron through clinical genomic sequencing in San Diego was December 8th. Dotted line shows a rolling average with a window size of seven days.
Extended Data Fig. 7
Extended Data Fig. 7. Temporal and spatial dynamics of an Epsilon outbreak at UCSD.
After initial detection on January 3rd 2021, infected individuals were transferred to isolation housing where they continued to shed virus. At the end of January, a matching virus was detected in a residence nearby the original site of detection. All four samples have perfectly matching virus genomes. Maps are the intellectual property of Esri and its licensors and are used herein under license. Copyright © 2022 Esri and its licensors. All rights reserved.

Update of

  • Wastewater sequencing uncovers early, cryptic SARS-CoV-2 variant transmission.
    Karthikeyan S, Levy JI, De Hoff P, Humphrey G, Birmingham A, Jepsen K, Farmer S, Tubb HM, Valles T, Tribelhorn CE, Tsai R, Aigner S, Sathe S, Moshiri N, Henson B, Mark AM, Hakim A, Baer NA, Barber T, Belda-Ferre P, Chacón M, Cheung W, Cresini ES, Eisner ER, Lastrella AL, Lawrence ES, Marotz CA, Ngo TT, Ostrander T, Plascencia A, Salido RA, Seaver P, Smoot EW, McDonald D, Neuhard RM, Scioscia AL, Satterlund AM, Simmons EH, Abelman DB, Brenner D, Bruner JC, Buckley A, Ellison M, Gattas J, Gonias SL, Hale M, Hawkins F, Ikeda L, Jhaveri H, Johnson T, Kellen V, Kremer B, Matthews G, McLawhon RW, Ouillet P, Park D, Pradenas A, Reed S, Riggs L, Sanders A, Sollenberger B, Song A, White B, Winbush T, Aceves CM, Anderson C, Gangavarapu K, Hufbauer E, Kurzban E, Lee J, Matteson NL, Parker E, Perkins SA, Ramesh KS, Robles-Sikisaka R, Schwab MA, Spencer E, Wohl S, Nicholson L, Mchardy IH, Dimmock DP, Hobbs CA, Bakhtar O, Harding A, Mendoza A, Bolze A, Becker D, Cirulli ET, Isaksson M, Barrett KMS, Washington NL, Malone JD, Schafer AM, Gurfield N, Stous S, Fielding-Miller R, Garfein RS, Gaines T, Anderson C, Martin NK, Schooley R, Austin B, MacCannell DR, Kingsmore SF, Lee W, Shah S, McDonald E… See abstract for full author list ➔ Karthikeyan S, et al. medRxiv [Preprint]. 2022 Apr 4:2021.12.21.21268143. doi: 10.1101/2021.12.21.21268143. medRxiv. 2022. Update in: Nature. 2022 Sep;609(7925):101-108. doi: 10.1038/s41586-022-05049-6. PMID: 35411350 Free PMC article. Updated. Preprint.

References

    1. Reitsma, M. B. et al. Racial/ethnic disparities in COVID-19 exposure risk, testing, and cases at the subcounty level in California. Health Aff.40, 870–878 (2021).10.1377/hlthaff.2021.00098 - DOI - PMC - PubMed
    1. Lieberman-Cribbin, W., Tuminello, S., Flores, R. M. & Taioli, E. Disparities in COVID-19 testing and positivity in New York City. Am. J. Prev. Med.59, 326–332 (2020). 10.1016/j.amepre.2020.06.005 - DOI - PMC - PubMed
    1. Brito, A. F. et al. Global disparities in SARS-CoV-2 genomic surveillance. Preprint at medRxiv10.1101/2021.08.21.21262393 (2021).
    1. Karthikeyan, S. et al. High-throughput wastewater SARS-CoV-2 detection enables forecasting of community infection dynamics in San Diego County. mSystems6, e00045-21 (2021). 10.1128/mSystems.00045-21 - DOI - PMC - PubMed
    1. Randazzo, W. et al. SARS-CoV-2 RNA in wastewater anticipated COVID-19 occurrence in a low prevalence area. Water Res.181, 115942 (2020). 10.1016/j.watres.2020.115942 - DOI - PMC - PubMed

Supplementary concepts