. 2022 Oct;17(10):1178-1191.
doi: 10.1016/j.jtho.2022.06.011. Epub 2022 Jul 5.

Tumor Cells Modulate Macrophage Phenotype in a Novel In Vitro Co-Culture Model of the NSCLC Tumor Microenvironment

Affiliations

Tumor Cells Modulate Macrophage Phenotype in a Novel In Vitro Co-Culture Model of the NSCLC Tumor Microenvironment

Josiah Voth Park et al. J Thorac Oncol. 2022 Oct.

Abstract

Introduction: Macrophage phenotype in the tumor microenvironment correlates with prognosis in NSCLC. Immunosuppressive macrophages promote tumor progression, whereas proinflammatory macrophages may drive an antitumor immune response. How individual NSCLCs affect macrophage phenotype is a major knowledge gap.

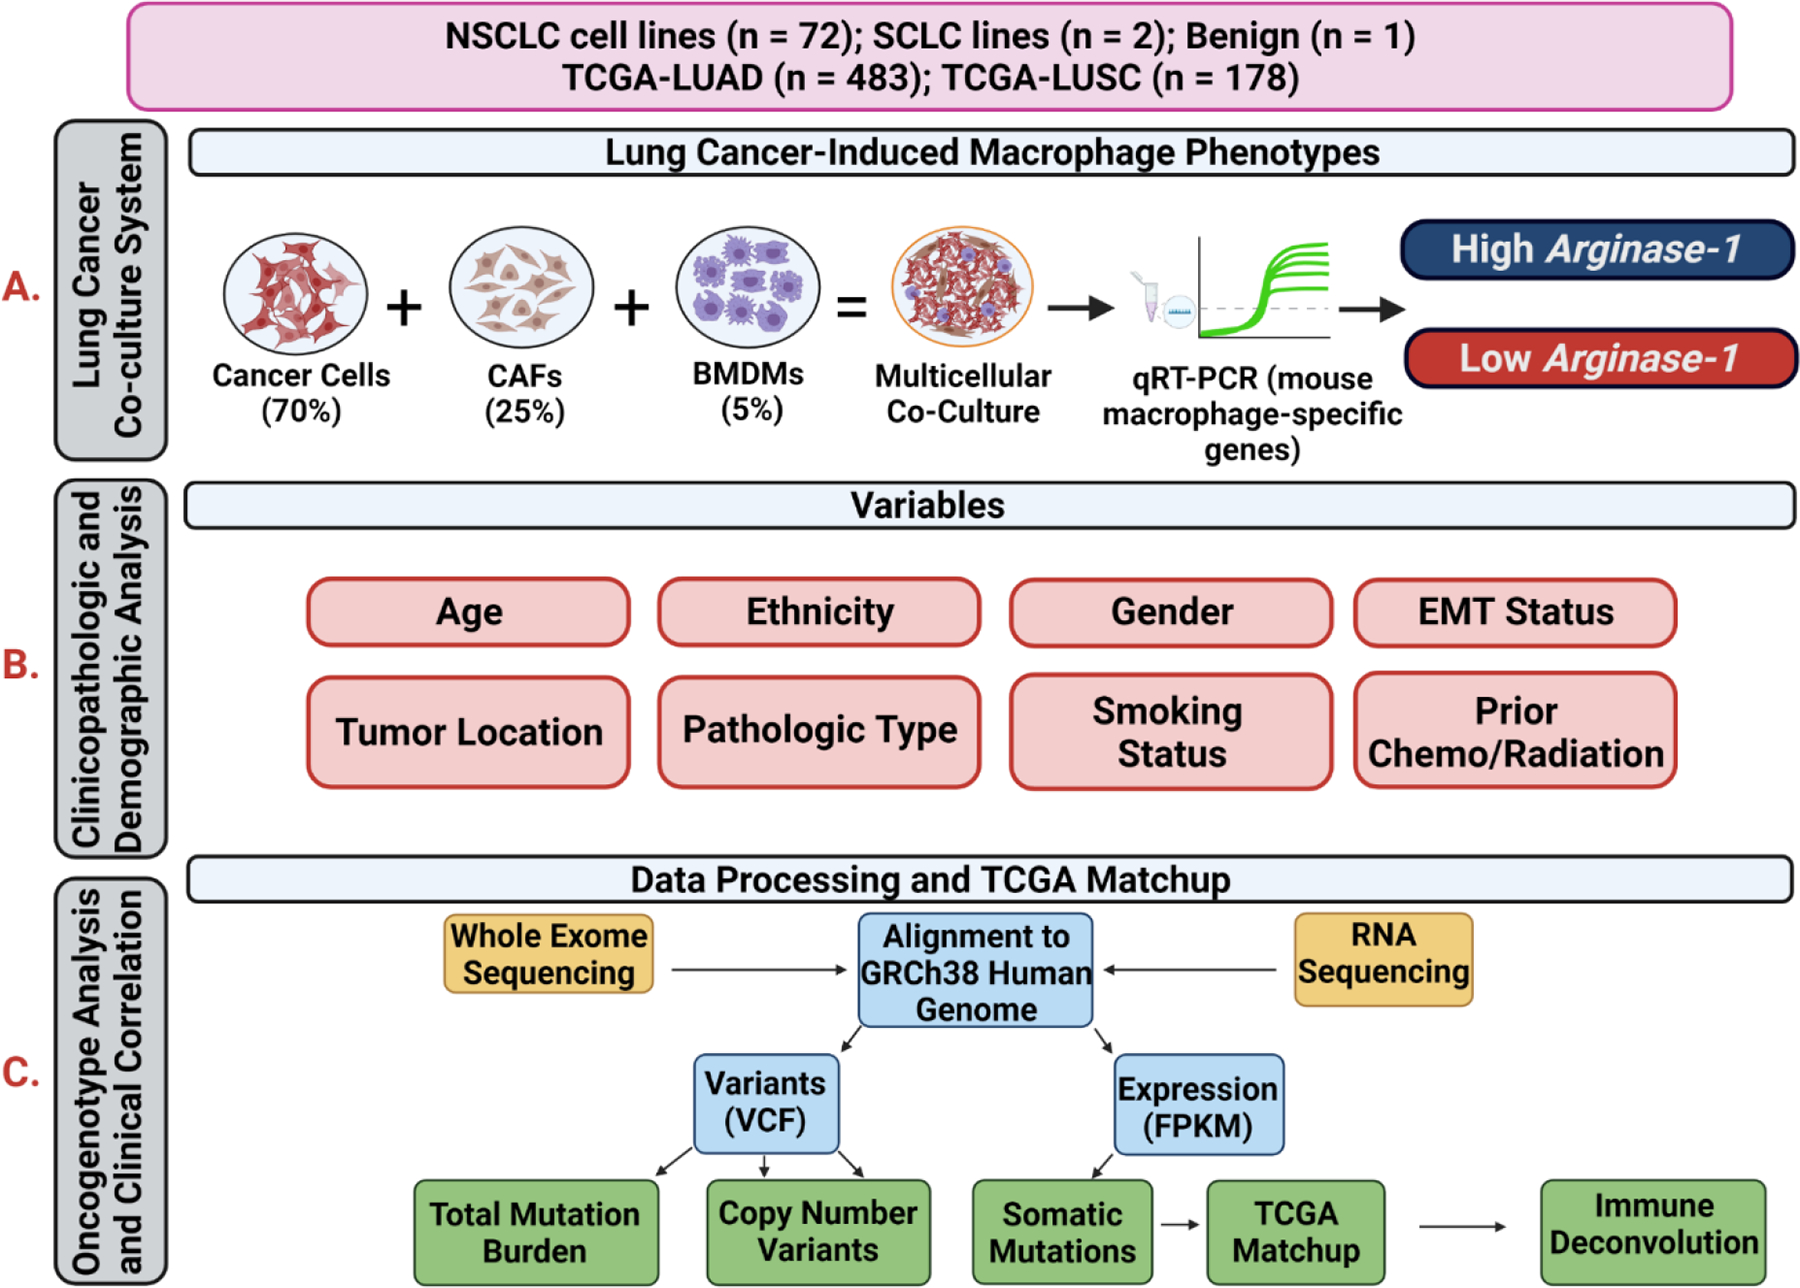
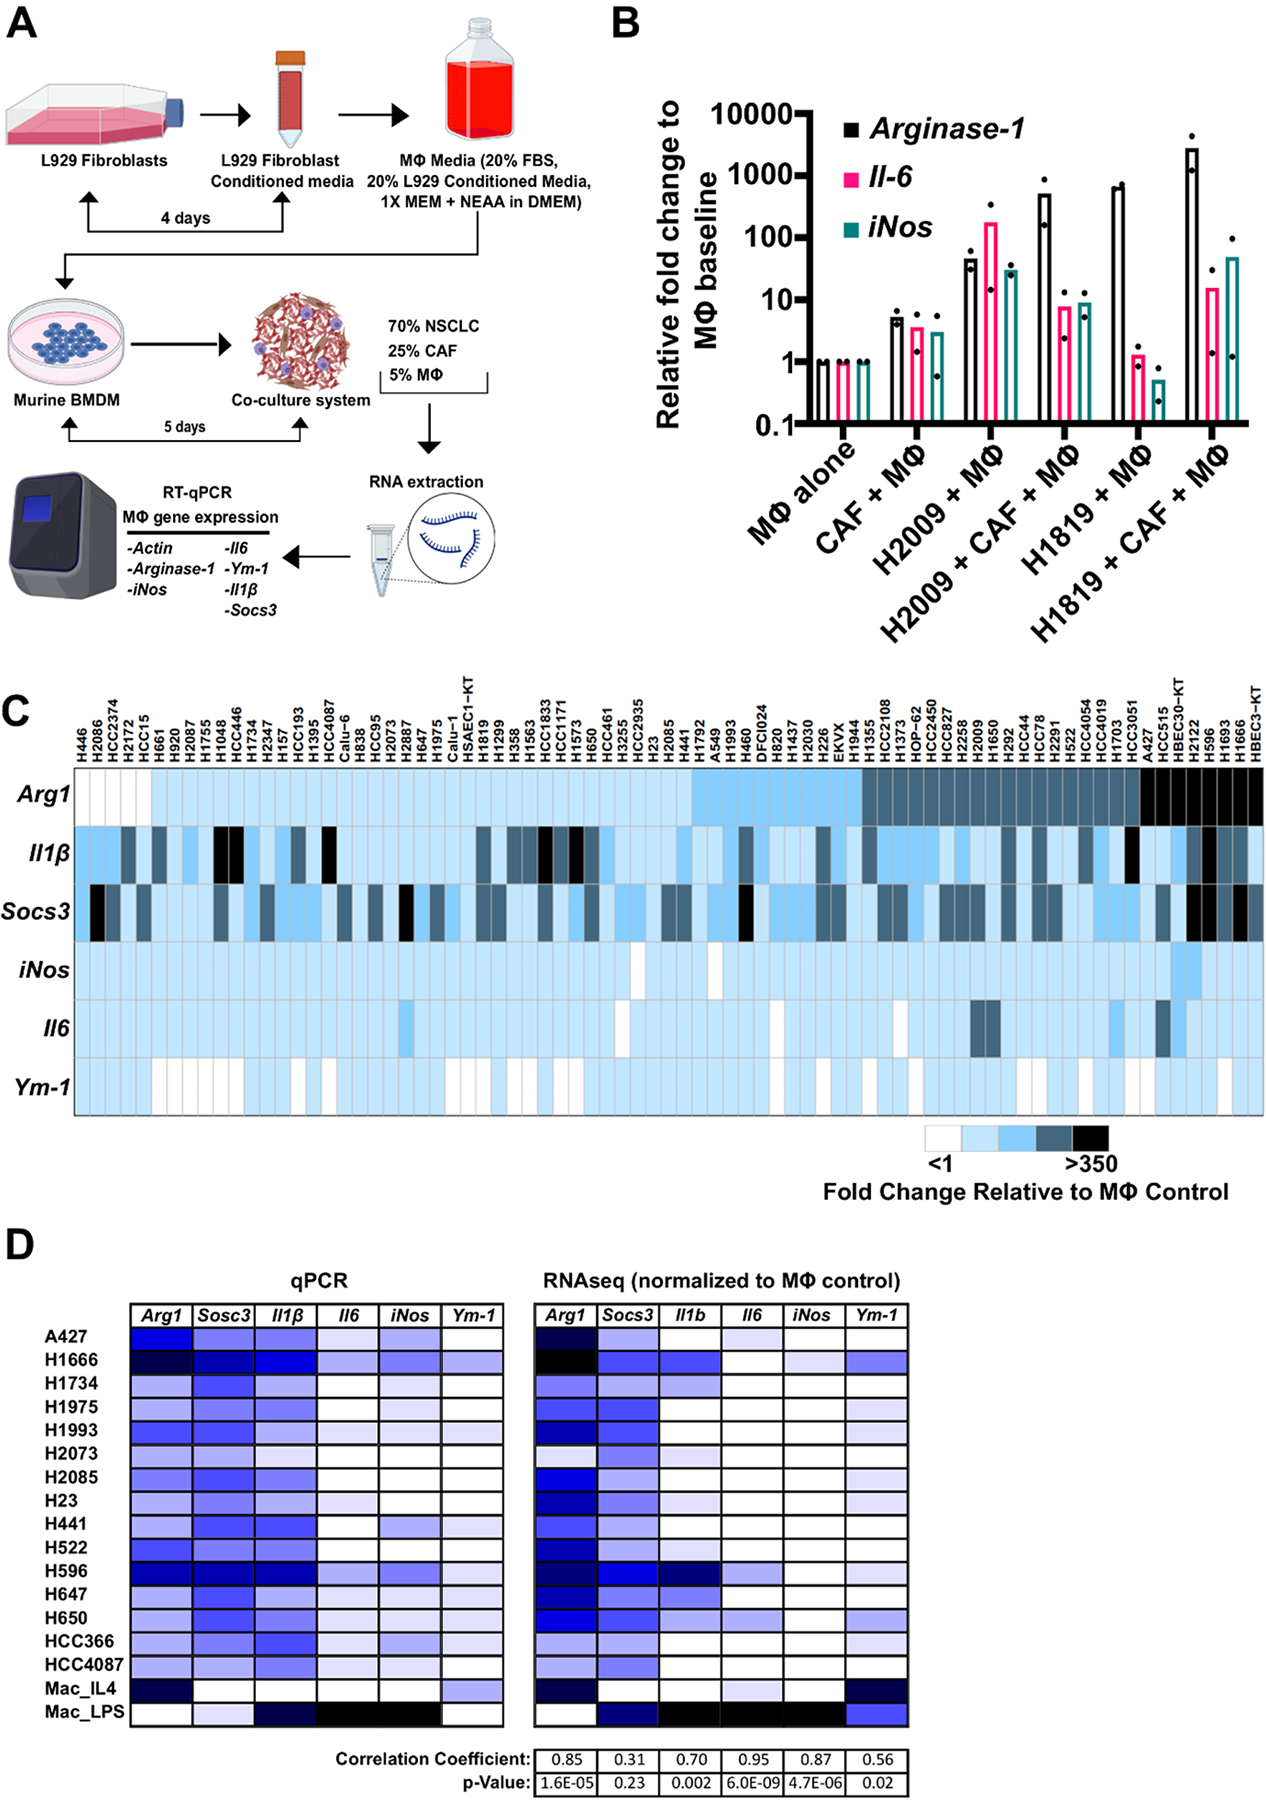
Methods: To systematically study the impact of lung cancer cells on macrophage phenotypes, we developed an in vitro co-culture model that consisted of molecularly and clinically annotated patient-derived NSCLC lines, human cancer-associated fibroblasts, and murine macrophages. Induced macrophage phenotype was studied through quantitative real-time polymerase chain reaction and validated in vivo using NSCLC xenografts through quantitative immunohistochemistry and clinically with The Cancer Genome Atlas (TCGA)-"matched" patient tumors.

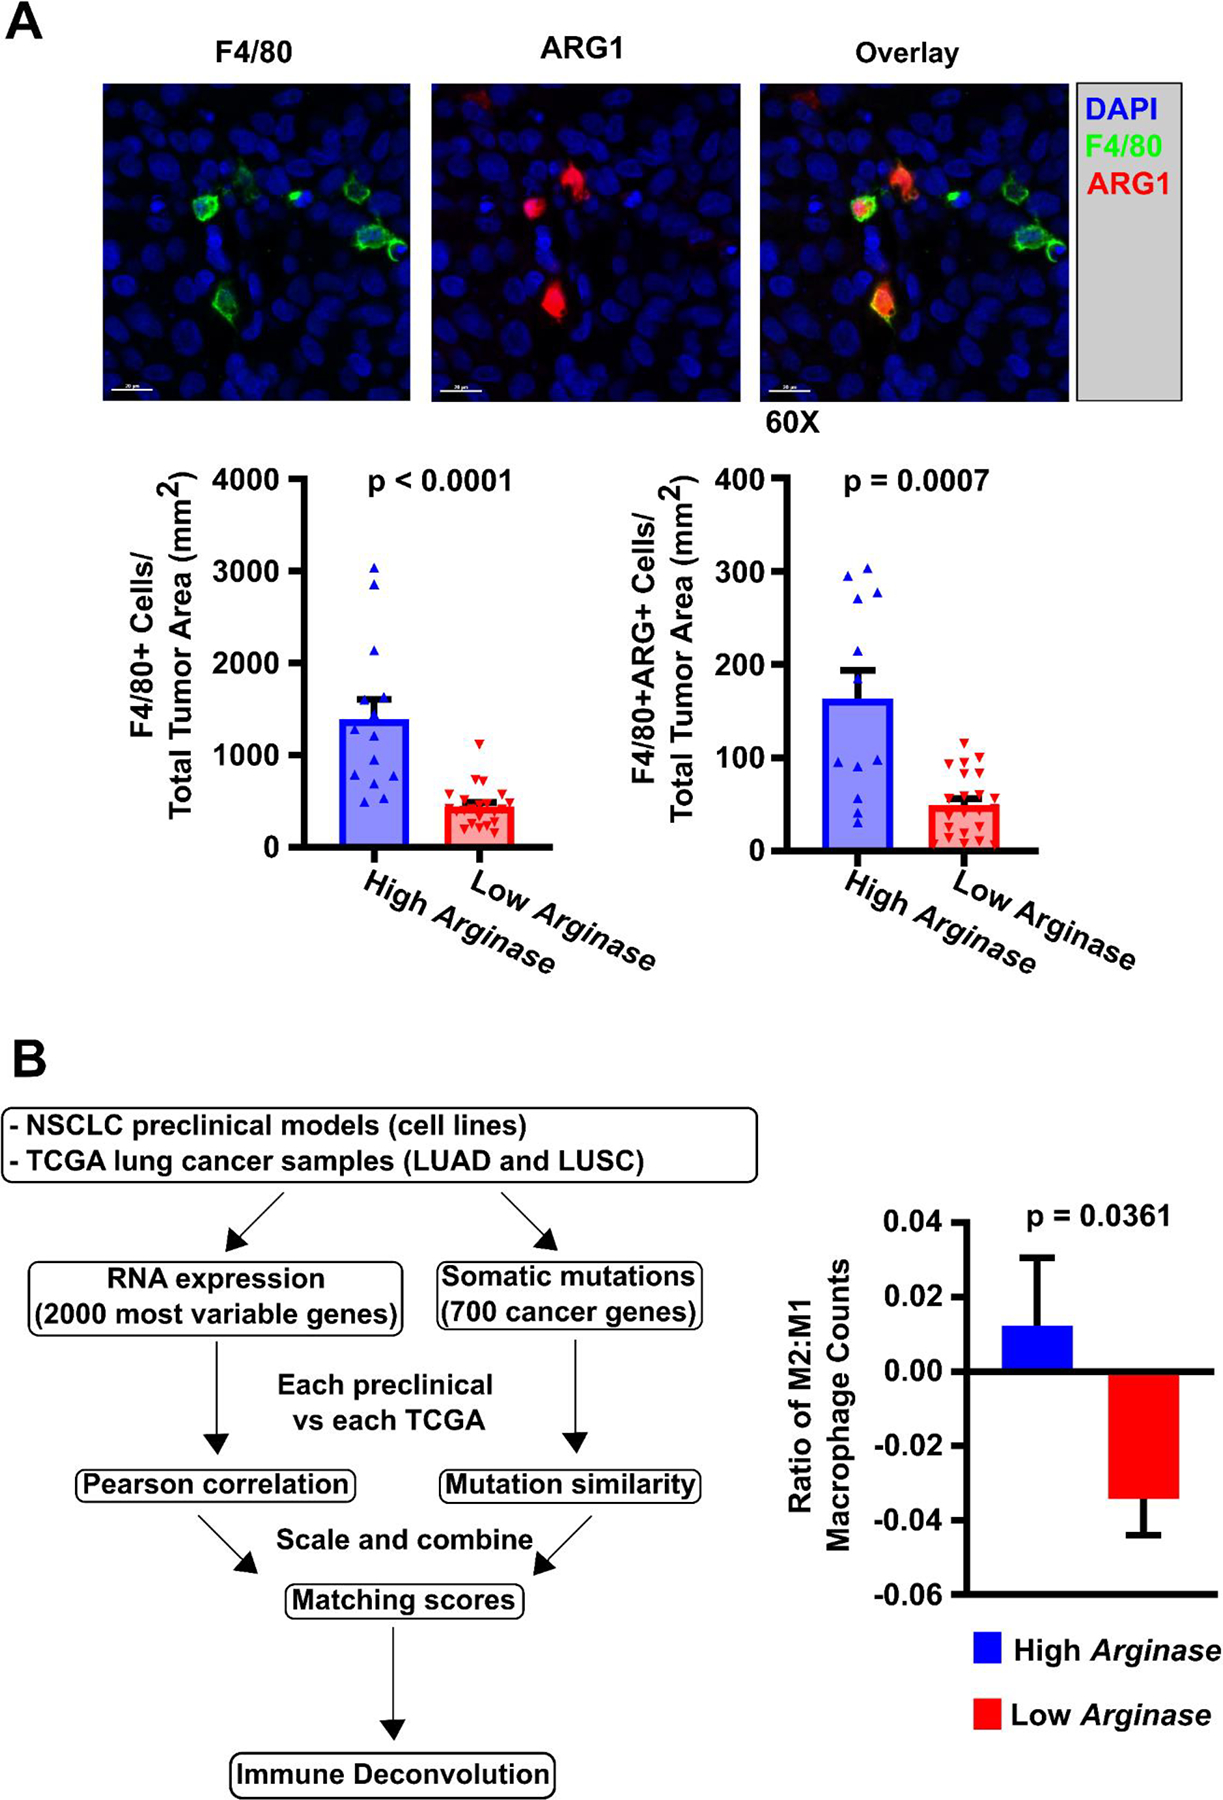
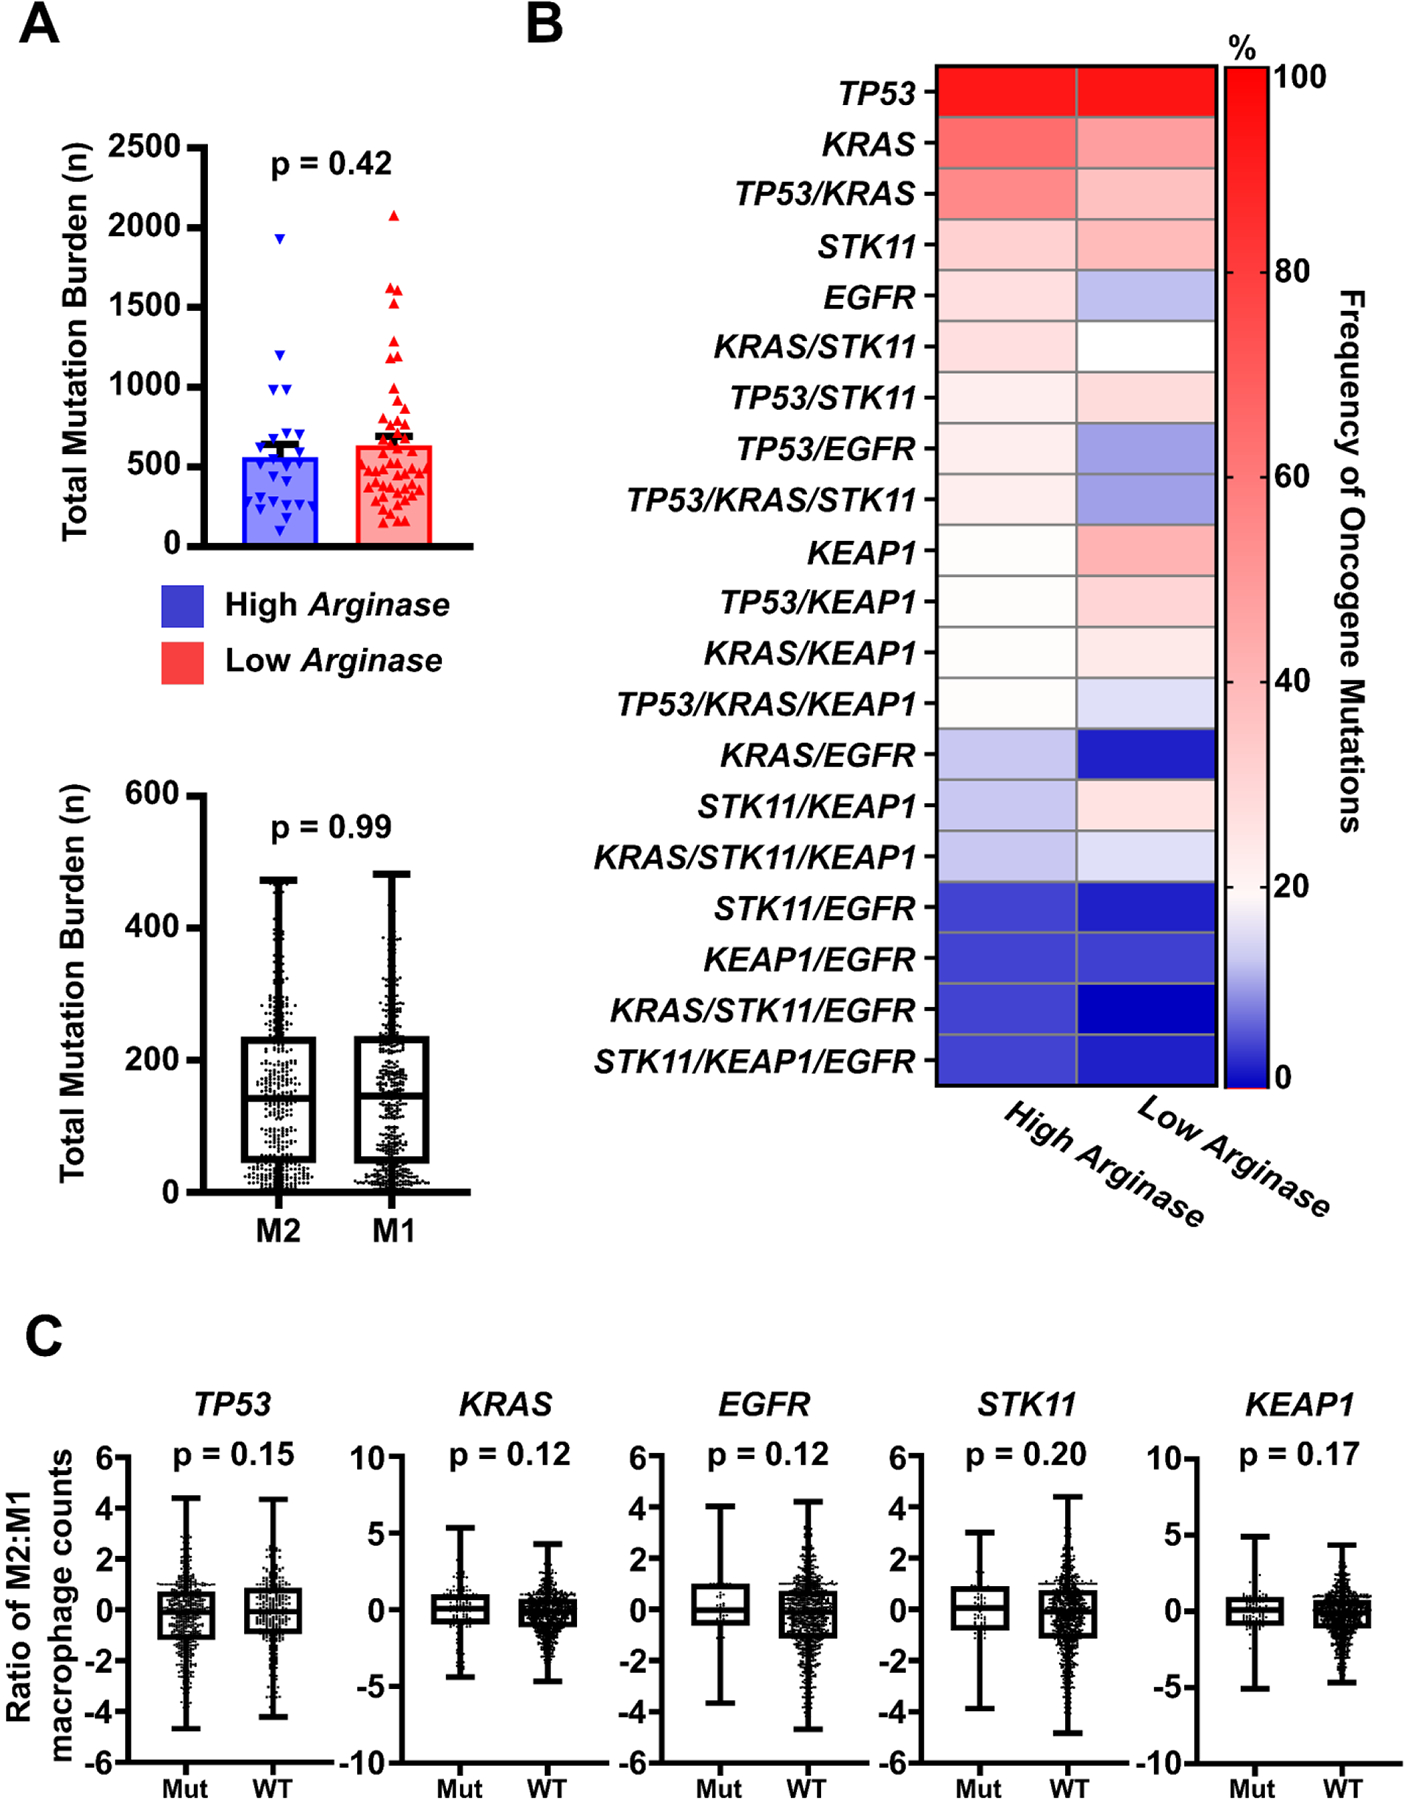
Results: A total of 72 NSCLC cell lines were studied. The most frequent highly induced macrophage-related gene was Arginase-1, reflecting an immunosuppressive M2-like phenotype. This was independent of multiple clinicopathologic factors, which also did not affect M2:M1 ratios in matched TCGA samples. In vivo, xenograft tumors established from high Arginase-1-inducing lines (Arghi) had a significantly elevated density of Arg1+ macrophages. Matched TCGA clinical samples to Arghi NSCLC lines had a significantly higher ratio of M2:M1 macrophages (p = 0.0361).

Conclusions: In our in vitro co-culture model, a large panel of patient-derived NSCLC lines most frequently induced high-expression Arginase-1 in co-cultured mouse macrophages, independent of major clinicopathologic and oncogenotype-related factors. Arghi cluster-matched TCGA tumors contained a higher ratio of M2:M1 macrophages. Thus, this in vitro model reproducibly characterizes how individual NSCLC modulates macrophage phenotype, correlates with macrophage polarization in clinical samples, and can serve as an accessible platform for further investigation of macrophage-specific therapeutic strategies.

Keywords: In vitro co-culture model; Macrophage phenotype; Non–small cell lung cancer; Tumor microenvironment.


Conflict of interest statement

Declarations of interest: JDM receives licensing fees from the NIH and UTSW for distribution of human tumor cell lines. The other authors have no potential conflicts of interest to declare.

Figures

Figure 1:
Figure 1:. Overview of study of induced macrophage phenotypes in NSCLC co-culture system.
Flowchart showing analytic workflows, integrating molecular and clinicopathologic characteristics, with macrophage phenotypes induced in the lung cancer multicellular co-culture model and the NSCLC cell line information with TCGA datasets. A) Lung Cancer Co-Culture System Assay. We performed co-cultures of NSCLC lines, CAFs, and mouse bone marrow-derived macrophages and assayed by quantitative mRNA expression of mouse macrophage genes by using species-specific primers at 40 hours to determine the induced macrophage phenotype. B) Clinicopathologic and Demographic Analyses. We investigated whether clinicopathologic and demographic data features, or specific mutations or mRNA expression patterns found in the NSCLC lines were correlated with the induced macrophage phenotypes. C) Oncogenotype Analysis and Clinical Correlation. Total mutational burden, copy number variants, and somatic mutation profiling data were abstracted from whole exome and RNAseq analysis from each NSCLC line. These molecular data were “matched” against TCGA molecular data in NSCLC clinical samples by comparing mRNA expression and specific mutations (see Methods) to assign a correlation (ranging from 0.0 to 1.0) between each NSCLC line and TCGA tumor sample. We then performed immune deconvolution using CIBERSORT to estimate immune cell populations in the TCGA bulk tumor data, focusing specifically on M2 and M1 macrophages and tested whether the NSCLC cell line-induced macrophage phenotypes were similar to macrophage phenotypes found in TCGA tumor samples most closely matched to each cell line.
Figure 2:
Figure 2:. NSCLC cells induce heterogeneous macrophage phenotypes in a multicellular in vitro co-culture model, most frequently, high expression of immunosuppressive Arginase-1.
A) Schematic of the NSCLC multicellular co-culture model setup. Co-cultures were comprised of: mouse macrophages (MΦ) isolated and differentiated from mouse bone marrow hematopoietic stem cells (5%) using mouse L929 conditioned media from published methods, human cancer-associated fibroblasts (CAFs) (25%), and cancer cell lines isolated from NSCLC patients (70%). RNA was extracted from individual co-cultures and qRT-PCR for mouse macrophage-specific genes was conducted. B) Comparison of dual co-cultures and multicellular co-cultures highlight the effects of addition of CAFs to induced macrophage phenotype. qRT-PCR transcriptional analysis of macrophage markers using species specific primers: Arginase-1, Il-6 and iNos. Cultures are dual co-cultures (2 cell types, CAFs and macrophages, or tumor cells and macrophages) or multicellular co-cultures (3 cell types, tumor cells, CAFs, and macrophages) using H2009 and H1819 NSCLC cell lines as examples (results from duplicate assays shown as dots in each bar graph). C) Heatmap of quantitative mRNA expression changes by qRT-PCR analysis of 6 mouse macrophage related genes after NSCLC, CAF, macrophage co-culture compared to culturing the macrophages alone (See Supplemental Materials and Methods). Raw fold change data were normalized to gene expression from macrophages alone. Each experiment included positive controls of macrophages alone treated with IL-4 (strong M2 phenotype induction) or LPS (strong M1 phenotype induction). Each row represents macrophage expression phenotype results average from technical quadruplicates and 3 biologic replicates for the indicated NSCLC cell line. (See Supplemental Figure 1.B for examples of fold changes in macrophage gene expression in the co-cultures). High expression of any given gene was characterized as relative fold change ≥75 from baseline and low expression was characterized as relative fold change <75 from baseline. 24/75 lines (32%) induced high expression of Arginase-1. 72 NSCLC cell lines, 2 SCLC lines and 3 benign individual cell lines were studied. D) qPCR findings of induced macrophage gene expression are conserved in bulk RNAseq analyses. Relative gene expression of 6 macrophage-relevant genes were correlated to expression in bulk RNAseq samples submitted for a large panel of NSCLC co-cultures. Human reads were filtered out and mouse gene expression of each target gene was correlated to our qPCR panel through Pearson correlation coefficient analyses. Arginase-1, Il1b, Il6, and iNos expressions were strongly consistent between qPCR and RNAseq analyses. 15 individual NSCLC cell lines were tested.
Figure 3:
Figure 3:. Macrophage phenotype induced in vitro are observed in vivo and in clinical samples from the TCGA.
A) Immunohistochemical staining of NSCLC xenografts for macrophage markers. NSCLC xenografts were established from 5 Arghi cluster lines (A427, H1373, H1666, H2009, H522) and 6 Arglow cluster lines (H1993, Calu-6, H460, H647, H2073, H441) using athymic nude mice with subcutaneously injected tumor cells (1×10⁶ cells/mouse) into the right flank to investigate induced macrophage phenotype in vivo (2–7 mice/NSCLC line). As an example, NSCLC xenograft NCI-H2073 was sectioned, immunohistochemically stained, and quantified for macrophage ARG1 expression. F4/80 was used as a co-localizing murine pan-macrophage marker, while staining for human pan-cytokeratin identified epithelial tumor cells. Those xenografts established from Arghi cluster lines had significantly median greater density of total F4/80+ macrophages and ARG+ macrophages. This was consistent with prior qRT-PCR mRNA macrophage expression results from the in vitro co-cultures. Significance was determined using Mann-Whitney U tests between cohorts. B) M2-macrophage phenotype found in NSCLC TCGA data by CIBERSORT analysis correlate with matched NSCLC line-induced macrophage phenotypes. B (left portion): Our NSCLC cell lines were matched to TCGA clinical samples through assessment of RNA expression and mutational profiles to generate a matching score between an individual NSCLC cell line and a “matched” TCGA patient sample (see Supplemental Methods: TCGA Matchup) 36 molecular matches were established. B (right portion): A significantly higher M2:M1 ratio of macrophages was identified through immune deconvolution (CIBERSORT) of TCGA patient data derived from samples that were “matched” (by mRNA expression and DNA mutation profiles) to NSCLC cell lines from the Arghi cluster. Significance was determined using a two-sided T-test. Mean ± SD.
Figure 4:
Figure 4:. Total mutation burden and key driver mutations characteristics of the NSCLC cell lines do not correlate with their induced macrophage phenotype in neither co-cultures nor clinical samples.
A) Total mutation burden. (Upper) Comparative analyses showed no significant differences in median total mutation burden between Arghi and Arglow cohorts between induced macrophage phenotype between cohorts through Mann-Whitney U tests. (Lower) Total mutational burden was investigated against TCGA-deposited patient samples which contained macrophages with higher M2:M1 (M2) or M1:M2 (M1) ratios on CIBERSORT analysis. No significant differences in total mutation burden was noted on Mann-Whitney U analysis, similar to the findings in our NSCLC-co-culture panel. B) Key Individual Driver Mutations. Frequency of key driver mutations and combinations of mutations were abstracted from cell lines in each cohort. The most commonly mutated genes regardless of cohort included TP53, KRAS, TP53/KRAS, STK11, and EGFR. No significant differences were noted in frequency of oncogene mutations between cohorts for any given single or combination of mutated oncogenes. Significance was determined using two-sided T-tests. Mean ± SD. C) Histology and Key Driver Mutations in TCGA Data and Associated Macrophages. Macrophage M1:M2 ratio determined via immune deconvolution (CIBERSORT) in TCGA NSCLC patient samples were not correlated with mutation status for TP53, KRAS, EGFR, STK11 and KEAP1. M2:M1 ratios between groups were compared through Mann-Whitney U tests. For all cell line analyses, 72 individual NSCLC cell lines were used. Available data from a total of 980 patient lung cancer samples were used for TCGA analyses.

References

    1. Ruiz-Cordero R, Devine WP. Targeted Therapy and Checkpoint Immunotherapy in Lung Cancer. Surg Pathol Clin 2020;13:17–33. - PubMed
    1. Zhang R, Zhu J, Liu Y, et al. Efficacy of immune checkpoint inhibitors in the treatment of non-small cell lung cancer patients with different genes mutation: A meta-analysis. Medicine 2021;100. - PMC - PubMed
    1. Haslam A, Prasad V. Estimation of the percentage of US patients with cancer who are eligible for and respond to checkpoint inhibitor immunotherapy drugs. JAMA network open 2019;2:e192535–e192535. - PMC - PubMed
    1. Poh AR, Ernst M. Targeting Macrophages in Cancer: From Bench to Bedside. Front Oncol 2018;8:49. - PMC - PubMed
    1. Cao L, Che X, Qiu X, et al. M2 macrophage infiltration into tumor islets leads to poor prognosis in non-small-cell lung cancer. Cancer Manag Res 2019;11:6125–6138. - PMC - PubMed

Publication types