

Pharmacokinetic Modeling of Warfarin ІI - Model-based Analysis of Warfarin Metabolites following Warfarin Administered either Alone or Together with Fluconazole or Rifampin
- PMID: 35798368
- PMCID: PMC9488977
- DOI: 10.1124/dmd.122.000877
Pharmacokinetic Modeling of Warfarin ІI - Model-based Analysis of Warfarin Metabolites following Warfarin Administered either Alone or Together with Fluconazole or Rifampin
Abstract
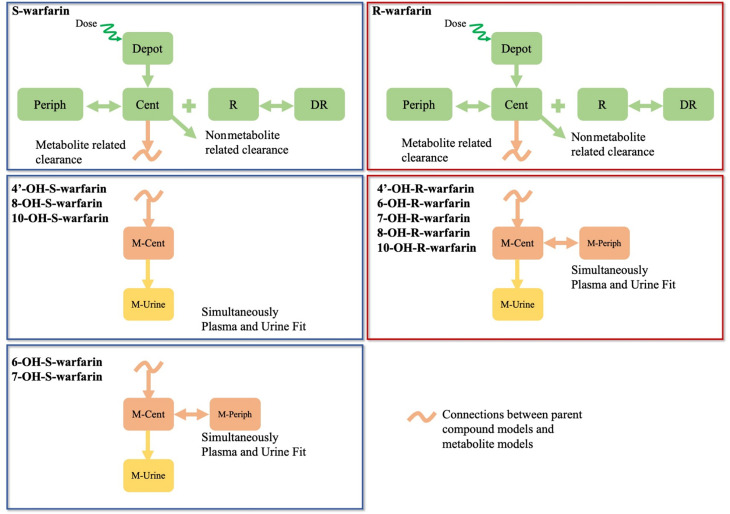
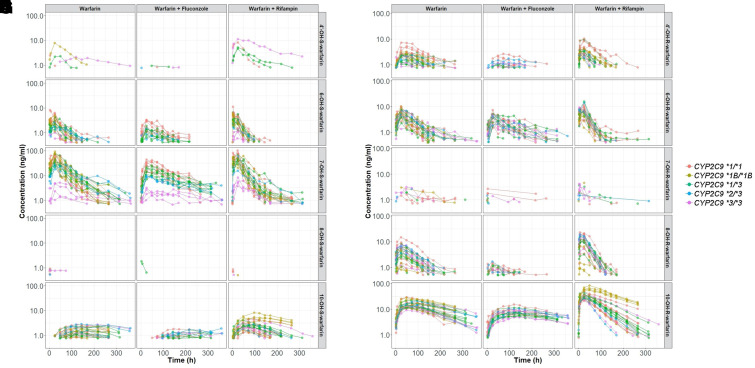
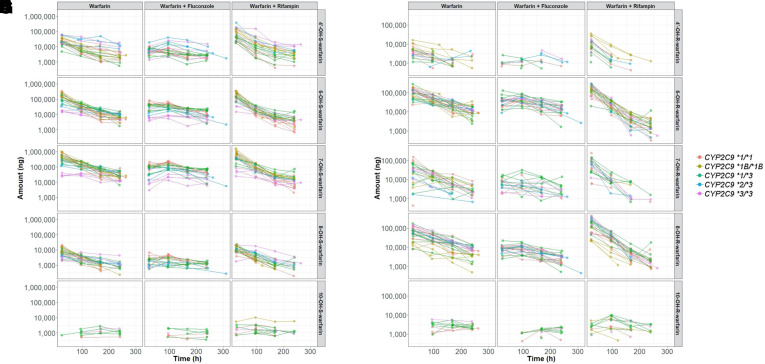
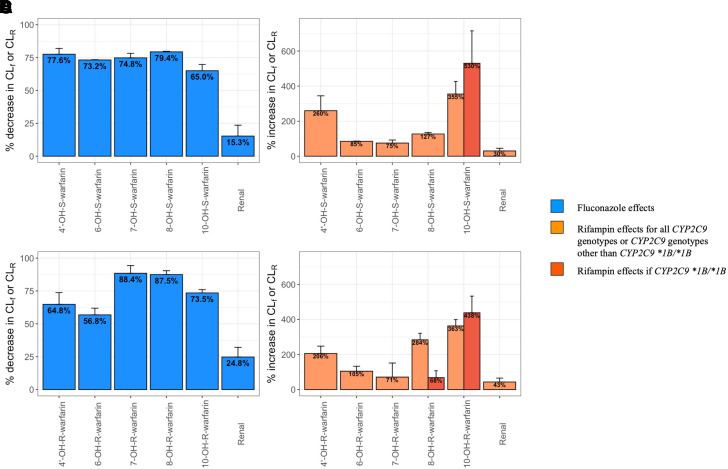
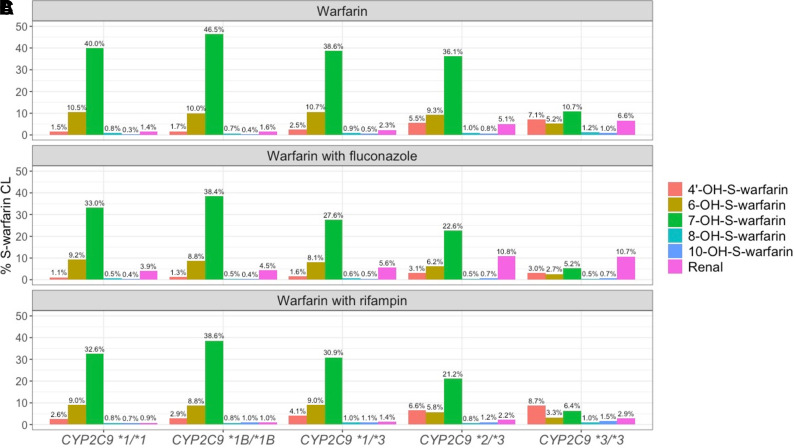
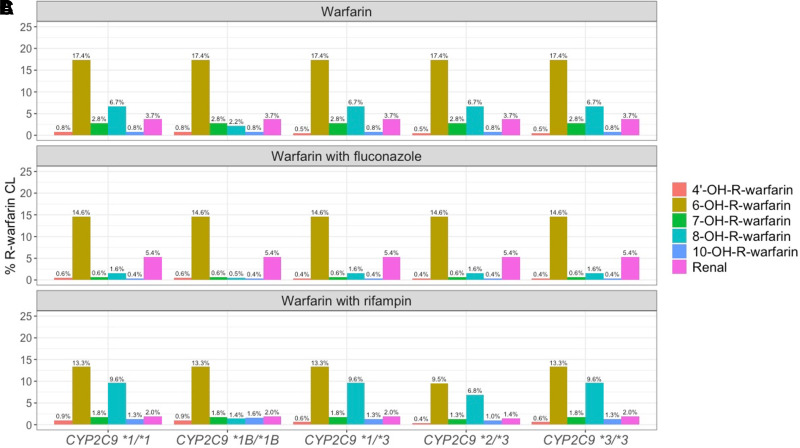
The objective of this study is to conduct a population pharmacokinetic (PK) model-based analysis on 10 warfarin metabolites (4'-, 6-, 7-, 8- and 10-hydroxylated (OH)-S- and R- warfarin), when warfarin is administered alone or together with either fluconazole or rifampin. One or two compartment PK models expanded from target mediated drug disposition (TMDD) models developed previously for warfarin enantiomers were able to sufficiently characterize the PK profiles of 10 warfarin metabolites in plasma and urine under different conditions. Model-based analysis shows CYP2C9 mediated metabolic elimination pathways are more inhibitable by fluconazole (% formation CL (CLf) of 6- and 7-OH-S-warfarin decrease: 73.2% and 74.8%) but less inducible by rifampin (% CLf of 6- and 7-OH-S-warfarin increase: 85% and 75%), compared with non-CYP2C9 mediated elimination pathways (% CLf of 10-OH-S-warfarin and CLR of S-warfarin decrease in the presence of fluconazole: 65.0% and 15.3%; % CLf of 4'- 8- and 10-OH-S-warfarin increase in the presence of rifampin: 260%, 127% and 355%), which potentially explains the CYP2C9 genotype-dependent DDIs exhibited by S-warfarin, when warfarin is administrated together with fluconazole or rifampin. Additionally, for subjects with CYP2C9 *2 and *3 variants, a model-based analysis of warfarin metabolite profiles in subjects with various CYP2C9 genotypes demonstrates CYP2C9 mediated elimination is less important and non-CYP2C9 mediated elimination is more important, compared with subjects without these variants. To our knowledge, this is so far one of the most comprehensive population-based PK analyses of warfarin metabolites in subjects with various CYP2C9 genotypes under different co-medications. Significance Statement The studies we wish to publish are potentially impactful. The need for a TMDD pharmacokinetic model and the demonstration of genotyped-dependent drug interactions may explain the extensive variability in dose-response relationships that are seen in the clinical dose adjustments of warfarin.
Keywords: drug-drug interactions; genetic polymorphism; pharmacokinetic modeling.
Copyright © 2020 American Society for Pharmacology and Experimental Therapeutics.
Figures
Similar articles
-
Pharmacokinetic Modeling of Warfarin І - Model-based Analysis of Warfarin Enantiomers with a Target Mediated Drug Disposition Model Reveals CYP2C9 Genotype-dependent Drug-drug Interactions of S-Warfarin.Drug Metab Dispos. 2022 Jul 7;50(9):1287-301. doi: 10.1124/dmd.122.000876. Drug Metab Dispos. 2022. PMID: 35798369 Free PMC article.
-
A Physiological-Based Pharmacokinetic Model Embedded with a Target-Mediated Drug Disposition Mechanism Can Characterize Single-Dose Warfarin Pharmacokinetic Profiles in Subjects with Various CYP2C9 Genotypes under Different Cotreatments.Drug Metab Dispos. 2023 Feb;51(2):257-267. doi: 10.1124/dmd.122.001048. Epub 2022 Nov 15. Drug Metab Dispos. 2023. PMID: 36379708 Free PMC article.
-
A physiologically-based pharmacokinetic/pharmacodynamic modeling approach for drug-drug-gene interaction evaluation of S-warfarin with fluconazole.CPT Pharmacometrics Syst Pharmacol. 2024 May;13(5):853-869. doi: 10.1002/psp4.13123. Epub 2024 Mar 15. CPT Pharmacometrics Syst Pharmacol. 2024. PMID: 38487942 Free PMC article.
-
Pharmacogenetics of warfarin elimination and its clinical implications.Clin Pharmacokinet. 2001;40(8):587-603. doi: 10.2165/00003088-200140080-00003. Clin Pharmacokinet. 2001. PMID: 11523725 Review.
-
Pharmacokinetic interactions between etravirine and non-antiretroviral drugs.Clin Pharmacokinet. 2011 Jan;50(1):25-39. doi: 10.2165/11534740-000000000-00000. Clin Pharmacokinet. 2011. PMID: 21142266 Review.
Cited by
-
Pharmacokinetic Modeling of Warfarin І - Model-based Analysis of Warfarin Enantiomers with a Target Mediated Drug Disposition Model Reveals CYP2C9 Genotype-dependent Drug-drug Interactions of S-Warfarin.Drug Metab Dispos. 2022 Jul 7;50(9):1287-301. doi: 10.1124/dmd.122.000876. Drug Metab Dispos. 2022. PMID: 35798369 Free PMC article.
-
A Physiological-Based Pharmacokinetic Model Embedded with a Target-Mediated Drug Disposition Mechanism Can Characterize Single-Dose Warfarin Pharmacokinetic Profiles in Subjects with Various CYP2C9 Genotypes under Different Cotreatments.Drug Metab Dispos. 2023 Feb;51(2):257-267. doi: 10.1124/dmd.122.001048. Epub 2022 Nov 15. Drug Metab Dispos. 2023. PMID: 36379708 Free PMC article.
-
Predictive performance of population pharmacokinetic models of imatinib in chronic myeloid leukemia patients.Cancer Chemother Pharmacol. 2024 Jul;94(1):35-44. doi: 10.1007/s00280-024-04644-w. Epub 2024 Mar 5. Cancer Chemother Pharmacol. 2024. PMID: 38441626 Free PMC article.
References
-
- Ahn JE, Karlsson MO, Dunne A, Ludden TM (2008) Likelihood based approaches to handling data below the quantification limit using NONMEM VI. J Pharmacokinet Pharmacodyn 35:401–421. - PubMed
-
- Ansell J, Hirsh J, Hylek E, Jacobson A, Crowther M, Palareti G (2008) Pharmacology and management of the vitamin K antagonists: American College of Chest Physicians Evidence-Based Clinical Practice Guidelines (8th Edition). Chest 133:160S–198S. - PubMed
-
- Bauer RJ (2015) NONMEM Users Guide: Introduction to NONMEM 7.3.0, Gaithersburg, Maryland.
Grants and funding
LinkOut - more resources
Full Text Sources