

Pharmacokinetic Modeling of Warfarin І - Model-based Analysis of Warfarin Enantiomers with a Target Mediated Drug Disposition Model Reveals CYP2C9 Genotype-dependent Drug-drug Interactions of S-Warfarin
- PMID: 35798369
- PMCID: PMC9488981
- DOI: 10.1124/dmd.122.000876
Pharmacokinetic Modeling of Warfarin І - Model-based Analysis of Warfarin Enantiomers with a Target Mediated Drug Disposition Model Reveals CYP2C9 Genotype-dependent Drug-drug Interactions of S-Warfarin
Abstract
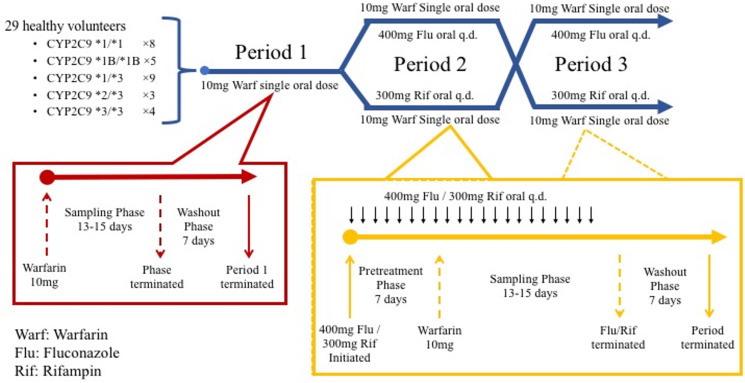
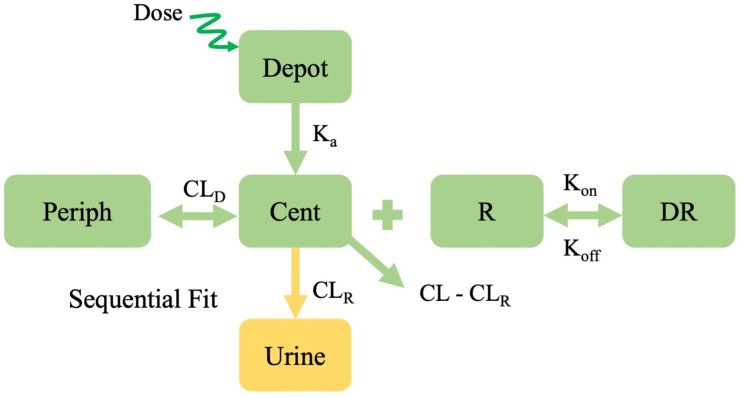
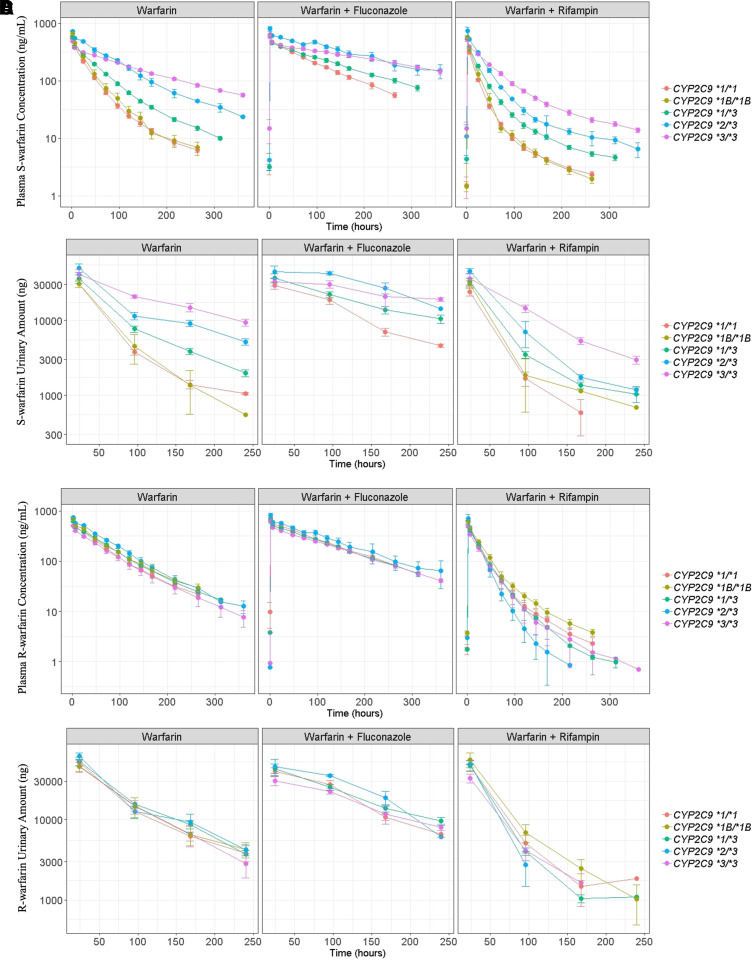
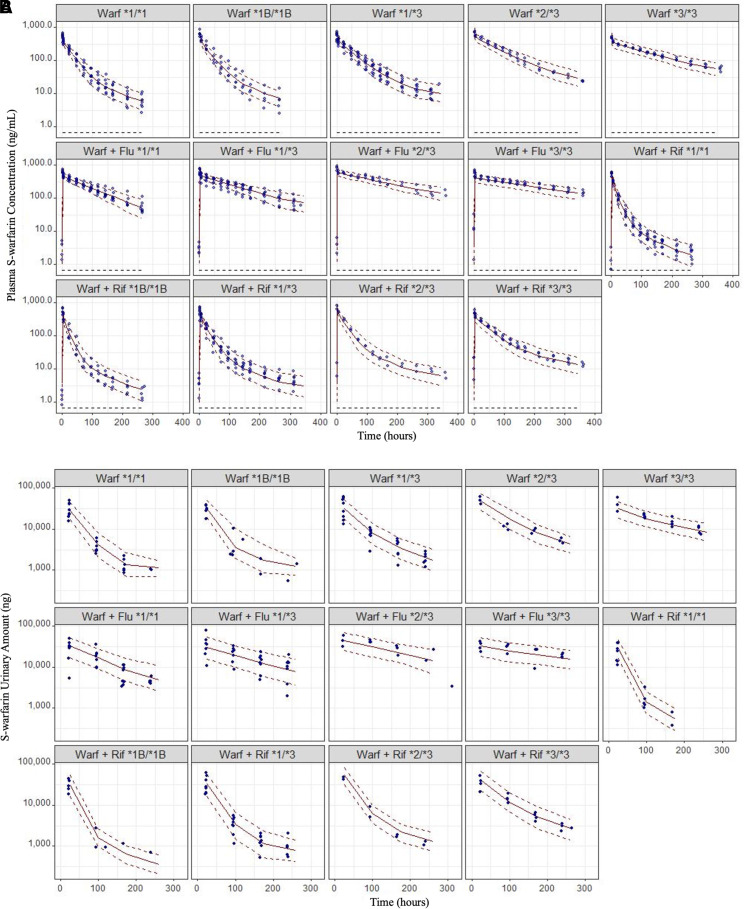
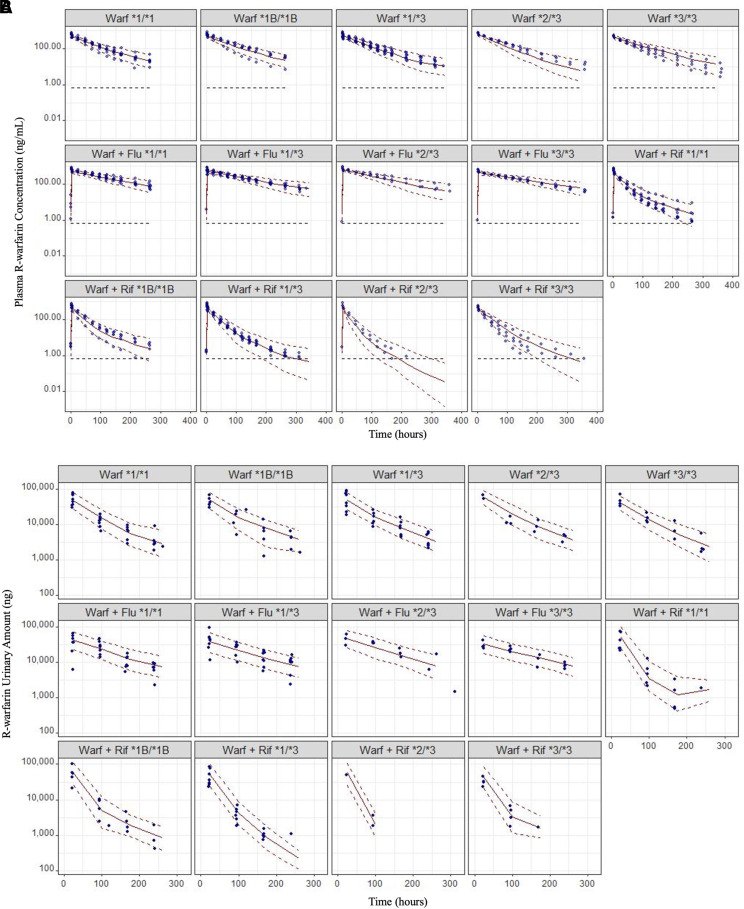
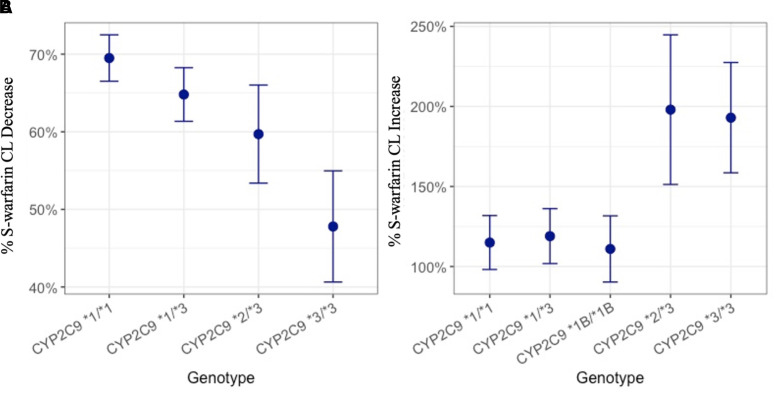
The objective of this study is to characterize the impact of CYP2C9 genotype on warfarin drug-drug interactions when warfarin is taken together with fluconazole, a cytochrome P450 (CYP) inhibitor, or rifampin, a CYP inducer with a nonlinear mixed effect modeling approach. A target mediated drug disposition model with a urine compartment was necessary to characterize both S-warfarin and R-warfarin plasma and urine pharmacokinetic profiles sufficiently. Following the administration of fluconazole, our study found subjects with CYP2C9 *2 or *3 alleles experience smaller changes in S-warfarin CL compared with subjects without these alleles (69.5%, 64.8%, 59.7% and 47.8% decrease in subjects with CYP2C9 *1/*1, *1/*3, *2/*3 and *3/*3 respectively). Whereas, following the administration of rifampin, subjects with CYP2C9 *2/*3 or CYP2C9 *3/*3 experience larger changes in S-warfarin CL compared with subjects with at least one copy of CYP2C9 *1 or *1B (115%, 111%, 119%, 198% and 193% increase in subjects with CYP2C9 *1/*1, *1B/*1B, *1/*3, *2/*3 and *3/*3 respectively). The results suggest different dose adjustments are potentially required for patients with different CYP2C9 genotypes if warfarin is administered together with CYP inhibitors or inducers. Significance Statement The present study found a target mediated drug disposition model is needed to sufficiently characterize the clinical pharmacokinetic profiles of warfarin racemates under different co-treatments in subjects with various CYP2C9 genotypes, following a single dose of warfarin administration. The study also found S-warfarin, the pharmacologically more active ingredient in warfarin, exhibits CYP2C9 genotype-dependent drug-drug interactions, which indicates the dose of warfarin may need to be adjusted differently in subjects with different CYP2C9 genotypes in the presence of drug-drug interactions.
Keywords: drug-drug interactions; genetic polymorphism; pharmacokinetic modeling.
Copyright © 2020 American Society for Pharmacology and Experimental Therapeutics.
Figures
Similar articles
-
A Physiological-Based Pharmacokinetic Model Embedded with a Target-Mediated Drug Disposition Mechanism Can Characterize Single-Dose Warfarin Pharmacokinetic Profiles in Subjects with Various CYP2C9 Genotypes under Different Cotreatments.Drug Metab Dispos. 2023 Feb;51(2):257-267. doi: 10.1124/dmd.122.001048. Epub 2022 Nov 15. Drug Metab Dispos. 2023. PMID: 36379708 Free PMC article.
-
Pharmacokinetic Modeling of Warfarin ІI - Model-based Analysis of Warfarin Metabolites following Warfarin Administered either Alone or Together with Fluconazole or Rifampin.Drug Metab Dispos. 2022 Jul 7;50(9):1302-11. doi: 10.1124/dmd.122.000877. Drug Metab Dispos. 2022. PMID: 35798368 Free PMC article.
-
S-warfarin limited sampling strategy with a population pharmacokinetic approach to estimate exposure and cytochrome P450 (CYP) 2C9 activity in healthy adults.Eur J Clin Pharmacol. 2021 Sep;77(9):1349-1356. doi: 10.1007/s00228-021-03123-y. Epub 2021 Mar 23. Eur J Clin Pharmacol. 2021. PMID: 33754183
-
Pharmacogenetics of warfarin elimination and its clinical implications.Clin Pharmacokinet. 2001;40(8):587-603. doi: 10.2165/00003088-200140080-00003. Clin Pharmacokinet. 2001. PMID: 11523725 Review.
-
Pharmacokinetic interactions between etravirine and non-antiretroviral drugs.Clin Pharmacokinet. 2011 Jan;50(1):25-39. doi: 10.2165/11534740-000000000-00000. Clin Pharmacokinet. 2011. PMID: 21142266 Review.
Cited by
-
Drug-Drug-Gene Interactions in Cardiovascular Medicine.Pharmgenomics Pers Med. 2022 Nov 2;15:879-911. doi: 10.2147/PGPM.S338601. eCollection 2022. Pharmgenomics Pers Med. 2022. PMID: 36353710 Free PMC article. Review.
-
A Physiological-Based Pharmacokinetic Model Embedded with a Target-Mediated Drug Disposition Mechanism Can Characterize Single-Dose Warfarin Pharmacokinetic Profiles in Subjects with Various CYP2C9 Genotypes under Different Cotreatments.Drug Metab Dispos. 2023 Feb;51(2):257-267. doi: 10.1124/dmd.122.001048. Epub 2022 Nov 15. Drug Metab Dispos. 2023. PMID: 36379708 Free PMC article.
-
A physiologically-based pharmacokinetic/pharmacodynamic modeling approach for drug-drug-gene interaction evaluation of S-warfarin with fluconazole.CPT Pharmacometrics Syst Pharmacol. 2024 May;13(5):853-869. doi: 10.1002/psp4.13123. Epub 2024 Mar 15. CPT Pharmacometrics Syst Pharmacol. 2024. PMID: 38487942 Free PMC article.
-
A systematic review on sex differences in adverse drug reactions related to psychotropic, cardiovascular, and analgesic medications.Front Pharmacol. 2023 May 2;14:1096366. doi: 10.3389/fphar.2023.1096366. eCollection 2023. Front Pharmacol. 2023. PMID: 37201021 Free PMC article.
-
Pharmacokinetic Modeling of Warfarin ІI - Model-based Analysis of Warfarin Metabolites following Warfarin Administered either Alone or Together with Fluconazole or Rifampin.Drug Metab Dispos. 2022 Jul 7;50(9):1302-11. doi: 10.1124/dmd.122.000877. Drug Metab Dispos. 2022. PMID: 35798368 Free PMC article.
References
-
- Ahn JE, Karlsson MO, Dunne A, Ludden TM (2008) Likelihood based approaches to handling data below the quantification limit using NONMEM VI. J Pharmacokinet Pharmacodyn 35:401–421. - PubMed
-
- An G (2017) Small-Molecule Compounds Exhibiting Target-Mediated Drug Disposition (TMDD): A Minireview. J Clin Pharmacol 57:137–150. - PubMed
-
- An G, Liu W, Dutta S (2015) Small-molecule compounds exhibiting target-mediated drug disposition - A case example of ABT-384. J Clin Pharmacol 55:1079–1085. - PubMed
-
- Bach T, Jiang Y, Zhang X, An G (2019) General Pharmacokinetic Features of Small-Molecule Compounds Exhibiting Target-Mediated Drug Disposition (TMDD): A Simulation-Based Study. J Clin Pharmacol 59:394–405. - PubMed
Grants and funding
LinkOut - more resources
Full Text Sources