

Trends and Disparities in Cardiometabolic Health Among U.S. Adults, 1999-2018
- PMID: 35798448
- PMCID: PMC10475326
- DOI: 10.1016/j.jacc.2022.04.046
Trends and Disparities in Cardiometabolic Health Among U.S. Adults, 1999-2018
Abstract
Background: Few studies have assessed U.S. cardiometabolic health trends-optimal levels of multiple risk factors and absence of clinical cardiovascular disease (CVD)-or its impact on health disparities.
Objectives: The purpose of this study was to investigate U.S. trends in optimal cardiometabolic health from 1999 to 2018.
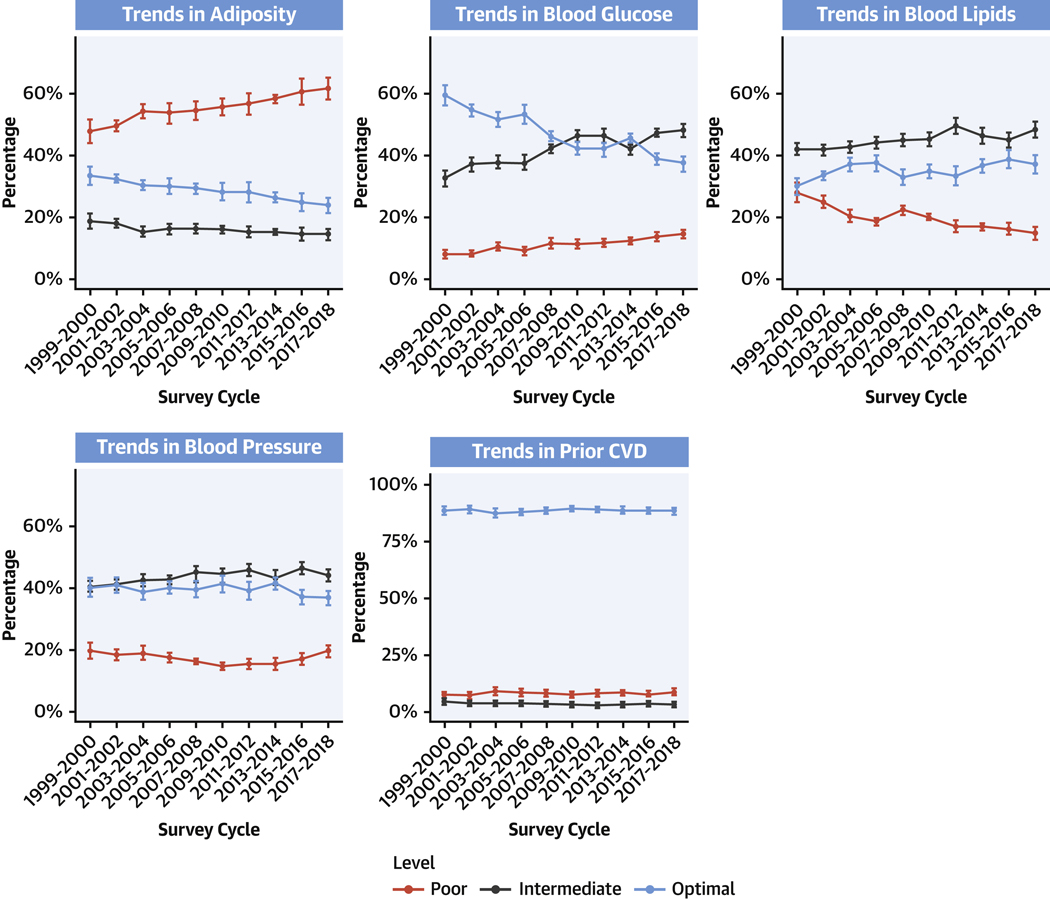
Methods: We assessed proportions of adults with optimal cardiometabolic health, based on adiposity, blood glucose, blood lipids, blood pressure, and clinical CVD; and optimal, intermediate, and poor levels of each component among 55,081 U.S. adults in the National Health and Nutrition Examination Survey.
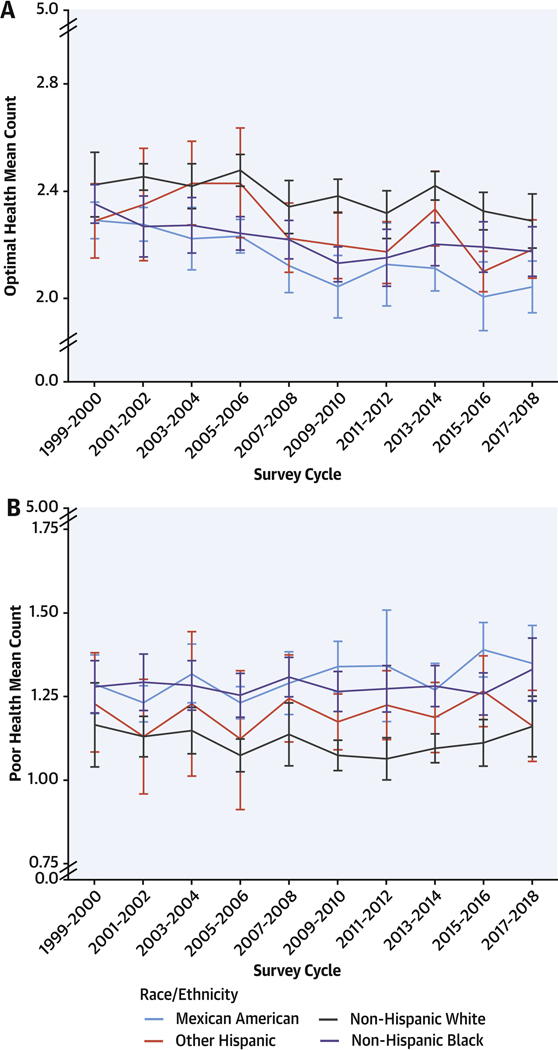
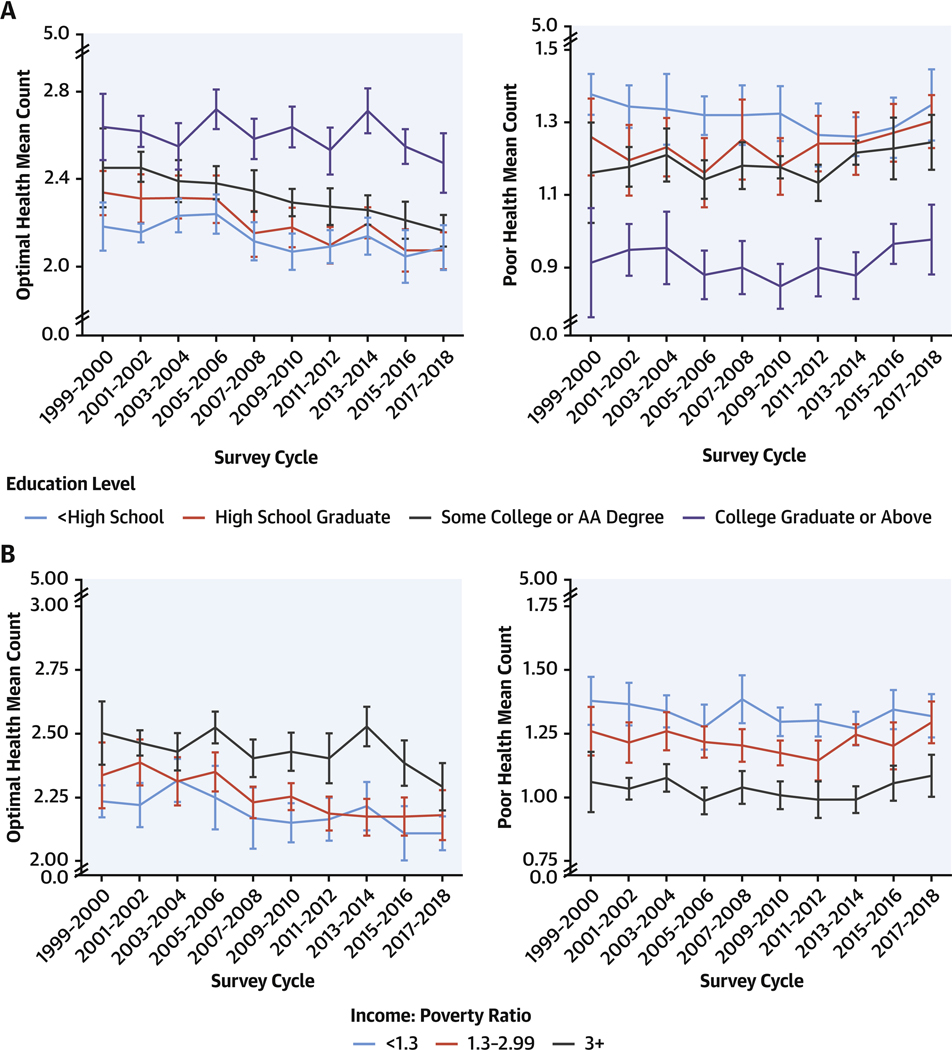
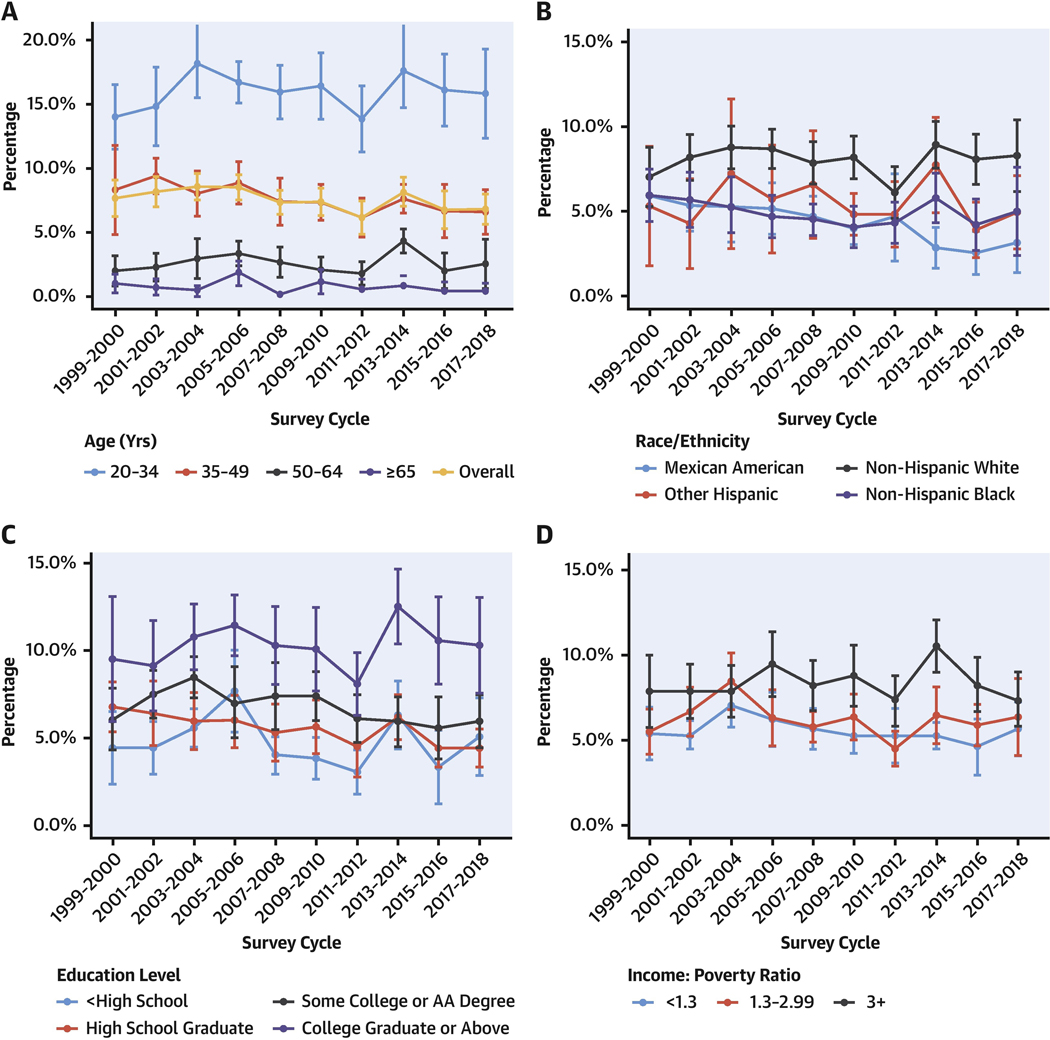
Results: In 2017-2018, only 6.8% (95% CI: 5.4%-8.1%) of U.S. adults had optimal cardiometabolic health, declining from 1999-2000 (P trend = 0.02). Among components of cardiometabolic health, the largest declines were for adiposity (optimal levels: 33.8%-24.0%; poor levels: 47.7%-61.9%) and glucose (optimal levels: 59.4%-36.9%; poor levels: 8.6%-13.7%) (P trend <0.001 for each). Optimal levels of blood lipids increased from 29.9%-37.0%, whereas poor decreased from 28.3%-14.7% (P trend <0.001). Trends over time for blood pressure and CVD were smaller. Disparities by age, sex, education, and race/ethnicity were evident in all years, and generally worsened over time. By 2017-2018, prevalence of optimal cardiometabolic health was lower among Americans with lower (5.0% [95% CI: 2.8%-7.2%]) vs higher education (10.3% [95% CI: 7.6%-13.0%]); and among Mexican American (3.2% [95% CI: 1.4%-4.9%]) vs non-Hispanic White (8.4% [95% CI: 6.3%-10.4%]) adults.
Conclusions: Between 1999 and 2000 and 2017 and 2018, U.S. cardiometabolic health has been poor and worsening, with only 6.8% of adults having optimal cardiometabolic health, and disparities by age, sex, education, and race/ethnicity. These novel findings inform the need for nationwide clinical and public health interventions to improve cardiometabolic health and health equity.
Keywords: cardiometabolic health; diabetes; health disparities; metabolic syndrome; obesity.
Copyright © 2022 American College of Cardiology Foundation. Published by Elsevier Inc. All rights reserved.
Conflict of interest statement
Funding Support and Author Disclosures This research was supported by the National Institutes of Health and the National Heart, Lung, and Blood Institute, Bethesda, Maryland (grant 2R01HL115189-06A1 to Dr Mozaffarian). The funding agency did not contribute to the design or conduct of the study; collection, management, analysis, or interpretation of the data; preparation, review, or approval of the manuscript; or the decision to submit the manuscript for publication. All authors have received research funding from the National Institutes of Health. Dr Mozaffarian has received additional research funding from the Gates Foundation, the Rockefeller Foundation, and Vail Institute for Global Research; is on the scientific advisory board for Beren Therapeutics, Calibrate, DayTwo (ended 6/20), Elysium Health, Filtricine, Foodome, HumanCo, January Inc., Perfect Day, Season, and Tiny Organics; all outside the submitted work. Dr Wong has membership in the U.S. Preventive Services Task Force, outside the submitted work. Ms Lauren has received personal fees from Abt Associates and the Centers for Disease Control and Prevention, both outside the submitted work.
Figures
Comment in
-
Failing Cardiovascular Health: A Population Code Blue.J Am Coll Cardiol. 2022 Jul 12;80(2):152-154. doi: 10.1016/j.jacc.2022.05.008. J Am Coll Cardiol. 2022. PMID: 35798449 No abstract available.
References
-
- Lloyd-Jones DM, Hong Y, Labarthe D, et al. Defining and setting national goals for cardiovascular health promotion and disease reduction: the American Heart Association’s strategic Impact Goal through 2020 and beyond. Circulation. 2010;121(4):586–613. 10.1161/circulationaha.109.192703 - DOI - PubMed
-
- Caspard H, Jabbour S, Hammar N, Fenici P, Sheehan JJ, Kosiborod M. Recent trends in the prevalence of type 2 diabetes and the association with abdominal obesity lead to growing health disparities in the USA: an analysis of the NHANES surveys from 1999 to 2014. Diabetes Obes Metab. 2018;20(3): 667–671. 10.1111/dom.13143 - DOI - PMC - PubMed
Publication types
MeSH terms
Grants and funding
LinkOut - more resources
Full Text Sources
