. 2022 Jul 7;11(1):215.
doi: 10.1038/s41377-022-00911-8.

Full experimental determination of tunneling time with attosecond-scale streaking method

Affiliations

Full experimental determination of tunneling time with attosecond-scale streaking method

Miao Yu et al. Light Sci Appl. .

Abstract

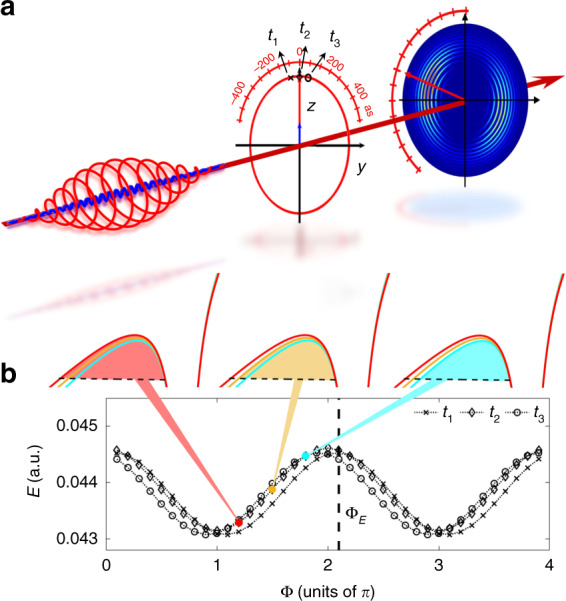
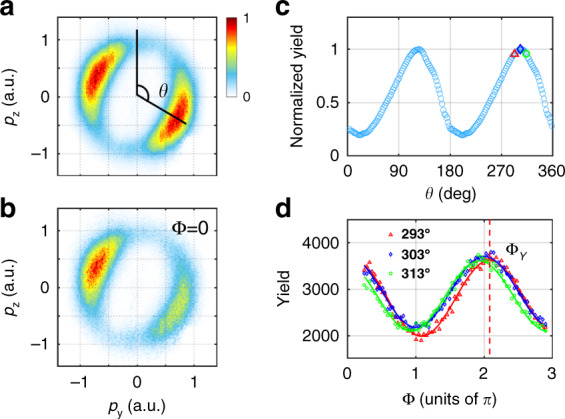
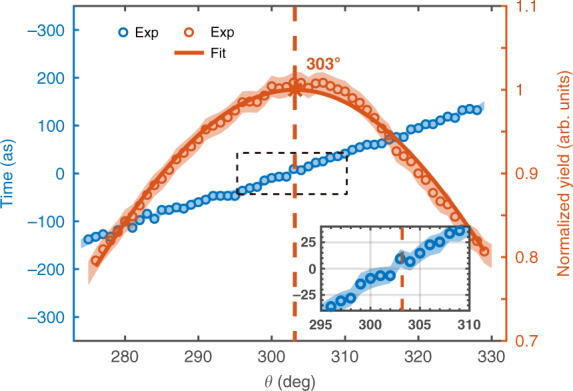
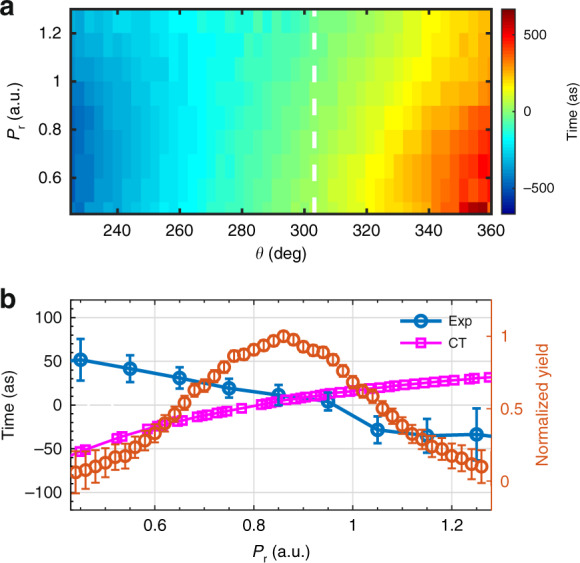
Tunneling is one of the most fundamental and ubiquitous processes in the quantum world. The question of how long a particle takes to tunnel through a potential barrier has sparked a long-standing debate since the early days of quantum mechanics. Here, we propose and demonstrate a novel scheme to accurately determine the tunneling time of an electron. In this scheme, a weak laser field is used to streak the tunneling current produced by a strong elliptically polarized laser field in an attoclock configuration, allowing us to retrieve the tunneling ionization time relative to the field maximum with a precision of a few attoseconds. This overcomes the difficulties in previous attoclock measurements wherein the Coulomb effect on the photoelectron momentum distribution has to be removed with theoretical models and it requires accurate information of the driving laser fields. We demonstrate that the tunneling time of an electron from an atom is close to zero within our experimental accuracy. Our study represents a straightforward approach toward attosecond time-resolved imaging of electron motion in atoms and molecules.


Conflict of interest statement

The authors declare no competing interests.

Figures

Fig. 1
Fig. 1. Attosecond-scale streaking scheme for measuring the tunneling ionization time.
a An elliptically polarized 800-nm laser pulse maps the tunneling ionization time to the emission angle of the photoelectron in attoclock configurations. A perturbative SH field polarized along the major axis of the fundamental laser ellipse (z axis) is added to precisely determine the tunneling ionization time of the photoelectron in the momentum distribution relative to the instant of the laser-field maximum (t0 = 0). b The electric field strength |E| for three instants, as indicated in (a), slightly oscillates with the relative phase Φ, revealing different phase delays of ΦE, as indicated by the vertical dashed line. The variation of the electric field strength leads to a slight change of the tunneling barrier width. Due to the pronounced nonlinearity of tunneling ionization, the tunneling current will be strongly modulated by the relative phase
Fig. 2
Fig. 2. Measured PMDs and electron yields.
The measured PMDs in the polarization plane (a) for an average of all relative phases and (b) for the relative phase of zero. The electron emission angle θ is defined between the electron emission direction relative to the major axis of the elliptically polarized laser field. c The radially integrated PAD of (a). d The electron yield as a function of the relative phase for three emission angles (293°, 303°, and 313°) in angular bins of 1°. The solid lines in (d) are the fit of the experimental data. ΔΦY for the emission angle of 293° is indicated by the dashed vertical line
Fig. 3
Fig. 3. Measured tunneling ionization time with respect to the electron emission angle.
For comparison, the radially integrated PAD is shown by the red circles, which is fitted with a Gaussian function (red solid curve) determining the peak of the PAD (vertical dashed line). The inset shows the enlarged view of the region inside the dashed frame. Note that zero time corresponds to the field maximum of the elliptically polarized laser pulse. The experimental errors (shaded area) for the time show the 95% confidence interval for the fitting process, and those for the photoelectron yield show the standard deviation of the statistical errors
Fig. 4
Fig. 4. Energy- and angle-resolved tunneling ionization time.
a The extracted tunneling ionization time with respect to the electron momentum pr and the electron emission angle from the measurement. b The lineout taken at the emission angle of 303° from (a). The prediction by the classical-trajectory (CT) model is shown by the squares. For comparison, the normalized yield as a function of the electron momentum at θ = 303° is shown by the red circles. The error bars for the ionization time show the 95% confidence interval for the fitting process, and those for the photoelectron yield show the standard deviation of the statistical errors

References

    1. Krausz F, Ivanov M. Attosecond physics. Rev. Mod. Phys. 2009;81:163–234. doi: 10.1103/RevModPhys.81.163. - DOI
    1. Schultze M, et al. Delay in photoemission. Science. 2010;328:1658–1662. doi: 10.1126/science.1189401. - DOI - PubMed
    1. Yang Z, et al. All-optical attosecond time domain interferometry. Natl Sci. Rev. 2021;8:nwaa211. doi: 10.1093/nsr/nwaa211. - DOI - PMC - PubMed
    1. McPherson A, et al. Studies of multiphoton production of vacuum-ultraviolet radiation in the rare gases. J. Optical Soc. Am. B. 1987;4:595–601. doi: 10.1364/JOSAB.4.000595. - DOI
    1. Ferray M, et al. Multiple-harmonic conversion of 1064 nm radiation in rare gases. J. Phys. B: At., Mol. Optical Phys. 1988;21:L31. doi: 10.1088/0953-4075/21/3/001. - DOI

LinkOut - more resources