. 2022 Jul 7;13(1):3921.
doi: 10.1038/s41467-022-30763-0.

Characterization of SARS-CoV-2 Spike mutations important for infection of mice and escape from human immune sera

Collaborators, Affiliations

Characterization of SARS-CoV-2 Spike mutations important for infection of mice and escape from human immune sera

Raveen Rathnasinghe et al. Nat Commun. .

Abstract

Due to differences in human and murine angiotensin converting enzyme 2 (ACE-2) receptor, initially available SARS-CoV-2 isolates could not infect mice. Here we show that serial passaging of USA-WA1/2020 strain in mouse lungs results in "mouse-adapted" SARS-CoV-2 (MA-SARS-CoV-2) with mutations in S, M, and N genes, and a twelve-nucleotide insertion in the S gene. MA-SARS-CoV-2 infection causes mild disease, with more pronounced morbidity depending on genetic background and in aged and obese mice. Two mutations in the S gene associated with mouse adaptation (N501Y, H655Y) are present in SARS-CoV-2 variants of concern (VoCs). N501Y in the receptor binding domain of viruses of the B.1.1.7, B.1.351, P.1 and B.1.1.529 lineages (Alpha, Beta, Gamma and Omicron variants) is associated with high transmissibility and allows VoCs to infect wild type mice. We further show that S protein mutations of MA-SARS-CoV-2 do not affect neutralization efficiency by human convalescent and post vaccination sera.


Conflict of interest statement

The A.G.-S. laboratory has received research support from Pfizer, Senhwa Biosciences, Kenall Manufacturing, Avimex, Johnson & Johnson, Dynavax, 7Hills Pharma, ImmunityBio, and Nanocomposix. A.G.-S. has consulting agreements for the following companies involving cash and/or stock: Vivaldi Biosciences, Contrafect, 7Hills Pharma, Avimex, Vaxalto, Pagoda, Accurius, and Esperovax. M.S. has licensed SARS-CoV-2 serological assays to commercial entities and has filed for patent protection for serological assays as well as SARS-CoV-2 vaccines. F.K. is listed as inventors on the pending patent applications. The F.K. laboratory has received research support from GSK, Dynavax, and Pfizer. F.K. has in the past received consulting fees from Curevac, Merck, Pfizer, and Seqirus. The J.A.R. laboratory received support from Tonix Pharmaceuticals, Xing Technologies and Zoetis, outside of the reported work. J.A.R. is inventor on patents and patent applications on the use of antivirals and vaccines for the treatment and prevention of virus infections, owned by Kansas State University, KS, or the Icahn School of Medicine at Mount Sinai, New York. A provisional patent application on a “A novel 4 Amino Acid Insertion into the Spike Protein of SARS-CoV-2” was submitted by KSU in July 2020 with C.D.M., D.A.M., and J.A.R. listed as inventors. The remaining authors declare no competing interests.

Figures

Fig. 1
Fig. 1. Mouse-adaptation strategy and lung virus titers upon challenge with WT- and MA-SARS-CoV-2.
A The SARS-CoV-2 USA-WA1/2020 Seattle strain was obtained from BEI Resources and serially passaged 11 times in mice of different genetic backgrounds. B Sequence and location of mutations identified in MA-SARS-CoV-2 when compared to WT-SARS-CoV-2. C Infection with 2.5 × 104 PFU of the MA-SARS-CoV-2 resulted in detectable virus titers in lungs (right lung lobes were used for titration) and nasal turbinates at 3 DPI in female 129S1 mice whereas the WT-SARS-CoV-2 did not. D Infection with 2.5 × 104 PFU of MA-SARS-CoV-2 but not WT-SARS-CoV-2, resulted in detectable lung virus titers harvested at different time points post-infection in C57Bl6 as well as E BALB/c mice irrespective of sex. Bars represent geometric means. Dotted line indicates limit of detection (LOD) −66.67 PFUml−1. Each data point corresponds to one mouse and the number of data points represents the number of mice in the corresponding groups. Source data are provided as a Source Data file.
Fig. 2
Fig. 2. Morbidity, viral replication, pathology, and tissue distribution of viral RNA after MA-SARS-CoV-2 infection of 129S1 mice.
A Evolution of body weight relative to initial body weight after infection with 2.5 × 104 PFU WT-SARS-CoV-2 (n = 5), PBS/mock (n = 3), and two doses of MA-SARS-CoV-2 (n = 20 for 2.5 × 104 PFU, n = 5 for 2.5 × 105 PFU). Differences were compared to PBS group. Each dot represents individual animal and the error bar represents mean ± SEM. Two-sided unpaired t-test was performed to determine the statistical difference in reference to the mock group at different DPI. B Viral load in whole lungs and nasal turbinates during the course of infection with 2.5 × 104 PFU of MA-SARS-CoV-2 as measured by plaque assay (n = 4). PFU = plaque-forming units. C Cumulative pathology scored during the course of infection with 2.5 × 104 PFU of MA-SARS-CoV-2 (n = 3 for mock; n = 4 for other groups). Each dot represents individual animal, and the bar represents geometric mean in respective group. Two-tailed Mann–Whitney U test was performed to determine the statistical difference between mock and 1DPI. D Genomic RNA copies in different tissues at different time points post-infection with 2.5 × 104 PFU of MA-SARS-CoV-2 quantified by qRT-PCR using primers specific for the N gene (n = 3). Two-sided unpaired t-test was performed to calculate the statistical significance between different groups. Bars represent geometric means; error bars represent standard deviation. Dotted line indicates limit of detection (LOD) = 66.67 PFU/ml. Each data point corresponds to each mouse in the group and the number of data points represents the number of mice in the corresponding groups. Source data are provided as a Source Data file.
Fig. 3
Fig. 3. Multiplex immunofluorescence imaging of lung tissues from naïve, WT-SARS-CoV-2, or MA-SARS-CoV-2-infected 129S1 mice immunostained for SARS-CoV-2 N protein (green), ACE2 (red), and SARS-CoV-2 Spike protein (blue).
AW: airway. The orange (left and center) and red (right) box is magnified showing N-Protein and Ace2 staining. White arrowheads indicate Ace2+/SARS-CoV-2 N+/SARS-CoV-2 S+ cells. Scale bar: 70, 30, and 10 μm as indicated in the figure panels. N = 4 mice per group and one representative image per group is shown.
Fig. 4
Fig. 4. Multiplex immunofluorescence imaging of lung tissues from naïve, SARS-CoV-2, or MA-SARS-CoV-2-infected 129S1 mice at 3 days post-infection immunostained for Siglec-F (teal), Ly6G (magenta), Epcam (orange), SARS-CoV-2 N protein (green), CD169 (blue), Net/H3 (red), Ki-67 (white), and CD11c (yellow).
(Left to right) The red box is magnified showing SARS-CoV-2 N-Protein with CD169 + AM, Neutrophils, Ki-67+ AM, and Siglec-F + AM. White arrowheads indicate SARS-CoV-2+/Ly6G+/Net/H3+ cells, red arrowheads indicate SARS-CoV-2+/CD169+/CD11c+ cells. AW: airway. Arter: arteria. Scale bar: 50 μm and 20 μm. N = 4 mice per group and one representative image per group is shown.
Fig. 5
Fig. 5. Direct infection of 129S1 mice with VOCs that harbor the N501Y mutation.
A 18-week-old 129S1 mice were infected with 104 PFU of MA-SARS-CoV-2, B.1.1.7, or B.1.351 (n = 10/group). B Whole lungs and nasal turbinates were harvested from n = 3/group at 3 DPI for virus titration by plaque assay. Bars represent means; error bars represent SEM. Dotted line indicates limit of detection (LOD) = 66.67 PFU/ml. Source data are provided as a Source Data file.
Fig. 6
Fig. 6. Age and obesity as risk factors for severity associated with MA-SARS-CoV-2.
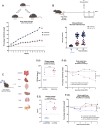
A Six- to eight-week-old C57Bl6 mice were fed with sucrose-matched high fat (n = 30) or control diet (n = 30) for up to 14 weeks and body weight changes were recorded. B Mice on control or high-fat diet were fasted for 6 h followed by an intraperitoneal injection of dextrose solution at 2 g/kg body weight. Blood was drawn at different time points by submandibular bleed and blood glucose levels were determined by Glucose assay. C Diagrammatic representation of intranasal infection with 1.7 × 103 PFU/mouse of SARS-CoV-2 variant (MA-SARS-CoV-2) followed by harvest of various organs to assess virus replication. D, E the body weight changes were monitored post-infection until the harvest (n = 4–5). Higher lung virus titers were observed in obese mice (D-i) accompanied with noticeable loss in body weight (D-ii) as compared to lean/control diet mice. Similarly, the lung virus titers (right lung lobes) (E-i) and body weight loss (E-ii) were found to be higher in 52-week-old mice as compared to 6–8-weeks young/control mice, 5 days post-infection. No virus titers were found in other organs harvested 5 days post-infection in both experiments. Two-sided Mann–Whitney U test was performed to calculate the statistical significance between different groups. Symbols represent geometric means; error bars represent standard deviation. Each data point corresponds to individual mouse and the number of data points represents the number of mice in the corresponding groups. Source data are provided as a Source Data file.
Fig. 7
Fig. 7. Cytokine profile in blood of comorbid mice.
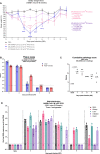
Young (6–8 weeks), old (52 weeks), lean, and obese C57bl/6 mice were infected with 1700 PFU of MA-SARS-CoV-2. Blood was collected at 5 days post-infection (n = 3) and cytokine levels were quantified by luminex multiplex ELISA. Levels for GCSF (A), IL6 (B), IL7 (C) and IL17 (D) are shown. Two-sided Unpaired t-test was performed to calculate the statistical significance between different groups. Bars represent geometric means; error bars represent standard deviation. Each data point corresponds to individual mouse and the number of data points represents the number of mice in the corresponding groups. Source data are provided as a Source Data file.
Fig. 8
Fig. 8. Post-vaccination or convalescent human sera neutralize both WT- and N501Y/H655Y MA-SARS-CoV-2 viruses.
Post-vaccination or post-infection human sera were analyzed for virus neutralization by in vitro microneutralization assays using 450TCID50 of either WT-SARS-CoV-2 (USA-WA1/2020) or MA-SARS-CoV-2 and the ID50 (inhibition) values were calculated and compared. Each symbol represents ID50 value calculated for a human serum sample [negative (n = 4) versus weak (n = 8), moderate (n = 10), or strong positive (n = 11)].Sera from sero-negative individuals were used as negative control for the experiment. Dotted line (LOD). Two-sided Mann–Whitney U test was performed to calculate the statistical significance (p) between different groups. The box-whisker plots show all minimum to maximum data points, with respective medians and interquartile range. Source data are provided as a Source Data file.
Fig. 9
Fig. 9. Comparison of in vitro serum microneutralization titers between WT-SARS-CoV-2 (USA-WA1/2020) and B.1.1.7, B.1.351, rTriple- and rE484K-SARS-CoV-2.
Box and whisker plots represent median and range of low-to-high value points in each group. The samples are divided into three groups- negative, vaccinated, and convalescent depending on their vaccination status or previous exposure to SARS-CoV-2 [negative (n = 7) versus weak (n = 8), moderate (n = 13), and strong positive (n = 18)]. Negative group corresponds to individuals with naïve serum in terms of vaccination or SARS-CoV-2 exposure. Vaccinated samples belong to individuals who received two doses of Pfizer/BioNTech vaccine irrespective of previous exposure to SARS-CoV-2 (convalescent and corresponding convalescent+vaccinated individuals are represented as ▴). Convalescent group is further subdivided into low, moderate and high based on their Spike-specific IgG titres. ID50 values for USA-WA1/2020 are compared to those for B.1.1.7 (A), B.1.351 (B), rTriple (C) and rE484K (D). Two-sided Mann–Whitney U tests were performed to calculate statistical differences. The box-whisker plots show all minimum to maximum data points, with respective medians and interquartile range. The fold change was calculated individually for each sample and represented as average fold change for each group. Dotted line (LOD). Source data are provided as a Source Data file.

References

    1. Hoffmann M, et al. SARS-CoV-2 cell entry depends on ACE2 and TMPRSS2 and is blocked by a clinically proven protease inhibitor. Cell. 2020;181:271–280. doi: 10.1016/j.cell.2020.02.052. - DOI - PMC - PubMed
    1. Kruglikov IL, Shah M, Scherer PE. Obesity and diabetes as comorbidities for COVID-19: underlying mechanisms and the role of viral–bacterial interactions. eLife. 2020;9:e61330. doi: 10.7554/eLife.61330. - DOI - PMC - PubMed
    1. Wu Z-H, Tang Y, Cheng Q. Diabetes increases the mortality of patients with COVID-19: a meta-analysis. Acta Diabetol. 2020;58:139–144. doi: 10.1007/s00592-020-01546-0. - DOI - PMC - PubMed
    1. Wang B, Li R, Lu Z, Huang Y. Does comorbidity increase the risk of patients with COVID-19: evidence from meta-analysis. Aging. 2020;12:6049–6057. doi: 10.18632/aging.103000. - DOI - PMC - PubMed
    1. X. Y, et al. Clinical course and outcomes of critically ill patients with SARS-CoV-2 pneumonia in Wuhan, China: a single-centered, retrospective, observational study. Lancet Respir. Med. 2020;8:475–481. doi: 10.1016/S2213-2600(20)30079-5. - DOI - PMC - PubMed

Publication types

Supplementary concepts