. 2022 Jul 7;13(1):3913.
doi: 10.1038/s41467-022-31635-3.

Sex-specific regulation of inhibition and network activity by local aromatase in the mouse hippocampus

Affiliations

Sex-specific regulation of inhibition and network activity by local aromatase in the mouse hippocampus

Alicia Hernández-Vivanco et al. Nat Commun. .

Abstract

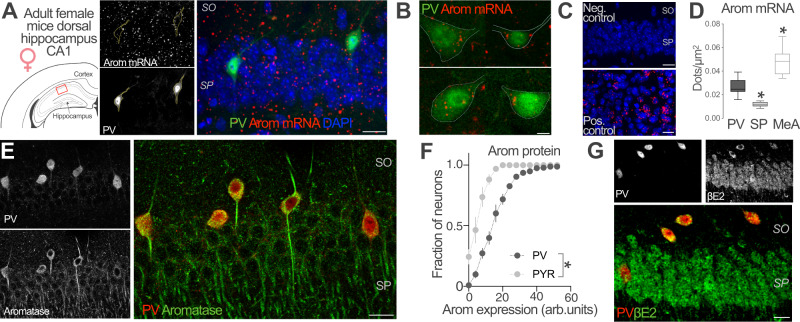
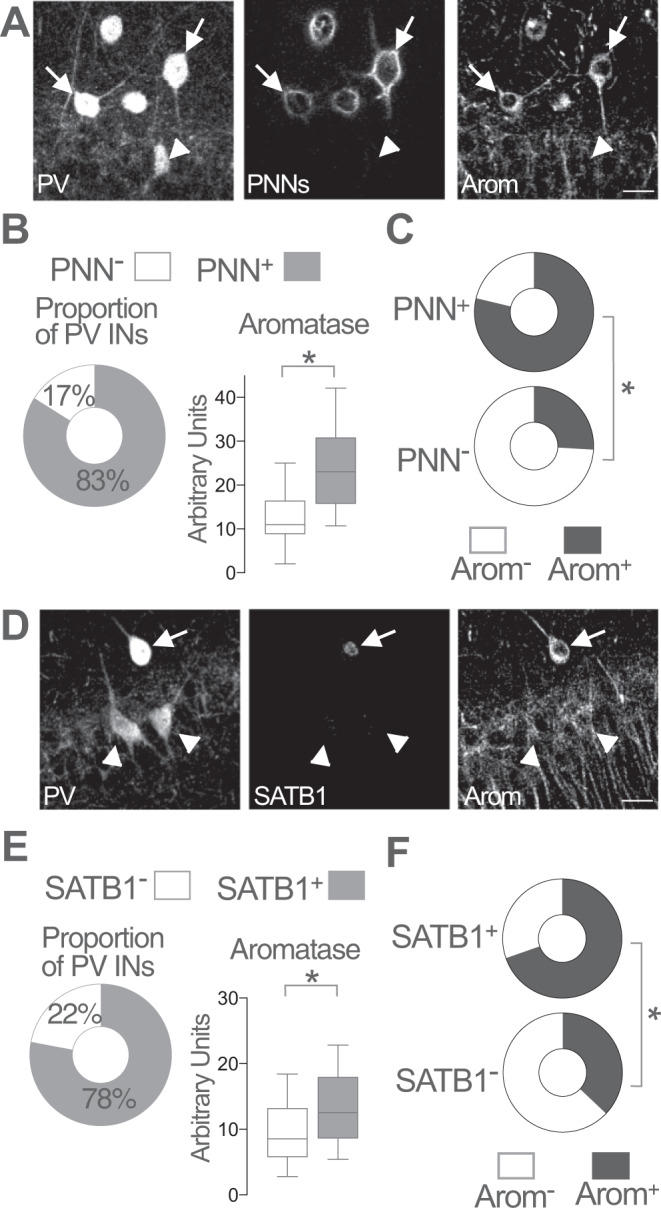
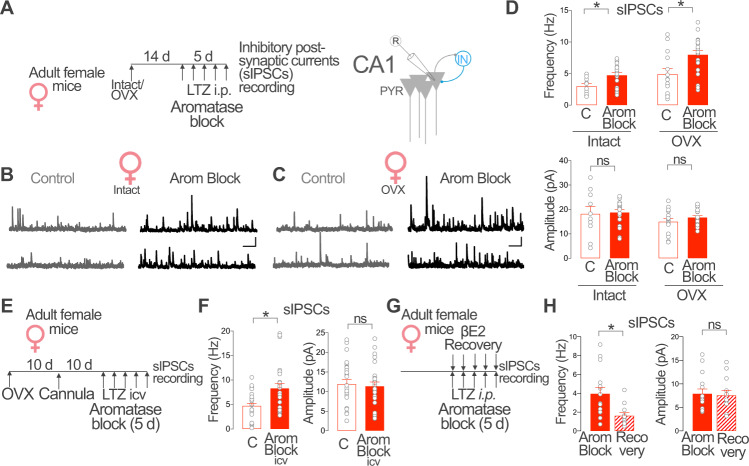
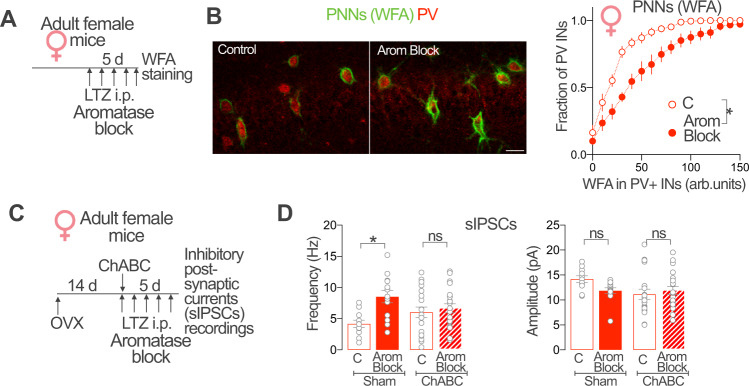
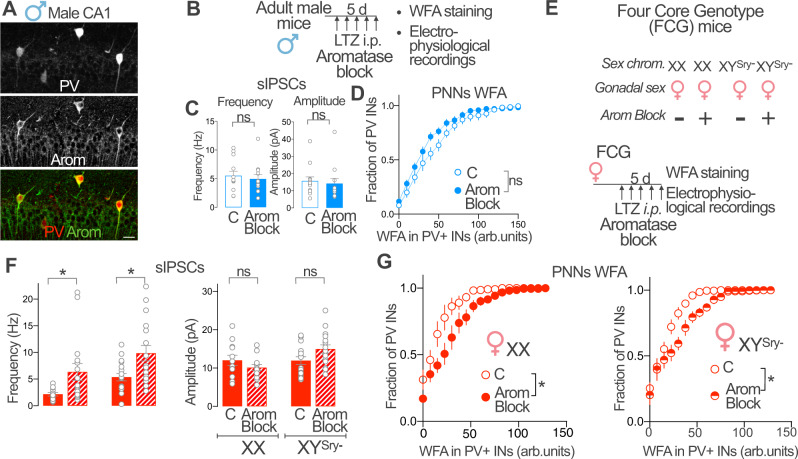
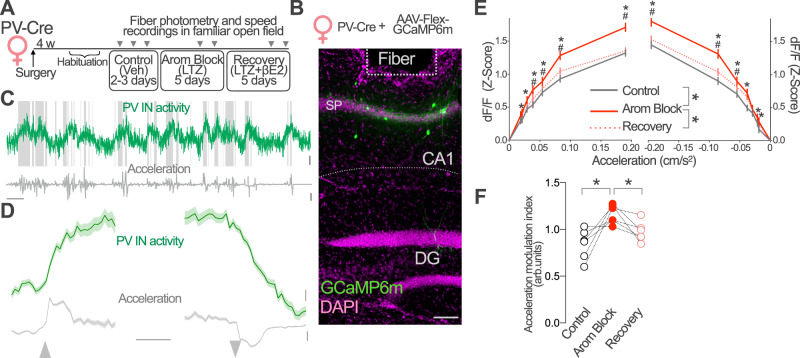
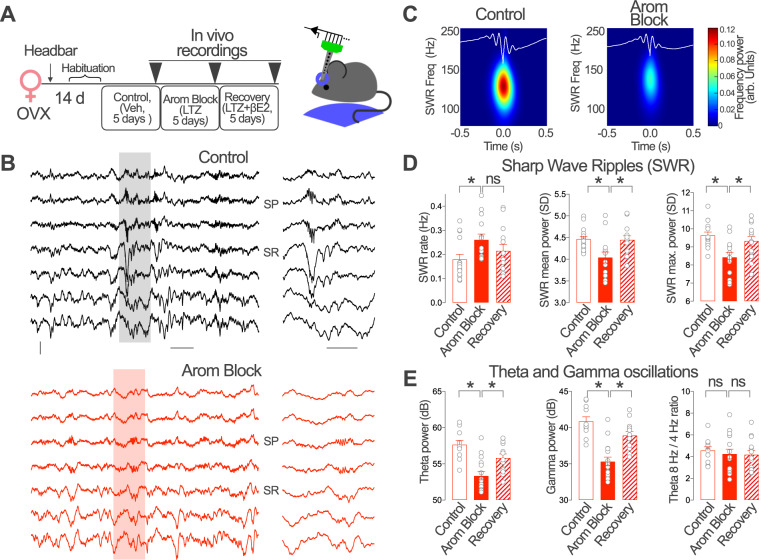
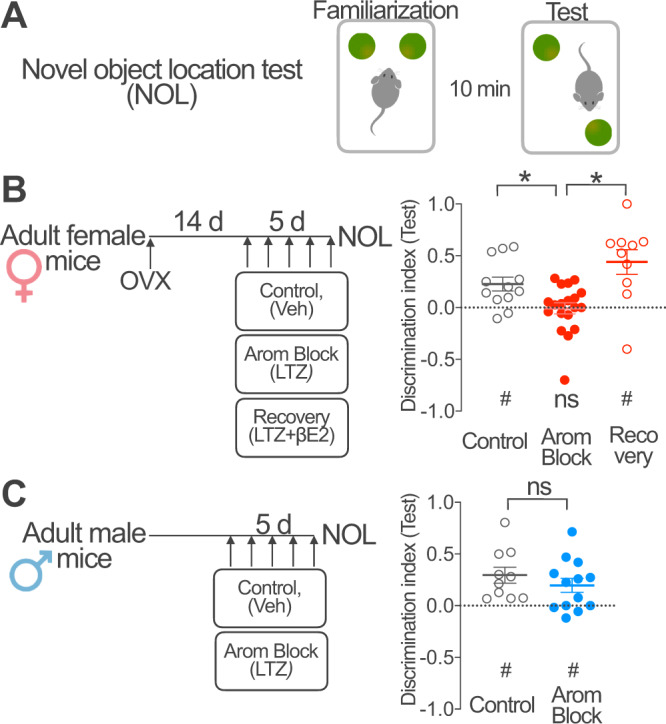
Cognitive function relies on a balanced interplay between excitatory and inhibitory neurons (INs), but the impact of estradiol on IN function is not fully understood. Here, we characterize the regulation of hippocampal INs by aromatase, the enzyme responsible for estradiol synthesis, using a combination of molecular, genetic, functional and behavioral tools. The results show that CA1 parvalbumin-expressing INs (PV-INs) contribute to brain estradiol synthesis. Brain aromatase regulates synaptic inhibition through a mechanism that involves modification of perineuronal nets enwrapping PV-INs. In the female brain, aromatase modulates PV-INs activity, the dynamics of network oscillations and hippocampal-dependent memory. Aromatase regulation of PV-INs and inhibitory synapses is determined by the gonads and independent of sex chromosomes. These results suggest PV-INs are mediators of estrogenic regulation of behaviorally-relevant activity.


Conflict of interest statement

The authors declare no competing interests.

Figures

Fig. 1
Fig. 1. Aromatase expression and βE2 presence in PV-INs of female mice.
A Representative image of aromatase (arom) mRNA in situ hybridization in dorsal hippocampus CA1 region (approximate location, red square, left schema) of an adult parvalbumin-Cre (PV-Cre) female mice infected with AAVs carrying a Cre-dependent EYFP expression construct. EYFP labeled parvalbumin inhibitory neurons (PV-INs) and mRNA single-channel images are represented in gray scale in the middle part of the panel. SO stratum oriens, SP stratum pyramidale. Scale bar: 20 μm. B Aromatase mRNA signal (red dots) was detected in hippocampal PV EYFP+ neurons located in the SO and SP of the dorsal CA1 area. Scale bar: 5 μm. C No signal was detected in CA1 when probe was omitted (Neg. control). High aromatase mRNA signal (red dots) was detected in medial amygdala, a positive control (Pos. control) for aromatase expression. Scale bar: 20 μm. D Aromatase mRNA dot density analysis in CA1 PV-INs, CA1 stratum pyramidale (SP) and Medial Amygdala (MeA). Aromatase mRNA expression in PV-INs was higher compared with SP but lower than in MeA. One-way ANOVA, F(2, 42) = 49.54, p < 0.0001. Bonferroni’s comparison tests, PV-SP p < 0.0001, PV-MeA p < 0.0001; n = 26, 9 and 10 PV-INs, SP and MeA neurons respectively, from 2 mice. Whiskers represent median and 10–90 percentiles. E Simultaneous immunohistochemical detection of aromatase protein (green) and PV (red) in CA1 region of female mice. Single-channel images are reproduced in gray scale in the left part of the panel. Scale bar: 20 μm. F Frequency distribution analysis of aromatase protein staining intensities in PV-INs (black) and pyramidal neurons (PYR, gray), arbitrary units (arb. units). Two-way ANOVA, F(1, 4) = 74.05, p = 0.001; n = 3 mice. Graph represents mean ± SEM. G Presence of 17-β-estradiol (βE2, green) in PV-IN (red) of the CA1 region of female mice was assessed using immunohistochemical analysis. Single-channel images are represented in gray scale in the upper part of the panel. Scale bar: 20 μm. *p < 0.05. Source data are provided as a Source Data file.
Fig. 2
Fig. 2. Aromatase expression in PNNs and SATB1-expressing PV-IN.
A Representative images of parvalbumin (PV), aromatase (Arom) and WFA staining (perineuronal nets, PNNs) in adult female mice CA1 region. WFA staining was used to reveal the presence (arrows) or absence (arrowheads) of PNNs surrounding parvalbumin inhibitory neurons (PV-INs). Scale bar: 20 μm. B Proportion of PV-INs surrounded by PNNs (left plot). Higher aromatase levels were detected in PNN+ PV-INs as compared with PNN PV-INs (right plot). Unpaired two-tailed t-test, *p < 0.0001, t(168) = 4.3; n = 170 PV-IN from 3 female mice. C Proportion of aromatase expressing (Arom+) neurons was higher in PNN+ PV-INs (upper plot) compared with PNN PV-INs (lower plot). Two-sided Fisher’s exact test, p < 0.0001; n = 170 PV-IN from 3 female mice. D Representative images of PV, aromatase and SATB1 staining in adult female mice CA1 region. Arrow points to a SATB1+ PV-IN. Arrowheads point to SATB1 PV-INs. Scale bar: 20 μm. E Proportion of PV INs expressing SATB1 (left plot). Higher aromatase levels were detected in SATB1+ PV-INs as compared with SATB1 PV-INs (right plot). Two-tailed Mann–Whitney test, U = 3304, p < 0.0001; n = 245 PV-INs from 3 female mice. F Proportion of aromatase expressing (Arom+) neurons was higher in SATB1+ PV-INs (upper plot) compared with SATB1 PV-INs (lower plot). Two-sided Fisher’s exact test, p < 0.0001; n = 245 PV-IN from 3 female mice. Whisker in plots represent median and 10–90 percentiles. *p < 0.05. Source data are provided as a Source Data file.
Fig. 3
Fig. 3. Brain aromatase regulates CA1 synaptic inhibition in female mice.
A Intact or ovariectomized (OVX) female mice received daily intraperitoneal (i.p.) injections of the aromatase blocker letrozole (LTZ) or vehicle (C) for 5 days. Spontaneous Inhibitory Post-Synaptic Currents (sIPSCs) were recorded from CA1 pyramidal (PYR) neurons. B Representative recordings of sIPSCs in vehicle (C) and letrozole (Arom Block) treated intact female mice. C Same as B, but in OVX female mice. Scale bar in B and C: 50 pA, 1 s. D Group data for experiment described in A. Frequency, two-way ANOVA, C/Arom Block F (1, 61) = 14.10, p = 0.0004, Intact/OVX F (1, 61) = 18.17, p < 0.0001. Bonferroni comparison tests, Intact C vs. Arom Block p = 0.002; OVX C vs. Arom Block p = 0.002. Amplitude, two-way ANOVA C/Arom Block F(1, 61) = 0.70, p = 0.41, Intact/OVX F(1, 61) = 3.18, p = 0.08. Bonferroni comparison tests, Intact C vs. Arom Block p > 0.99; OVX C vs. Arom Block p > 0.99. Intact, n = 10, 19 neurons from 3 mice per group; OVX, n = 14, 21 neurons from 3 mice. E Adult OVX female mice received daily intracerebroventricular (icv) injections of vehicle (C) or the aromatase blocker LTZ (Arom Block icv) for 5 days. F Group data for experiment described in E. Frequency, Two-tailed Mann–Whitney test, U = 197, p = 0.006; amplitude, unpaired two tailed t-test, t (51) = 0.34, p = 0.73; n = 27, 26 cells from 5 mice per group. G Female mice were treated with the aromatase blocker LTZ (Arom Block) or LTZ and 17β-estradiol (βE2, Recovery) for 5 days. H Group data for experiment described in G. Frequency, Two-tailed Mann–Whitney test, U = 33, p = 0.004. Amplitude, Unpaired two tailed t-test, t (25) = 0.22, p = 0.8; n = 12, 15 neurons from 3 mice per group. Graphs represent mean ± SEM (columns and bars) and individual values (gray circles). *p < 0.05; ns p > 0.05. Source data are provided as a Source Data file.
Fig. 4
Fig. 4. PNNs are required for extragonadal aromatase regulation of CA1 synaptic inhibition.
A Adult intact female mice received daily intraperitoneal (i.p.) injections of aromatase blocker letrozole (LTZ, Arom Block). After 5 days of treatment, perineuronal nets (PNNs) were evaluated quantifying WFA staining intensity. B Representative images showing WFA staining of PNNs (green) surrounding CA1 parvalbumin PV-INs (red) of vehicle (Control) and aromatase blocker letrozole (Arom Block) treated female mice. Scale bar: 20 μm. Graph shows frequency distribution analysis of WFA staining intensities around PV-INs, arbitrary units (arb. units). Aromatase blockade increases WFA staining intensity around female CA1 PV-IN. Two-way ANOVA, Treatment F(1, 12) = 14.88, p = 0.0023; n = 6, 8 mice. C Adult female mice received a single intrahippocampal injection of Chondroitinase ABC (ChABC) or vehicle (Sham) 14 days after ovariectomy (OVX). On the same day of the ChABC or vehicle intracerebral injection, mice received the first intraperitoneal (i.p.) daily injection of aromatase blocker letrozole (Arom Block) or vehicle (C). After 5 days of treatment, CA1 PYR neuron spontaneous Inhibitory Post-Synaptic Currents (sIPSCs) frequency and amplitude were determined. D ChABC treatment prevented the increase of sIPSCs frequency caused by Aromatase blockade (Left graph). Two-way ANOVA, Treatment Arom block F(1, 60) = 8.432, p = 0.0052; treatment ChABC, F(1, 60) = 3.715 × 10−7, p = 0.9995. Bonferroni’s comparison tests, C vs. Arom Block (Sham) p = 0.0045, C vs. Arom Block (ChABC) p > 0,99. No significant changes were observed in sIPSCs amplitude (right graph). Two-way ANOVA, Treatment Arom block F(1, 60) = 0.72, p = 0.4; treatment ChABC, F(1, 60) = 2.78, p = 0.1. Bonferroni’s comparison tests, C-Arom Block (Sham) p = 0.22, C-Arom Block (ChABC) p = 0.97; n = 11, 13, 19, 21 cells from 3 mice per group. Graphs represent mean ± SEM (symbols and bars) and individual values (gray circles). *p < 0.05; ns, p > 0.05. Source data are provided as a Source Data file.
Fig. 5
Fig. 5. Aromatase regulation of synaptic inhibition and PV-IN PNNs is female-specific and independent of sex chromosomes.
A Aromatase protein (Arom, red) and parvalbumin (PV, green) expression in male mice dorsal CA1. Single-channel images are represented in gray scale. Scale bar: 20 μm. B Male mice received intraperitoneal (i.p.) injections of the aromatase blocker letrozole (LTZ) or vehicle (C) and processed for perineuronal nets (PNNs) analysis or electrophysiological recordings. C Group data for experiment in B (sIPSCs). Two-tailed Mann–Whitney tests, frequency U = 62, p = 0.41; amplitude, U = 58, p = 0.29; n = 13, 12 cells, 3 mice per group. D Group data for experiment in B (WFA staining). Two-way ANOVA, Treatment F(1, 13) = 1.897, p = 0.1916; n = 7, 8 mice. E XX or XYSry female mice were treated with LTZ and processed for PNNs analysis or electrophysiological recordings. F Group data for experiment in E (sIPSCs). Two-way ANOVA, Frequency Arom Block F(1, 58) = 12.68, p = 0.0007, Chromosomes F(1, 58) = 7.592, p = 0.0078, interaction F(1, 58) = 0.01428, p = 0.9053. Bonferroni’s comparisons, C vs Arom Block (XX), p = 0.0486, C vs Arom Block (XYSry−) p = 0.0157. Amplitude, Treatment F(1, 58) = 0.3, p = 0.58, Chromosomes F(1, 58) = 5.17, p = 0.03, interaction F(1, 58) = 5.17, p = 0.02. Bonferroni’s comparisons, C-Arom Block (XX), p = 0.4, C vs. Arom Block (XYSry−) p = 0.07; n = 12, 16, 17, 17 cells, 3 mice per group. G Group data for experiment in E (WFA staining). Two-way ANOVA, Female XX Arom Block F(1, 8) = 5.72, p = 0.0438, interaction F(17, 136) = 3.15, p = 0.0001; n = 5 mice. Female XYSry−, Arom Block F(1, 8) = 13.6, p = 0.006, interaction F(17, 136) = 3.29, p < 0.0001; n = 6, 4 mice. Graphs represent mean ± SEM. In C and F, circles represent individual values. *p < 0.05; ns, p > 0.05. Source data are provided as a Source Data file.
Fig. 6
Fig. 6. Aromatase regulates PV-IN activity in vivo.
A Parvalbumin-Cre (PV-Cre) female mice were infected with AAV-Flex-GCaMP6m and an optic fiber was implanted above CA1 area. After habituation to an open field arena (5 days), mice received daily intraperitoneal injections of vehicle (Control, 2–3 days), the aromatase blocker letrozole (LTZ, Arom Block, 5 days) and LTZ+ 17β-estradiol (βE2, Recovery). Fiber photometry signal and speed were registered 90 min after the last injection during each treatment condition as indicated, while animals were freely exploring the open field (10 min). B Representative image of GCaMP6m expression (green) and optic fiber placement above CA1 stratum pyramidale (SP). Scale bar 0.1 mm. C Representative GCaMP6m fluorescence (green) during exploration in control conditions. Shaded areas mark mobility periods. Instantaneous acceleration (gray) was used to analyze locomotory behavior. Scale bars: 10 s, 1% dF/F and 0.1 m/s2. D Event-triggered average traces for immobility to locomotion (left) and locomotion to immobility (right) transitions. Traces show mean ± SEM for all recorded mice (n = 6) during control sessions. Scale bars: PV IN activity, 0.1 Z-score; acceleration 0.02 m/s;2 1 s. E Plots show PV-INs response to acceleration (right) and deceleration (left) in each treatment condition. PV-INs responses increased during Arom Block treatment (red) with respect to control (gray) and recovery (dotted red) conditions. Two-way, repeated measures ANOVA, treatment F(2, 238820) = 246.8, p < 0.0001. Bonferroni’s comparison tests, *p < 0,05 Control vs. Arom Block, #p < 0,05 Recovery vs. Arom Block. n corresponds to instant measurements, data obtained from 6 female mice. Data represent mean ±95% confidence interval. F The acceleration modulation of PV-INs increased after aromatase pharmacological blockade (Arom Block) and returned to control levels when animals receive βE2 to compensate for lack of endogenous estradiol synthesis (Recovery). One-way ANOVA, F(2, 15) = 9.94, p = 0.002; Bonferroni’s comparison tests Control vs. Arom Block p = 0.001, Arom Block vs. Recovery p = 0.038; n = 6 mice. Data represents values for individual mice. *p < 0.05. Source data are provided as a Source Data file.
Fig. 7
Fig. 7. Brain aromatase regulates the dynamics of SWRs and hippocampal oscillations in awake female mice.
A Ovariectomized (OVX) female mice received daily intraperitoneal injections of vehicle (Control), the aromatase blocker letrozole (LTZ, Arom Block) and LTZ + βE2 (Recovery). Recordings were performed on the 5th day of consecutive treatments. B Representative recordings from an OVX female in Control and Arom Block conditions. One Sharp Wave Ripple (SWR) event is shown at right at enlarged time scale. Scale bars: 0.1 mV, 0.2 s (left), 0.1 s (right). SP stratum pyramidale, SR stratum radiatum. C Mean SWR events from recordings after vehicle (Control) or LTZ (Arom Block) treatment. D Group statistic effects for SWRs. SWR Rate, Kruskall–Wallis test, H = 7.99, p = 0.018, Dunn´s multiple comparisons, C vs. Arom Block p = 0.01, Arom Block vs. Recovery p = 0.18. One-way ANOVA, SWR mean power, F(2, 39) = 5.886, p = 0.006; Bonferroni’s comparisons, C vs. Arom Block p = 0.007, Arom Block vs. Recovery p = 0.015. SWR max power, F(2, 39) = 7.028, p = 0.003; Bonferroni’s comparisons, C vs. Arom Block p = 0.001, Arom Block vs Recovery p = 0.03; n = 15, 14, 13 recordings from 4 Control, 4 Arom Block and 4 Recovery treated animals, respectively. E Group statistic effects for theta and gamma oscillations. One-way ANOVA, Theta power, F(2, 37) = 13.99, p < 0.0001, Bonferroni’s comparisons, C vs. Arom Block p < 0.0001, Arom Block vs. Recovery p = 0.007. Gamma power, F(2, 37) = 22.54, p < 0.0001, Bonferroni’s comparisons, C vs. Arom Block p < 0.0001, Arom Block vs. Recovery p = 0.0002. Theta 8 Hz/4 Hz ratio power, F(2, 37) = 0.2265, Bonferroni’s comparisons, C vs. Arom Block p > 0.99, Arom Block vs. Recovery p > 0.99; n = 11, 16, 13 recordings from 5 Control, 5 Arom Block and 4 recovery treated animals, respectively. Graphs represent mean ± SEM (columns and bars) and individual values (gray circles). *p < 0.05; ns p > 0.05. Source data are provided as a Source Data file.
Fig. 8
Fig. 8. Brain aromatase regulates hippocampal memory.
A The cognitive effect of aromatase blockade and βE2 recovery was studied using the novel object location test (NOL) with 10 min inter-trial interval between the familiarization and test sessions. ∫ B Fourteen days after ovariectomy (OVX), adult female mice received daily intraperitoneal (i.p.) injections of vehicle (Control), the aromatase blocker letrozole (LTZ, Arom Block) or the aromatase blocker LTZ+ βE2 (Recovery) for 5 days. Mice performed the NOL test 90 min after the last injection. Graph represents population data. Discrimination index > 0 indicates preferential exploration of the displaced object during the test session. Dotted line represents chance levels. One sample t test (indicated below the graph): Control, t(11) = 3.41, #p = 0.006, Arom Block, t (18) = 0.14, n.s. p = 0.89; Recovery, t (9) = 3.67, #p = 0.005. One-way ANOVA (indicated above the graph): F(2, 38) = 9.12, p = 0.0006; Bonferroni’s comparison tests, C vs. Arom Block p = 0.03, Arom Block vs. Recovery p = 0.0003; n = 12, 19, 10 mice. C Adult male mice received daily intraperitoneal injections of vehicle (Control) or the aromatase blocker letrozole (Arom Block) for 5 days. Mice performed the NOL test 90 min after the last injection. Graph represents population data. Discrimination index > 0 indicates preferential exploration of the displaced object during the test session. Dotted line represents chance levels. One sample t test (indicated below the graph): Control, t (9) = 3.82, #p = 0.004; Arom Block, t(12) = 2.89, #p = 0.013. Unpaired two-tailed t test (indicated above the graph), t(21) = 0.96, n.s. p = 0.35; n = 10, 13 mice per group. Graphs represent mean ± SEM (line and bars) and individual values (circles) for each experimental condition. * and #p < 0.05; n.s. p > 0.05. Source data are provided as a Source Data file.

References

    1. Garcia-Segura, L. M. Hormones and Brain Plasticity (Oxford University Press, 2009).
    1. McEwen B. Estrogen actions throughout the brain. Recent Prog. Horm. Res. 2002;57:357–384. doi: 10.1210/rp.57.1.357. - DOI - PubMed
    1. Do Rego JL, et al. Neurosteroid biosynthesis: enzymatic pathways and neuroendocrine regulation by neurotransmitters and neuropeptides. Front. Neuroendocrinol. 2009;30:259–301. doi: 10.1016/j.yfrne.2009.05.006. - DOI - PubMed
    1. Taxier LR, Gross KS, Frick KM. Oestradiol as a neuromodulator of learning and memory. Nat. Rev. Neurosci. 2020;21:535–550. doi: 10.1038/s41583-020-0362-7. - DOI - PMC - PubMed
    1. Blakemore J, Naftolin F. Aromatase: contributions to physiology and disease in women and men. Physiology. 2016;31:258–269. doi: 10.1152/physiol.00054.2015. - DOI - PubMed

Publication types