

Relationship between Thoroughbred workloads in racing and the fatigue life of equine subchondral bone
- PMID: 35798766
- PMCID: PMC9262984
- DOI: 10.1038/s41598-022-14274-y
Relationship between Thoroughbred workloads in racing and the fatigue life of equine subchondral bone
Abstract
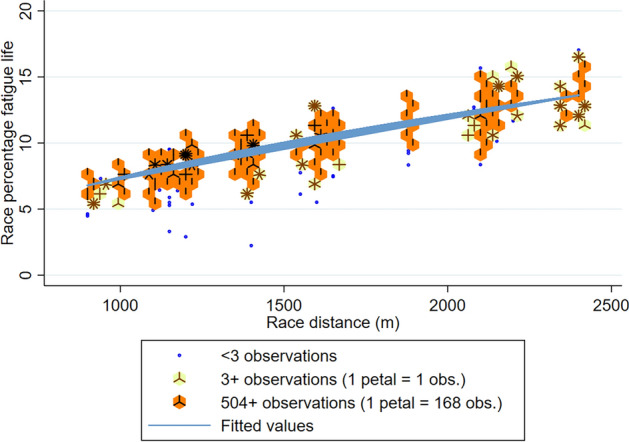
Fatigue life (FL) is the number of cycles of load sustained by a material before failure, and is dependent on the load magnitude. For athletes, 'cycles' translates to number of strides, with load proportional to speed. To improve previous investigations estimating workload from distance, we used speed (m/s, x) per stride collected using 5 Hz GPS/800 Hz accelerometer sensors as a proxy for limb load to investigate factors associated with FL in a Thoroughbred race start model over 25,234 race starts, using a combination of mathematical and regression modelling. Fore-limb vertical force (NKg-1) was estimated using a published equation: Vertical force = 2.778 + 2.1376x - 0.0535x2. Joint load (σ) was estimated based on the vertical force, scaled according to the maximum speed and defined experimental loads for the expected variation in load distribution across a joint surface (54-90 MPa). Percentage FL (%FL) was estimated using a published equation for cycles to failure (Nf) summed across each race start: Nf = 10(σ-134.2)/-14.1. Multivariable mixed-effects linear regression models were generated on %FL, adjusting for horse-level clustering, presented as coefficients; 95%CI. Scaled to the highest joint load, individual starts accrued a mean of 9.34%FL (sd. 1.64). Older age (coef. 0.03; 0.002-0.04), longer race-distances (non-linear power transformed), and firmer track surfaces (ref. Heavy 10: Good 3 coef. 2.37; 2.26-2.48) were associated with greater %FL, and males accrued less than females (p < 0.01). Most variables associated with %FL are reported risk factors for injury. Monitoring strides in racehorses may therefore allow identification of horses at risk, enabling early detection of injury.
© 2022. The Author(s).
Conflict of interest statement
The authors declare no competing interests.
Figures


References
-
- Estberg L, et al. Cumulative racing-speed exercise distance cluster as a risk factor for fatal musculoskeletal injury in Thoroughbred racehorses in California. Prev. Vet. Med. 1995;24:253–263. doi: 10.1016/0167-5877(95)00489-J. - DOI
-
- Estberg L, et al. High-speed exercise history and catastrophic racing fracture in Thoroughbreds. Am. J. Vet. Res. 1996;57:1549–1555. - PubMed
Publication types
MeSH terms
LinkOut - more resources
Full Text Sources
