

doi: 10.1038/s41587-022-01368-1.
Epub 2022 Jul 7.
Enhancing untargeted metabolomics using metadata-based source annotation
Affiliations
- PMID: 35798960
- PMCID: PMC10277029
- DOI: 10.1038/s41587-022-01368-1
Item in Clipboard
Enhancing untargeted metabolomics using metadata-based source annotation
Nat Biotechnol.
2022 Dec.
Erratum in
-
Author Correction: Enhancing untargeted metabolomics using metadata-based source annotation.Nat Biotechnol. 2023 Nov;41(11):1656. doi: 10.1038/s41587-023-02025-x. Nat Biotechnol. 2023. PMID: 37853256 No abstract available.
Abstract
Human untargeted metabolomics studies annotate only ~10% of molecular features. We introduce reference-data-driven analysis to match metabolomics tandem mass spectrometry (MS/MS) data against metadata-annotated source data as a pseudo-MS/MS reference library. Applying this approach to food source data, we show that it increases MS/MS spectral usage 5.1-fold over conventional structural MS/MS library matches and allows empirical assessment of dietary patterns from untargeted data.
© 2022. The Author(s), under exclusive licence to Springer Nature America, Inc.
Figures
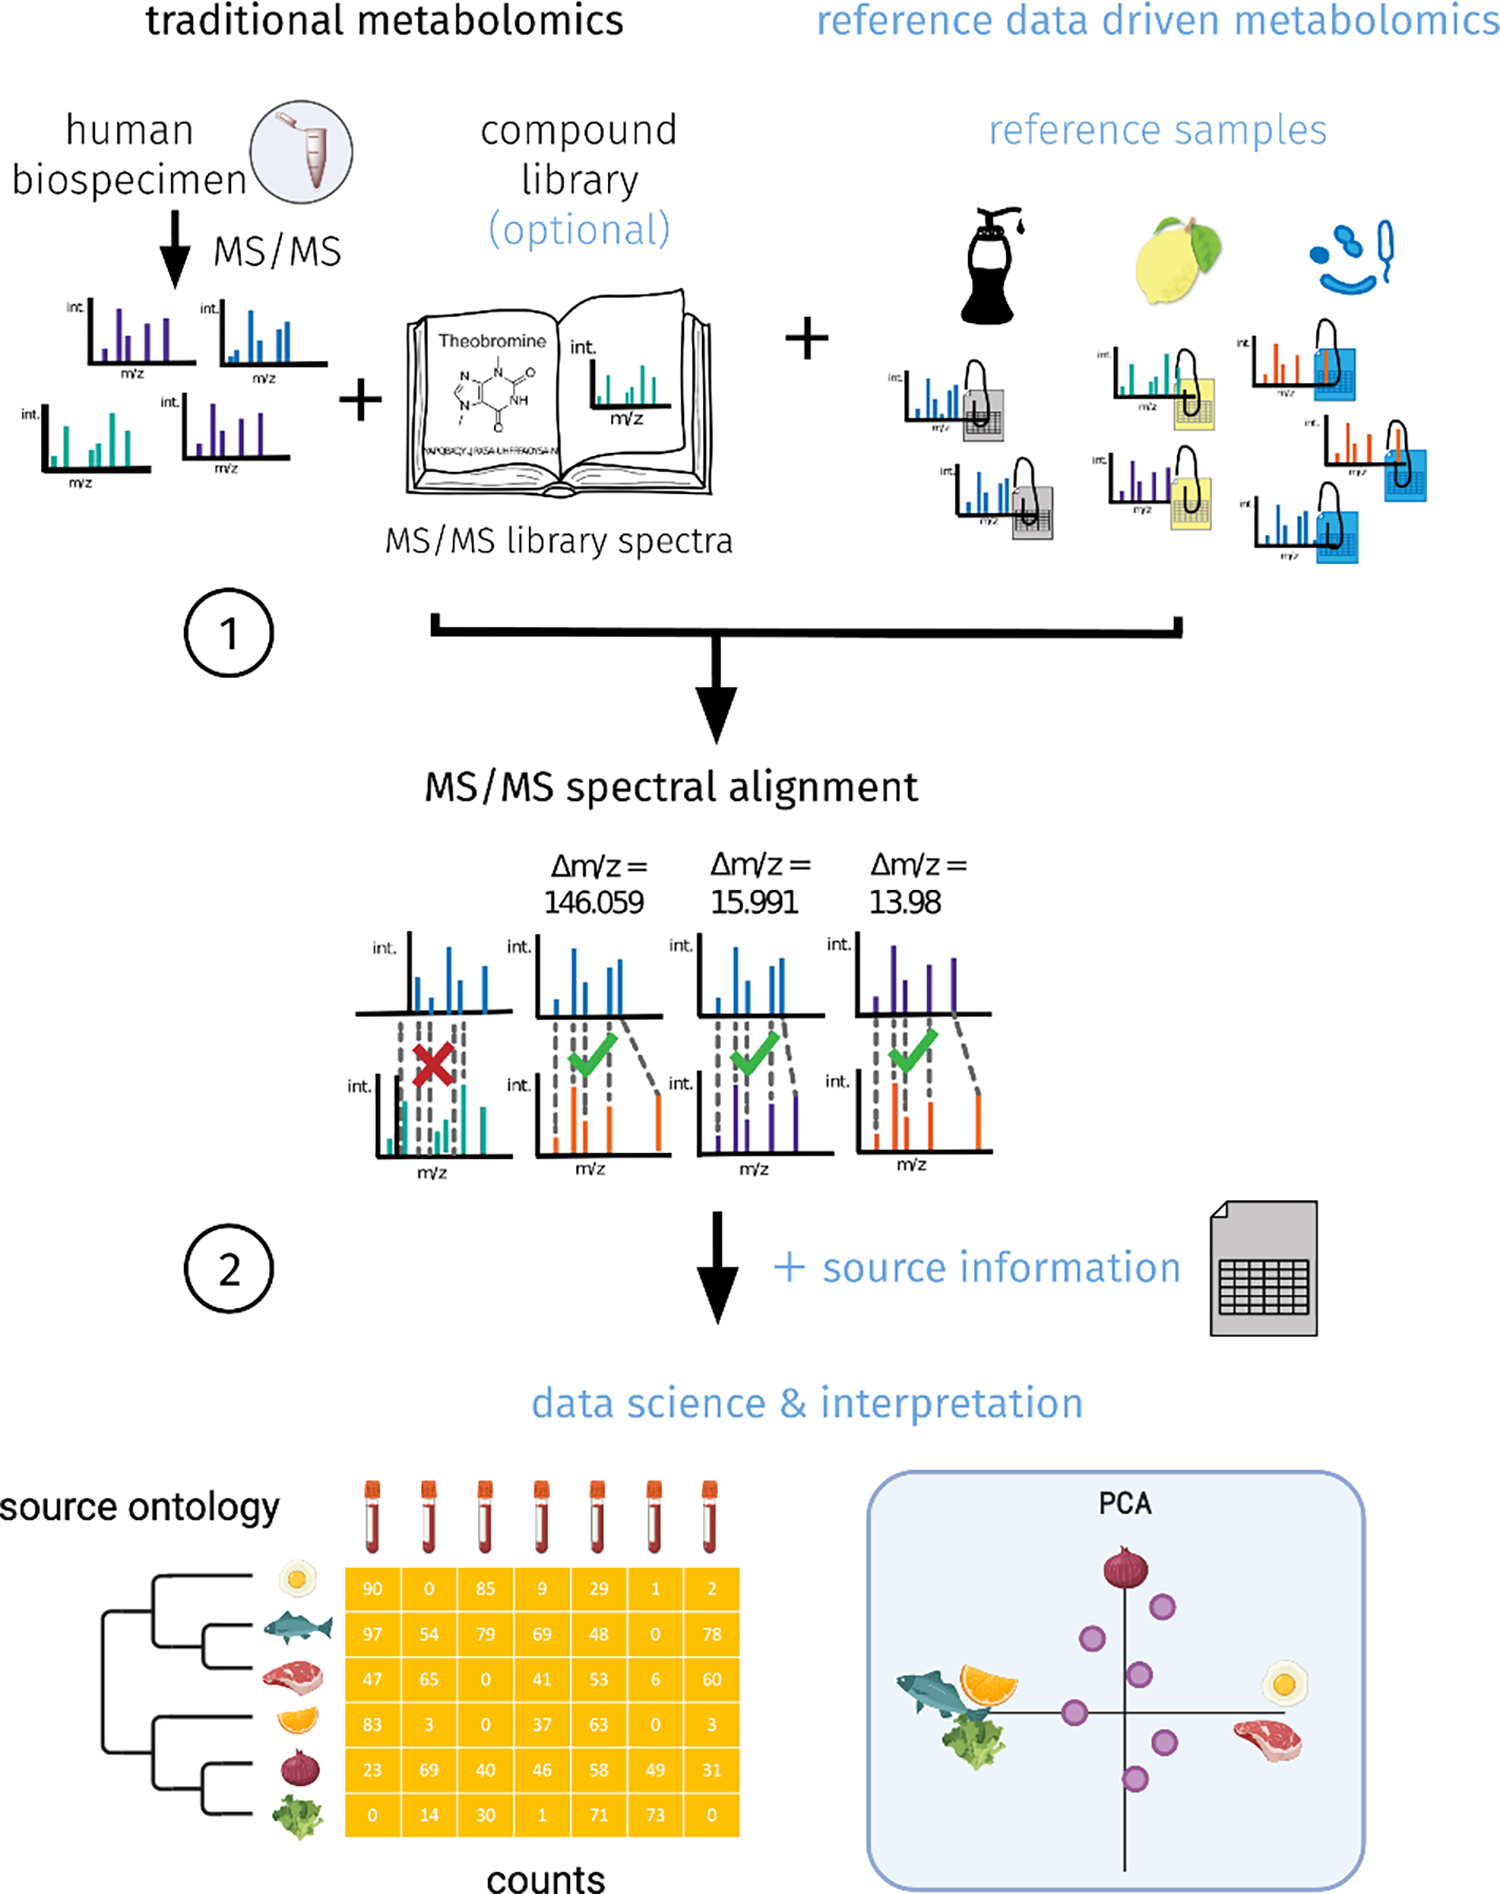
1 - Perform spectral alignment of the MS/MS based untargeted metabolomics data from human biospecimens with data from reference samples that have controlled vocabularies for metadata. This can, optionally, be combined with MS/MS libraries. 2 - link the spectral matches to the source information from the metadata from the reference samples. Create a data table of source ontology, human biospecimen and counts to enable data science and interpretation.
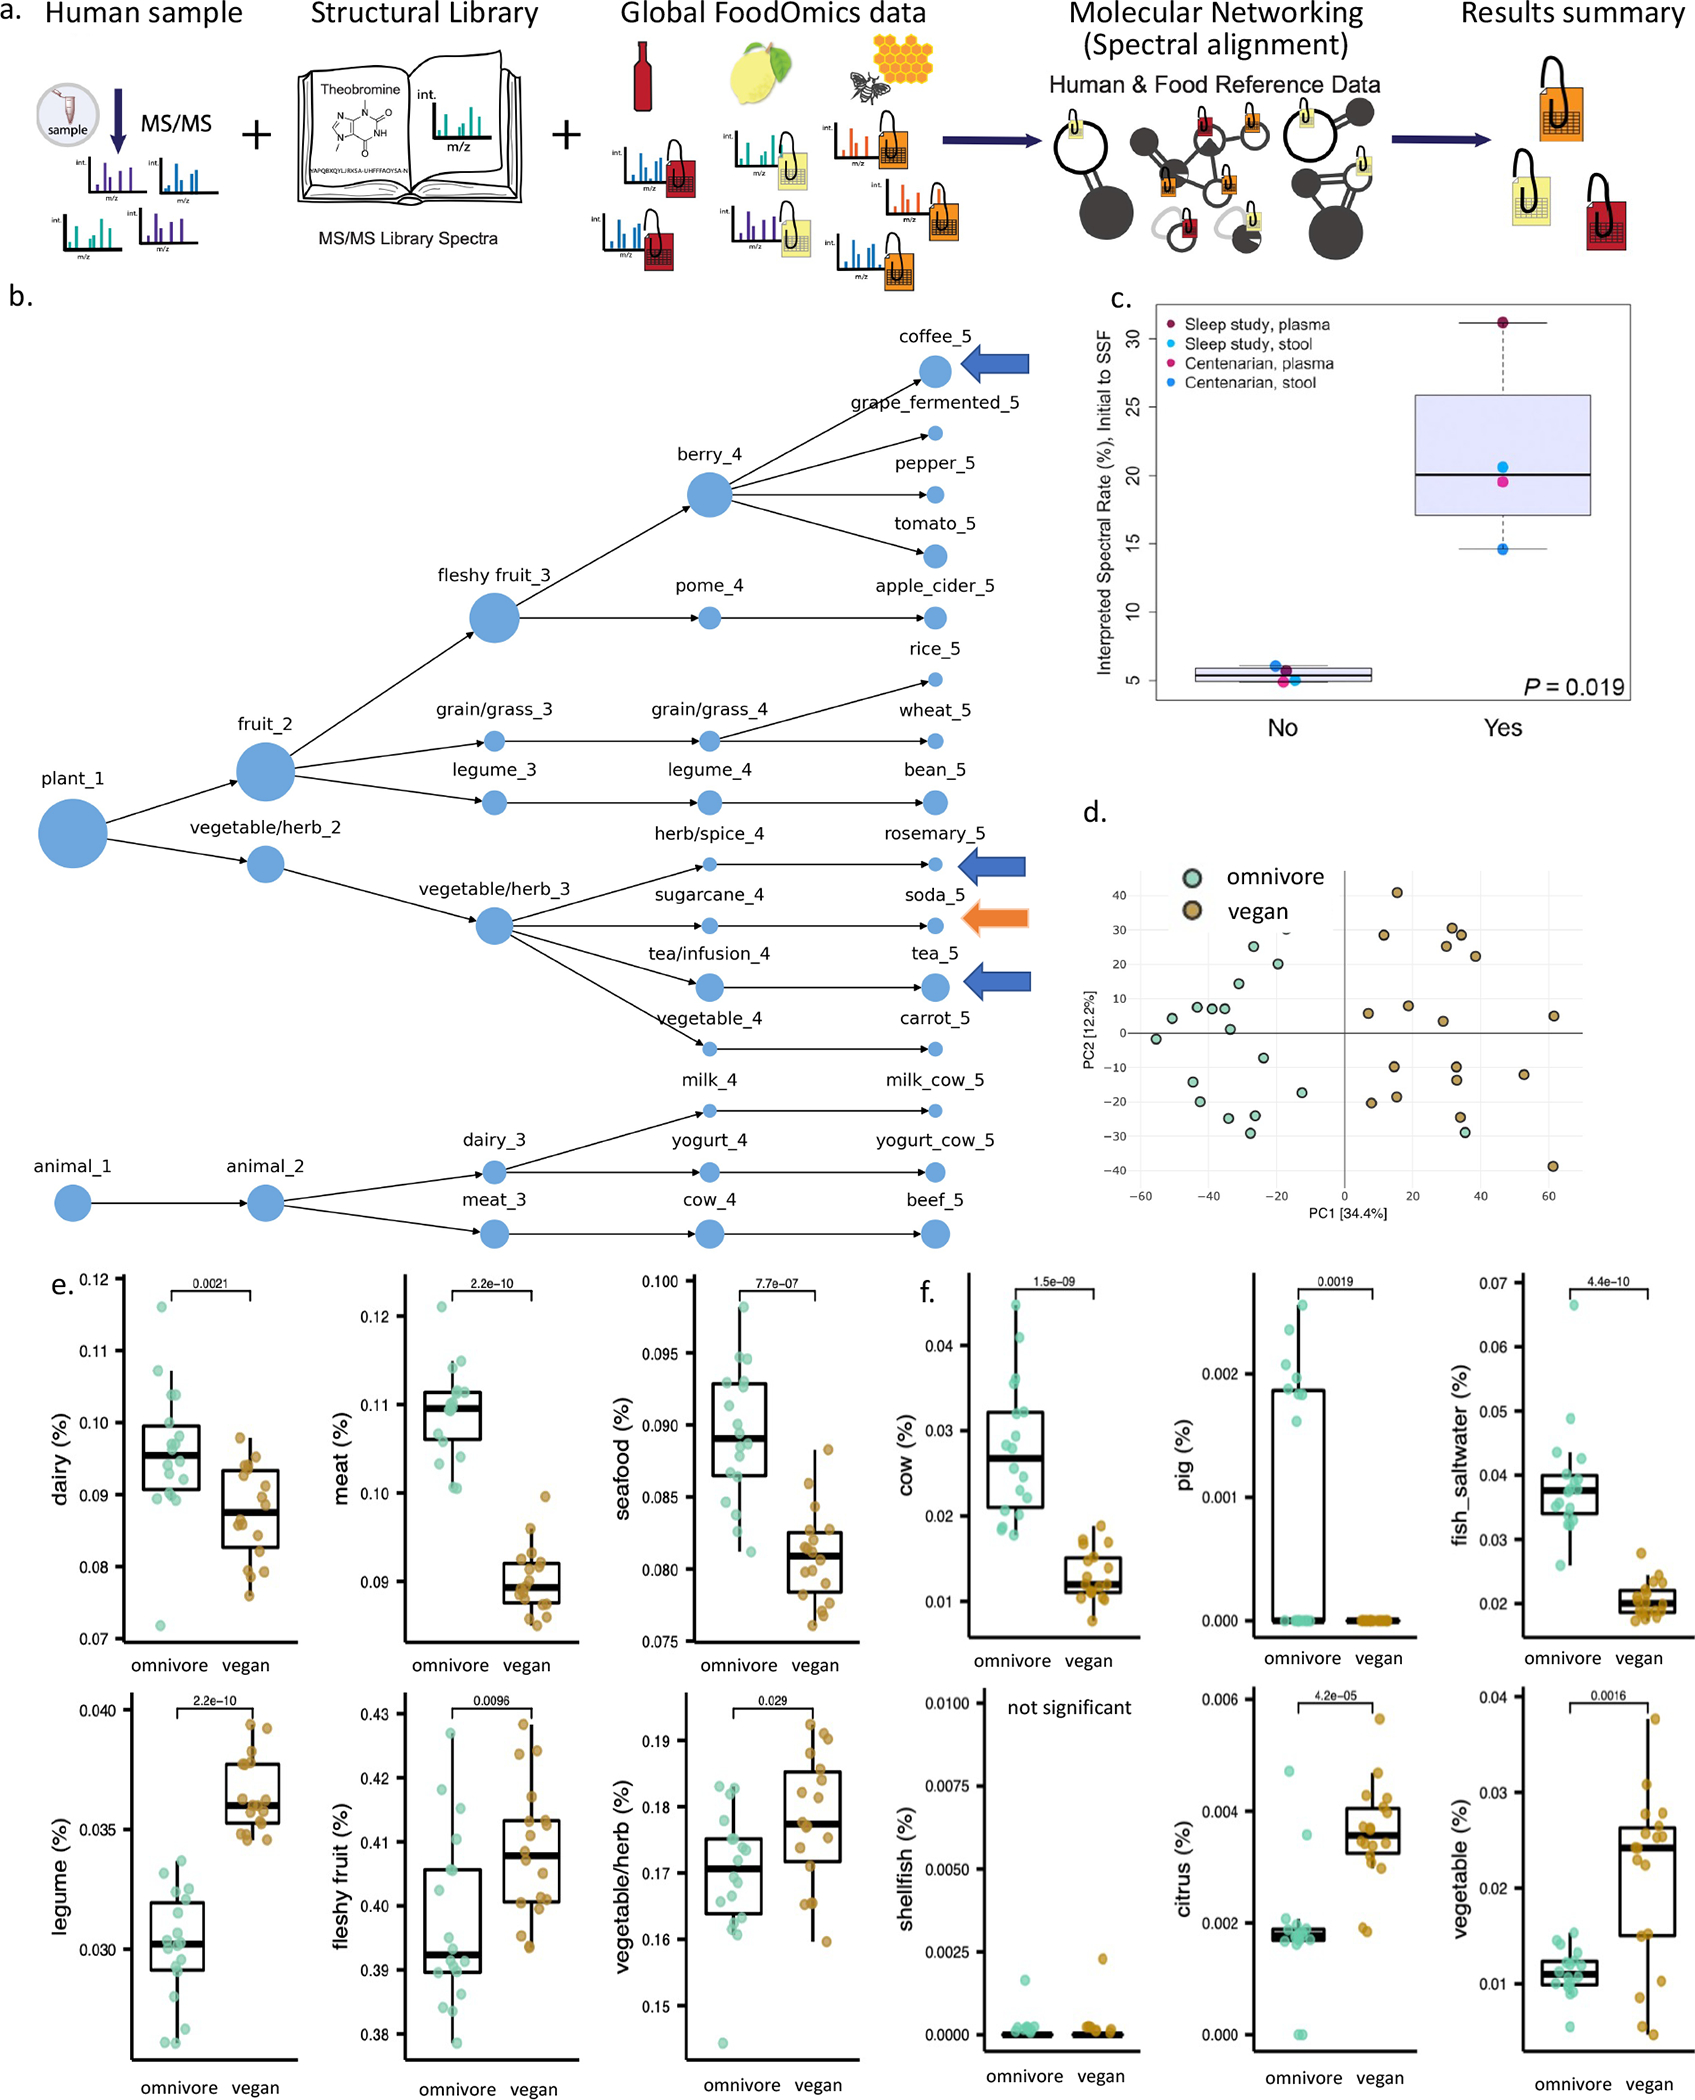
a. Food RDD analysis schema. b. Food spectral counts (1% FDR) observed in plasma from a sleep restriction and circadian misalignment study that controlled the diet of the participants (n=371 samples from 20 healthy adults). The size of node represents the relative number of spectral matches at each food level. Blue arrow - foods that could be explained based although they were not provided in the study, orange arrow– source is not known. c. A crossover experiment between centenarian data from Italy and a sleep and circadian study from the US, for both fecal and plasma samples. Study region specific foods consumed by those individuals (yes) vs a different set of study region specific foods (no), (one way Welch’s t-test, thick line is the mean, range within the box is the interquartile range, from the 25 to 75 quartile, min / max are the whiskers). d. PCA of food counts color coded by vegan (brown) vs omnivore data (green). e. Statistical analysis for the food counts at level 3 of the ontology, in relation to omnivore and vegan data (Wilcoxon test, n=36, 19 are vegan and 19 are omnivore). f. Same as e. but level 4 ontology using unique spectral counts (spectral usage is the percentage of MS/MS spectra used in the analysis. Since they are unnamed ontologies as one would find in microorganism phylogeny in microbiome science - e.g. kingdom, genus, species we have denoted these as layers, Table S1). For e-f, The boxes represent the interquartile range (IQR). Lower limit (Q1) is 25th percentile, median (Q2), upper limit (Q3) is 75th percentile. Bars show Q3+1.5xIQR and Q1–1.5xIQR.
References
Publication types
MeSH terms
Grants and funding
- R01 AG046171/AG/NIA NIH HHS/United States
- R01 MD011389/MD/NIMHD NIH HHS/United States
- U01 AG024904/AG/NIA NIH HHS/United States
- R01 AG061066/AG/NIA NIH HHS/United States
- UL1 TR002535/TR/NCATS NIH HHS/United States
- K12 HD000850/HD/NICHD NIH HHS/United States
- T32 DK007202/DK/NIDDK NIH HHS/United States
- U01 AG061359/AG/NIA NIH HHS/United States
- P50 AR060772/AR/NIAMS NIH HHS/United States
- RF1 AG058942/AG/NIA NIH HHS/United States
- T32 HL149646/HL/NHLBI NIH HHS/United States
- K12 GM068524/GM/NIGMS NIH HHS/United States
- T32 AR064194/AR/NIAMS NIH HHS/United States
- DP1 AT010885/AT/NCCIH NIH HHS/United States
- U19 AG063744/AG/NIA NIH HHS/United States
- P30 DK120515/DK/NIDDK NIH HHS/United States
- R21 AR075990/AR/NIAMS NIH HHS/United States
- DP2 AT010401/AT/NCCIH NIH HHS/United States
LinkOut - more resources
Full Text Sources
Other Literature Sources
Molecular Biology Databases
