

Developmental changes in gaze patterns in response to radial optic flow in toddlerhood and childhood
- PMID: 35799054
- PMCID: PMC9262903
- DOI: 10.1038/s41598-022-15730-5
Developmental changes in gaze patterns in response to radial optic flow in toddlerhood and childhood
Abstract
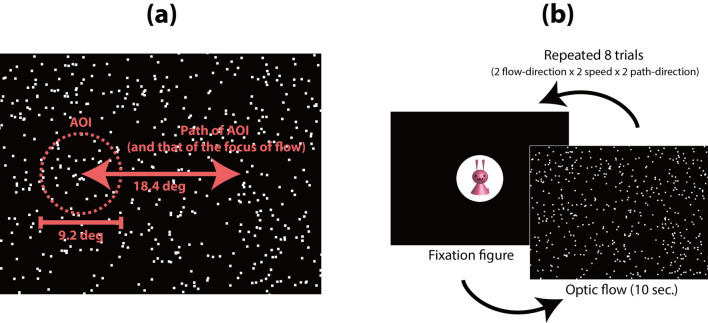
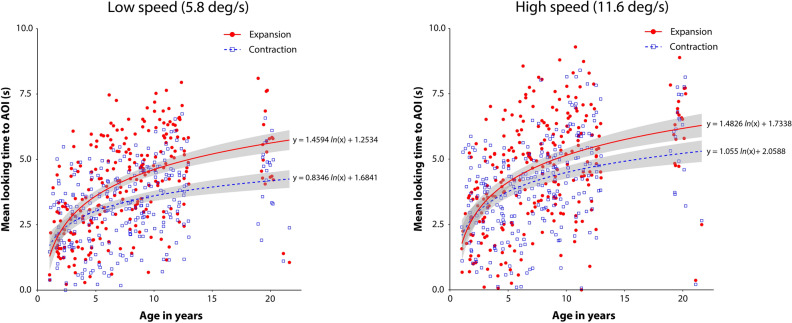
A large field visual motion pattern (optic flow) with a radial pattern provides a compelling perception of self-motion; a radially expanding/contracting optic flow generates the perception of forward/backward locomotion. Moreover, the focus of a radial optic flow, particularly an expansive flow, is an important visual cue to perceive and control the heading direction during human locomotion. Previous research has shown that human gaze patterns have an "expansion bias": a tendency to be more attracted to the focus of expansive flow than to the focus of contractive flow. We investigated the development of the expansion bias in children (N = 240, 1-12 years) and adults (N = 20). Most children aged ≥ 5 years and adults showed a significant tendency to shift their gaze to the focus of an expansive flow, whereas the youngest group (1-year-old children) showed a significant but opposing tendency; their gaze was more attracted to the focus of contractive flow than to the focus of expansive flow. The relationship between the developmental change from the "contraction bias" in early toddlerhood to the expansion bias in the later developmental stages and possible factors (e.g., global visual motion processing abilities and locomotor experiences) are discussed.
© 2022. The Author(s).
Conflict of interest statement
The authors declare no competing interests.
Figures


Similar articles
-
Infant-specific gaze patterns in response to radial optic flow.Sci Rep. 2016 Oct 6;6:34734. doi: 10.1038/srep34734. Sci Rep. 2016. PMID: 27708361 Free PMC article.
-
Differential processing of the direction and focus of expansion of optic flow stimuli in areas MST and V3A of the human visual cortex.J Neurophysiol. 2017 Jun 1;117(6):2209-2217. doi: 10.1152/jn.00031.2017. Epub 2017 Mar 15. J Neurophysiol. 2017. PMID: 28298300 Free PMC article.
-
Development of radial optic flow pattern sensitivity at different speeds.Vision Res. 2015 May;110(Pt A):68-75. doi: 10.1016/j.visres.2015.03.006. Epub 2015 Mar 20. Vision Res. 2015. PMID: 25796975
-
Walking humans and running mice: perception and neural encoding of optic flow during self-motion.Philos Trans R Soc Lond B Biol Sci. 2023 Jan 30;378(1869):20210450. doi: 10.1098/rstb.2021.0450. Epub 2022 Dec 13. Philos Trans R Soc Lond B Biol Sci. 2023. PMID: 36511417 Free PMC article. Review.
-
Human cortical areas underlying the perception of optic flow: brain imaging studies.Int Rev Neurobiol. 2000;44:269-92. doi: 10.1016/s0074-7742(08)60746-1. Int Rev Neurobiol. 2000. PMID: 10605650 Review.
Cited by
-
Augmented reality-based radial and lateral motion stimuli alter aiming performance in dart throwing.Sci Rep. 2025 Mar 28;15(1):10691. doi: 10.1038/s41598-025-94853-x. Sci Rep. 2025. PMID: 40155772 Free PMC article.
References
-
- Gibson JJ. The Perception of the Visual World. Houghton Mifflin; 1950.
-
- Warren WH, Hannon DJ. Direction of self-motion is perceived from optical flow. Nature. 1988;336:162–163. doi: 10.1038/336162a0. - DOI
-
- Lappe, M., Bremmer, F. & van ben Berg, A.V. Perception of self-motion from visual flow. Trends Cognit. Sci. 3, 329–336 (1999). - PubMed
Publication types
MeSH terms
LinkOut - more resources
Full Text Sources
