

Blood-brain barrier penetration prediction enhanced by uncertainty estimation
- PMID: 35799215
- PMCID: PMC9264551
- DOI: 10.1186/s13321-022-00619-2
Blood-brain barrier penetration prediction enhanced by uncertainty estimation
Abstract
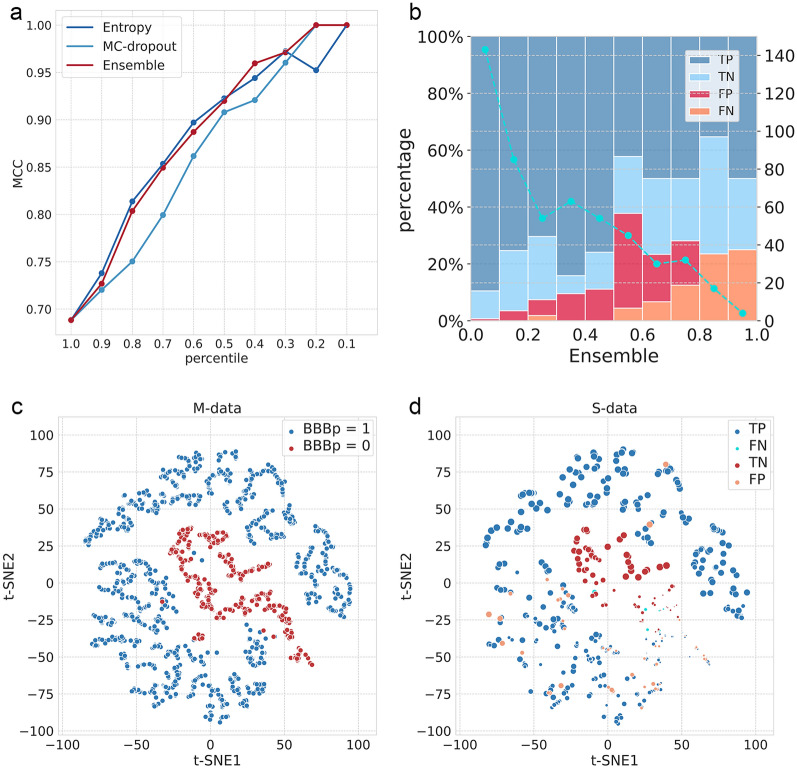
Blood-brain barrier is a pivotal factor to be considered in the process of central nervous system (CNS) drug development, and it is of great significance to rapidly explore the blood-brain barrier permeability (BBBp) of compounds in silico in early drug discovery process. Here, we focus on whether and how uncertainty estimation methods improve in silico BBBp models. We briefly surveyed the current state of in silico BBBp prediction and uncertainty estimation methods of deep learning models, and curated an independent dataset to determine the reliability of the state-of-the-art algorithms. The results exhibit that, despite the comparable performance on BBBp prediction between graph neural networks-based deep learning models and conventional physicochemical-based machine learning models, the GROVER-BBBp model shows greatly improvement when using uncertainty estimations. In particular, the strategy combined Entropy and MC-dropout can increase the accuracy of distinguishing BBB + from BBB - to above 99% by extracting predictions with high confidence level (uncertainty score < 0.1). Case studies on preclinical/clinical drugs for Alzheimer' s disease and marketed antitumor drugs that verified by literature proved the application value of uncertainty estimation enhanced BBBp prediction model, that may facilitate the drug discovery in the field of CNS diseases and metastatic brain tumors.
Keywords: BBBp prediction; Blood–brain barrier penetration; Uncertainty estimation.
© 2022. The Author(s).
Conflict of interest statement
The authors declare no competing interests.
Figures


Similar articles
-
Prediction of Blood-Brain Barrier Penetration (BBBP) Based on Molecular Descriptors of the Free-Form and In-Blood-Form Datasets.Molecules. 2021 Dec 7;26(24):7428. doi: 10.3390/molecules26247428. Molecules. 2021. PMID: 34946509 Free PMC article.
-
Attentive graph neural network models for the prediction of blood brain barrier permeability.bioRxiv [Preprint]. 2024 Oct 15:2024.10.12.617907. doi: 10.1101/2024.10.12.617907. bioRxiv. 2024. PMID: 39463958 Free PMC article. Preprint.
-
DeepBBBP: High Accuracy Blood-brain-barrier Permeability Prediction with a Mixed Deep Learning Model.Mol Inform. 2022 Oct;41(10):e2100315. doi: 10.1002/minf.202100315. Epub 2022 Apr 25. Mol Inform. 2022. PMID: 35393777
-
Chronic fatigue syndrome: neurological findings may be related to blood--brain barrier permeability.Med Hypotheses. 2001 Aug;57(2):231-7. doi: 10.1054/mehy.2001.1306. Med Hypotheses. 2001. PMID: 11461179 Review.
-
In silico predictions of blood-brain barrier penetration: considerations to "keep in mind".J Pharmacol Exp Ther. 2005 Nov;315(2):477-83. doi: 10.1124/jpet.104.075705. Epub 2005 May 26. J Pharmacol Exp Ther. 2005. PMID: 15919767 Review.
Cited by
-
Non-animal models for blood-brain barrier permeability evaluation of drug-like compounds.Sci Rep. 2024 Apr 17;14(1):8908. doi: 10.1038/s41598-024-59734-9. Sci Rep. 2024. PMID: 38632344 Free PMC article.
-
The Trends and Future Prospective of In Silico Models from the Viewpoint of ADME Evaluation in Drug Discovery.Pharmaceutics. 2023 Nov 12;15(11):2619. doi: 10.3390/pharmaceutics15112619. Pharmaceutics. 2023. PMID: 38004597 Free PMC article. Review.
-
Expanding Predictive Capacities in Toxicology: Insights from Hackathon-Enhanced Data and Model Aggregation.Molecules. 2024 Apr 17;29(8):1826. doi: 10.3390/molecules29081826. Molecules. 2024. PMID: 38675645 Free PMC article.
-
Experimental and Computational Methods to Assess Central Nervous System Penetration of Small Molecules.Molecules. 2024 Mar 13;29(6):1264. doi: 10.3390/molecules29061264. Molecules. 2024. PMID: 38542901 Free PMC article. Review.
-
Optimizing blood-brain barrier permeability in KRAS inhibitors: A structure-constrained molecular generation approach.J Pharm Anal. 2025 Aug;15(8):101337. doi: 10.1016/j.jpha.2025.101337. Epub 2025 May 9. J Pharm Anal. 2025. PMID: 40893438 Free PMC article.
References
Grants and funding
LinkOut - more resources
Full Text Sources
