

Phylogenies of the 16S rRNA gene and its hypervariable regions lack concordance with core genome phylogenies
- PMID: 35799218
- PMCID: PMC9264627
- DOI: 10.1186/s40168-022-01295-y
Phylogenies of the 16S rRNA gene and its hypervariable regions lack concordance with core genome phylogenies
Abstract
Background: The 16S rRNA gene is used extensively in bacterial phylogenetics, in species delineation, and now widely in microbiome studies. However, the gene suffers from intragenomic heterogeneity, and reports of recombination and an unreliable phylogenetic signal are accumulating. Here, we compare core gene phylogenies to phylogenies constructed using core gene concatenations to estimate the strength of signal for the 16S rRNA gene, its hypervariable regions, and all core genes at the intra- and inter-genus levels. Specifically, we perform four intra-genus analyses (Clostridium, n = 65; Legionella, n = 47; Staphylococcus, n = 36; and Campylobacter, n = 17) and one inter-genus analysis [41 core genera of the human gut microbiome (31 families, 17 orders, and 12 classes), n = 82].
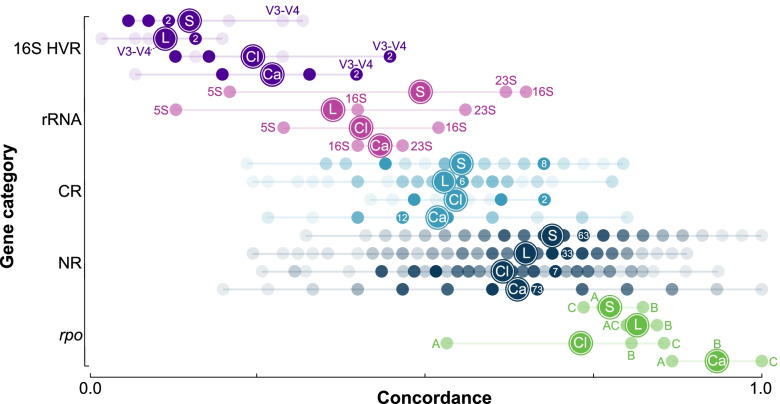
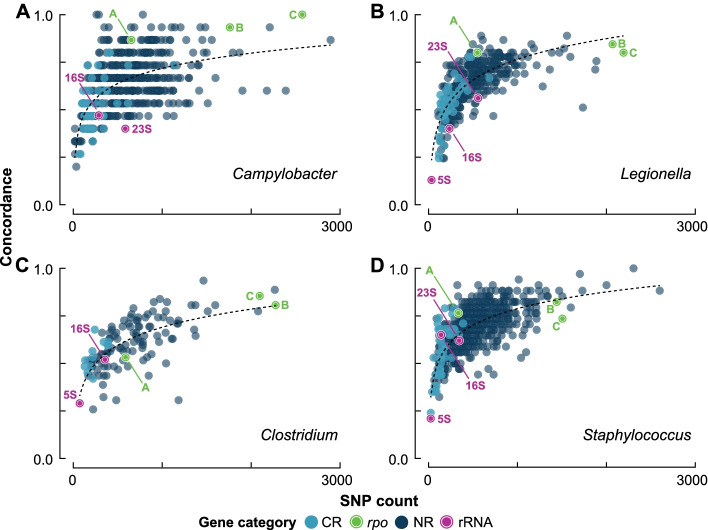
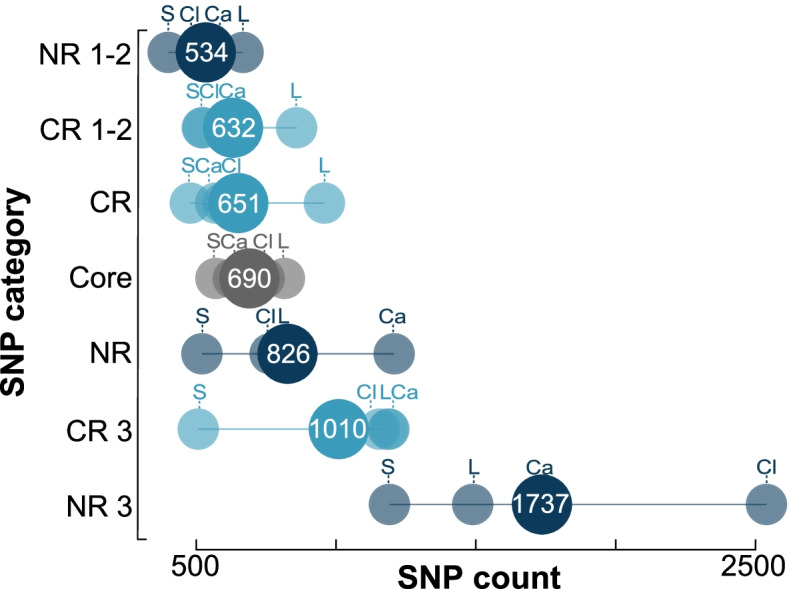
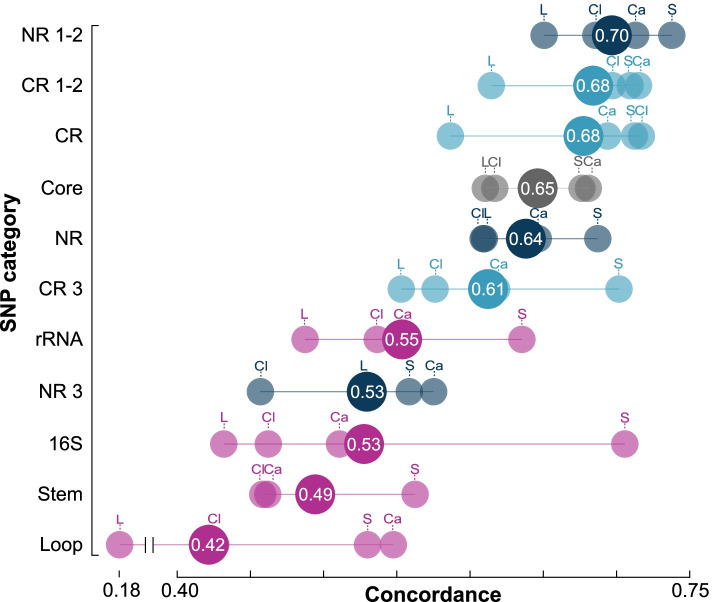
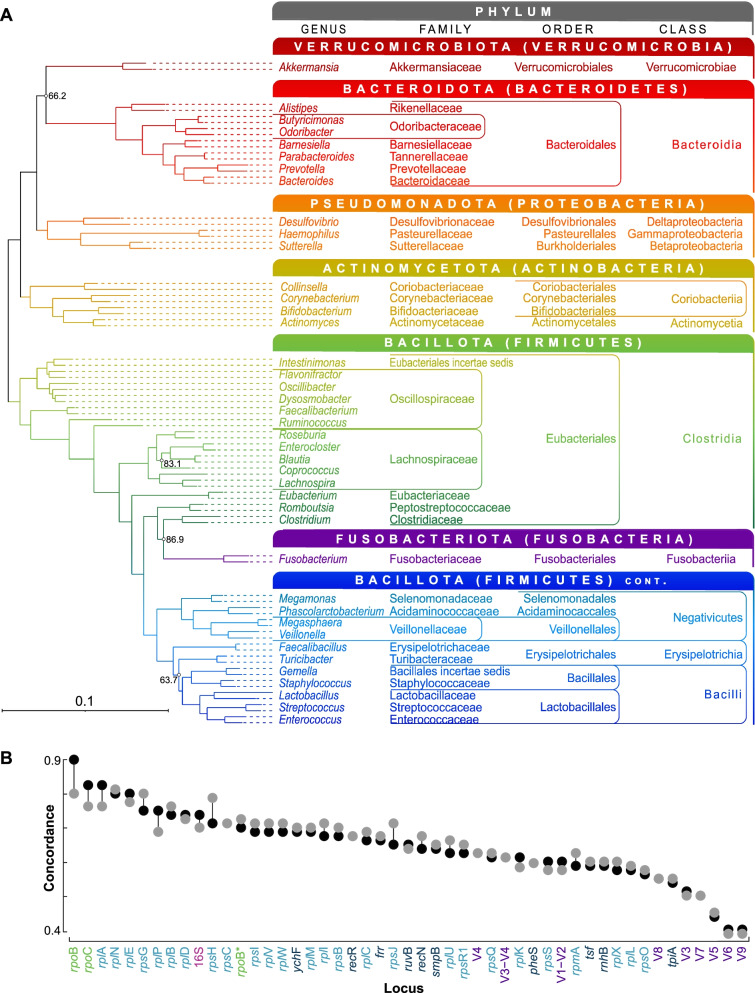
Results: At both taxonomic levels, the 16S rRNA gene was recombinant and subject to horizontal gene transfer. At the intra-genus level, the gene showed one of the lowest levels of concordance with the core genome phylogeny (50.7% average). Concordance for hypervariable regions was lower still, with entropy masking providing little to no benefit. A major factor influencing concordance was SNP count, which showed a positive logarithmic association. Using this relationship, we determined that 690 ± 110 SNPs were required for 80% concordance (average 16S rRNA gene SNP count was 254). We also found a wide range in 16S-23S-5S rRNA operon copy number among genomes (1-27). At the inter-genus level, concordance for the whole 16S rRNA gene was markedly higher (73.8% - 10th out of 49 loci); however, the most concordant hypervariable regions (V4, V3-V4, and V1-V2) ranked in the third quartile (62.5 to 60.0%).
Conclusions: Ramifications of a poor phylogenetic performance for the 16S rRNA gene are far reaching. For example, in addition to incorrect species/strain delineation and phylogenetic inference, it has the potential to confound community diversity metrics if phylogenetic information is incorporated - for example, with popular approaches such as Faith's phylogenetic diversity and UniFrac. Our results highlight the problematic nature of these approaches and their use (along with entropy masking) is discouraged. Lastly, the wide range in 16S rRNA gene copy number among genomes also has a strong potential to confound diversity metrics. Video Abstract.
Keywords: 16S rRNA gene; Comparative phylogenomics; Diversity metrics; Entropy masking; Horizontal gene transfer; Microbiome; Recombination; Ribosome; Species phylogeny.
© 2022. The Author(s).
Conflict of interest statement
The authors declare that they have no competing interests.
Figures
Similar articles
-
An accurate and efficient experimental approach for characterization of the complex oral microbiota.Microbiome. 2015 Oct 5;3:48. doi: 10.1186/s40168-015-0110-9. Microbiome. 2015. PMID: 26437933 Free PMC article.
-
Microbial Diversity Biased Estimation Caused by Intragenomic Heterogeneity and Interspecific Conservation of 16S rRNA Genes.Appl Environ Microbiol. 2023 May 31;89(5):e0210822. doi: 10.1128/aem.02108-22. Epub 2023 Apr 27. Appl Environ Microbiol. 2023. PMID: 37129483 Free PMC article.
-
Optimisation of methods for bacterial skin microbiome investigation: primer selection and comparison of the 454 versus MiSeq platform.BMC Microbiol. 2017 Jan 21;17(1):23. doi: 10.1186/s12866-017-0927-4. BMC Microbiol. 2017. PMID: 28109256 Free PMC article.
-
Reprint of New opportunities for improved ribotyping of C. difficile clinical isolates by exploring their genomes.J Microbiol Methods. 2013 Dec;95(3):425-40. doi: 10.1016/j.mimet.2013.09.009. Epub 2013 Sep 16. J Microbiol Methods. 2013. PMID: 24050948 Review.
-
Critical review of 16S rRNA gene sequencing workflow in microbiome studies: From primer selection to advanced data analysis.Mol Oral Microbiol. 2023 Oct;38(5):347-399. doi: 10.1111/omi.12434. Epub 2023 Oct 7. Mol Oral Microbiol. 2023. PMID: 37804481 Review.
Cited by
-
Comparison of Oral Microbial Composition and Determinants Encoding Antimicrobial Resistance in Dogs and Their Owners.Antibiotics (Basel). 2023 Oct 20;12(10):1554. doi: 10.3390/antibiotics12101554. Antibiotics (Basel). 2023. PMID: 37887255 Free PMC article.
-
Macroevolutionary patterns in intragenomic rDNA variability among planktonic foraminifera.PeerJ. 2023 Apr 25;11:e15255. doi: 10.7717/peerj.15255. eCollection 2023. PeerJ. 2023. PMID: 37123000 Free PMC article.
-
Impact of Soil Microbiomes on Mung Bean Cultivation: Insights from 16S rRNA Metagenomics.Mol Biotechnol. 2025 Apr 4. doi: 10.1007/s12033-025-01425-5. Online ahead of print. Mol Biotechnol. 2025. PMID: 40186063
-
16S rRNA phylogeny and clustering is not a reliable proxy for genome-based taxonomy in Streptomyces.Microb Genom. 2024 Sep;10(9):001287. doi: 10.1099/mgen.0.001287. Microb Genom. 2024. PMID: 39254673 Free PMC article.
-
Genome-resolved metagenomics: a game changer for microbiome medicine.Exp Mol Med. 2024 Jul;56(7):1501-1512. doi: 10.1038/s12276-024-01262-7. Epub 2024 Jul 1. Exp Mol Med. 2024. PMID: 38945961 Free PMC article. Review.
References
Publication types
MeSH terms
Substances
LinkOut - more resources
Full Text Sources
