. 2022 Jul 8;10(1):105.
doi: 10.1186/s40168-022-01275-2.

Transplantation of bacteriophages from ulcerative colitis patients shifts the gut bacteriome and exacerbates the severity of DSS colitis

Affiliations

Transplantation of bacteriophages from ulcerative colitis patients shifts the gut bacteriome and exacerbates the severity of DSS colitis

Anshul Sinha et al. Microbiome. .

Abstract

Background: Inflammatory bowel diseases (IBDs) including Crohn's disease (CD) and ulcerative colitis (UC) are characterized by chronic and debilitating gut inflammation. Altered bacterial communities of the intestine are strongly associated with IBD initiation and progression. The gut virome, which is primarily composed of bacterial viruses (bacteriophages, phages), is thought to be an important factor regulating and shaping microbial communities in the gut. While alterations in the gut virome have been observed in IBD patients, the contribution of these viruses to alterations in the bacterial community and heightened inflammatory responses associated with IBD patients remains largely unknown.

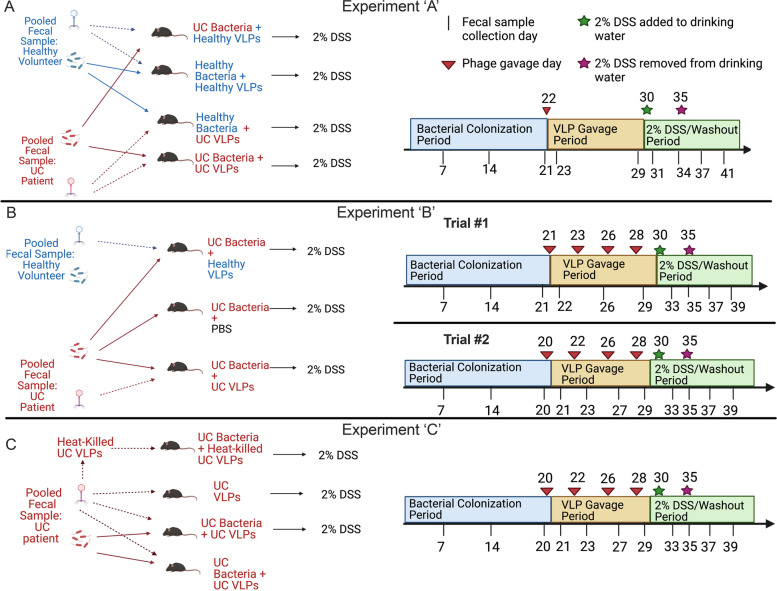
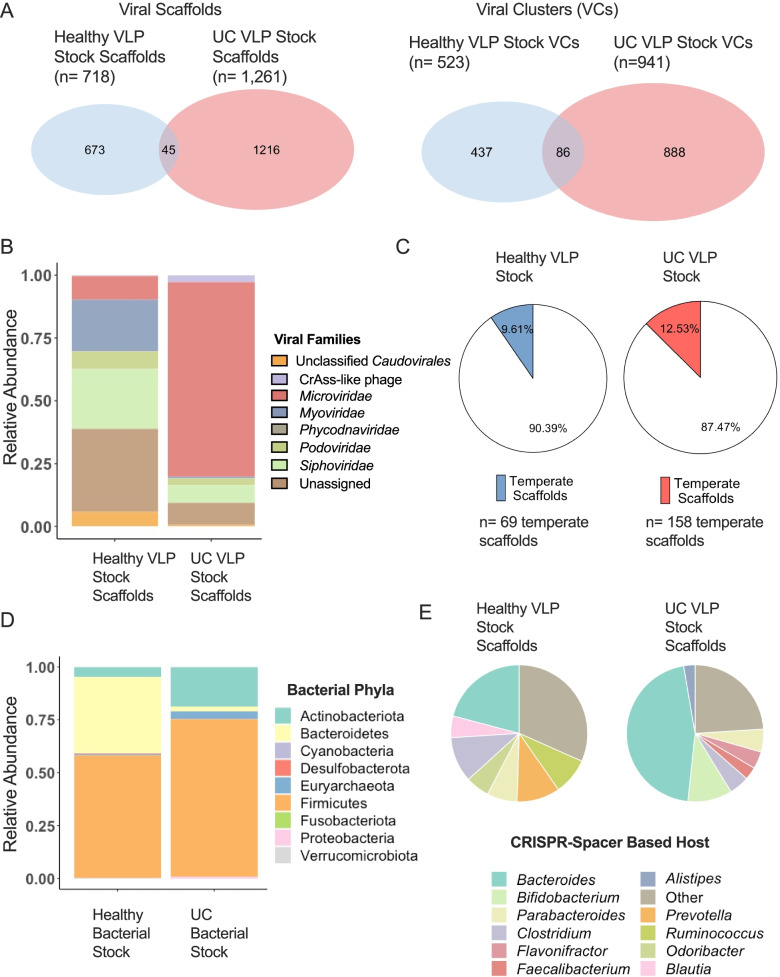
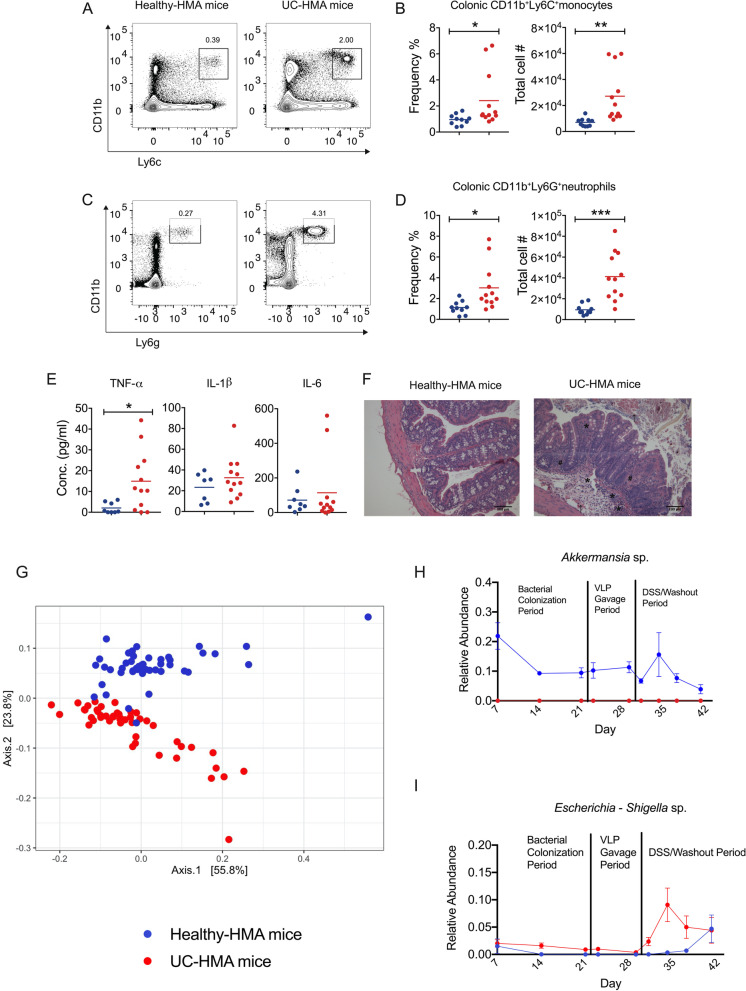
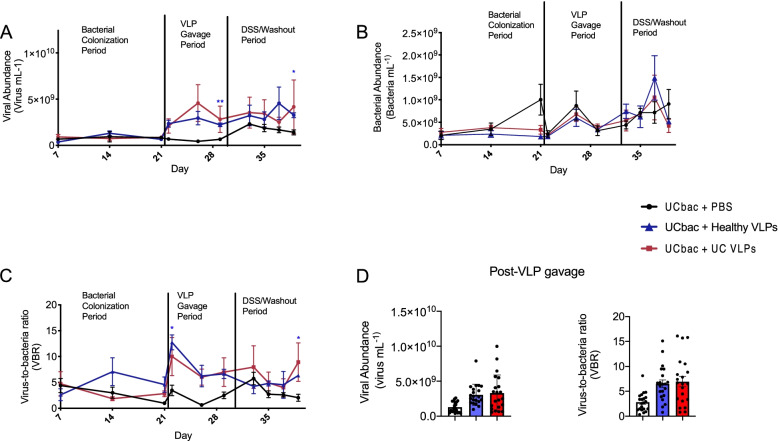
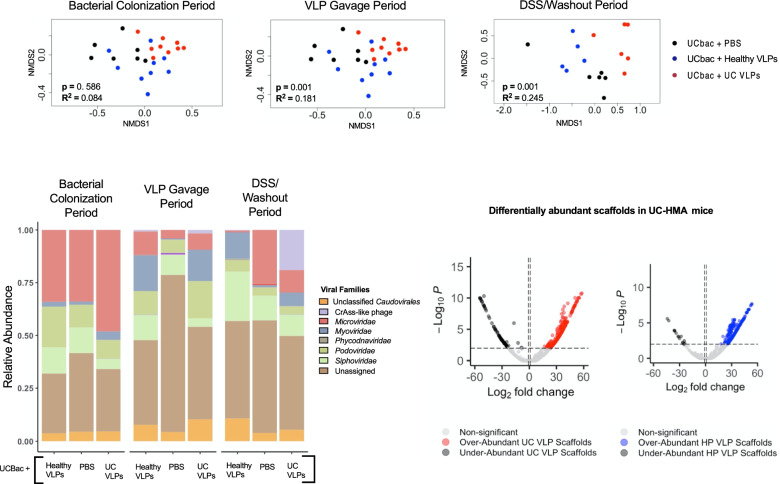
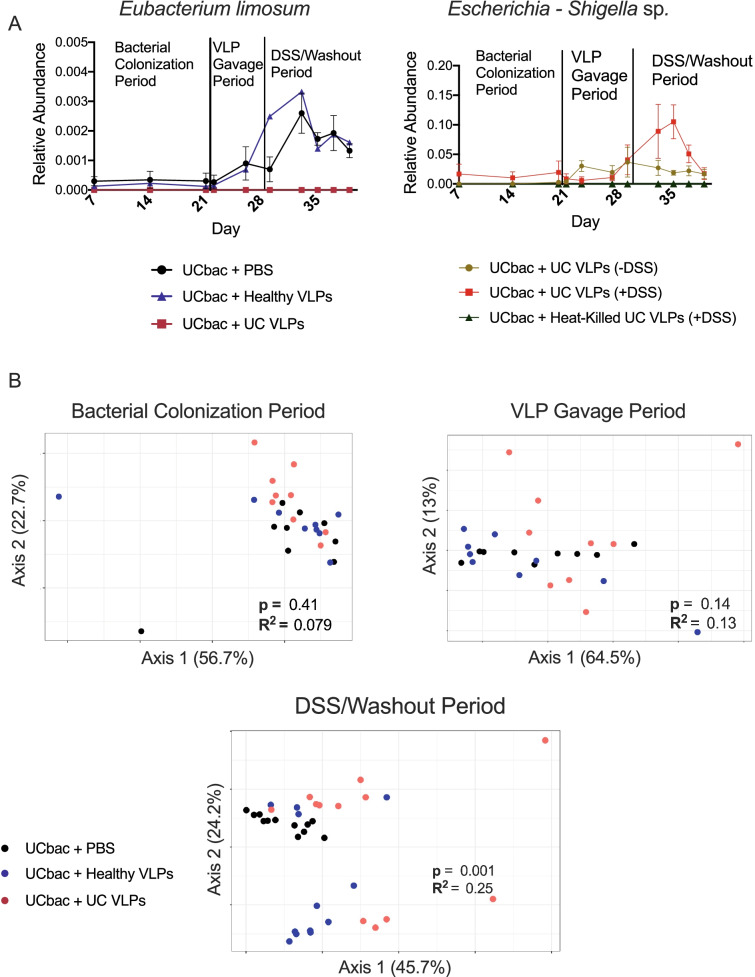
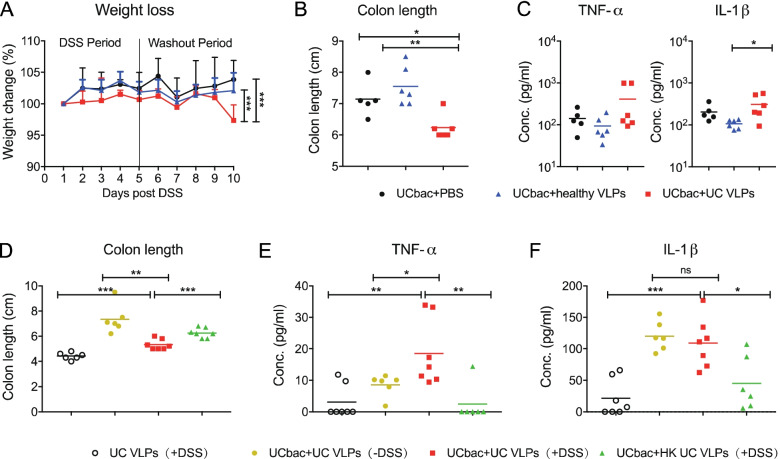
Results: Here, we performed in vivo microbial cross-infection experiments to follow the effects of fecal virus-like particles (VLPs) isolated from UC patients and healthy controls on bacterial diversity and severity of experimental colitis in human microbiota-associated (HMA) mice. Shotgun metagenomics confirmed that several phages were transferred to HMA mice, resulting in treatment-specific alterations in the gut virome. VLPs from healthy and UC patients also shifted gut bacterial diversity of these mice, an effect that was amplified during experimental colitis. VLPs isolated from UC patients specifically altered the relative abundance of several bacterial taxa previously implicated in IBD progression. Additionally, UC VLP administration heightened colitis severity in HMA mice, as indicated by shortened colon length and increased pro-inflammatory cytokine production. Importantly, this effect was dependent on intact VLPs.

Conclusions: Our findings build on recent literature indicating that phages are dynamic regulators of bacterial communities in the gut and implicate the intestinal virome in modulating intestinal inflammation and disease. Video Abstract.

Keywords: Bacteriophages; DSS colitis; Inflammatory bowel disease; Intestine; Microbiota; Ulcerative colitis.


Conflict of interest statement

The authors declare that they have no competing interests.

Figures

Fig. 1
Fig. 1
Schematic and timeline of the experimental model. A HMA mice administered healthy or UC bacterial communities were given a single dose of healthy or UC VLPs, followed by 2% DSS. B UC-HMA mice were given four doses of healthy VLPs, UC VLPs, or PBS, followed by 2% DSS. C UC-HMA or GF mice were given four doses of UC VLPs or heat-killed UC VLPs. All groups were then given 2% DSS, except one group of UC-HMA mice given UC VLPs. Each treatment group included 5 or 6 GF or HMA mice per experiment housed in three separate cages. In each experiment 200 μL of bacterial and VLP communities were administered to mice by oral gavage at equal concentrations (1–3 × 10⁸ VLPs or bacterial cells/mL)
Fig. 2
Fig. 2
Composition of pooled healthy and UC VLP and bacterial inoculums. A Shared and unique viral scaffolds and VCs between pooled healthy and UC VLP inoculums. B Relative abundance of viral families in each VLP inoculum. C Proportion of scaffolds in VLP inoculums identified as temperate. D Relative abundance of bacterial phyla in each pooled bacterial inoculum. E Proportion of scaffolds based on CRISPR spacer predicted hosts. The top 7 most prevalent host predictions in each treatment group are displayed. VLP shotgun metagenomics was used for VLP inoculum analyses and 16S rRNA gene sequencing of the V4 region was used for bacterial inoculum analyses. Inoculum samples were pooled using equal weight of 3 fecal samples from healthy volunteers or UC patients
Fig. 3
Fig. 3
Mice colonized with UC patient-derived fecal bacteria exhibit increased inflammation during experimental colitis. Data shown is from experiment “A.” A Representative contour plots and B mean frequency and absolute number of colonic inflammatory monocytes (CD11b+Ly6C+Ly6G) at day 10 post-DSS administration. C Representative contour plots and D mean frequency and absolute number of colonic neutrophils (CD11b+Ly6CLy6G+) at day 10 post-DSS administration. E Mean TNF-α, IL-1β, and IL-6 production from colon tissue explants at day 10 post-DSS administration. F Representative H&E staining of paraffin-embedded cross colon sections at day 10 post-DSS administration (scale bars are 100μm). Asterisk (*) indicates area of cellular infiltration; number sign (#) indicates area of distorted crypt architecture; black arrow indicates the area of bleeding. Data were analyzed using a two-tailed unpaired parametric t test (*p < 0.05, **p < 0.01, ***p < 0.001). GI 16S rRNA gene sequencing of HMA mouse fecal bacteria. G PCoA on weighted UniFrac distances. H, I Mean relative abundance of Akkermansia sp. (H) and Escherichia-Shigella sp. (I) over time in HMA mice. Species were confirmed to be differentially abundant using ANCOM II. Error bars, SE. B, D, E Error bars, SD. Data shown from one experiment. Dots in B, D, and E represent individual mice (n=8 healthy-HMA mice, n=12 UC-HMA mice). Dots in G, H, and I indicate pooled mouse fecal samples at a single sampling point. At each sampling point, mouse fecal samples in each cage were pooled from 1 or 2 mice (n=6 cages per group, 1 or 2 mice per cage)
Fig. 4
Fig. 4
Healthy and UC VLP administration increases viral abundance and VBR in UC-HMA mice. Data shown is from experiment “B” (trial #1). A Viral abundance was determined from mouse fecal pellets using epifluorescence microscopy and compared to B bacterial abundances obtained by flow cytometry after staining with SybrGREEN I to obtain C VBRs. D Mean total viral abundance and mean total VBR post-VLP gavage were compared between treatment groups after the first dose of VLPs or PBS was given to mice. AC Significance was assessed using a repeated measure two-way ANOVA and Dunnett’s multiple comparisons test (*p ≤ 0.05, **p≤ 0.01) and using a Geisser-Greenhouse correction. Red and blue asterisks indicate significant differences between the PBS control and HMA mice given UC VLPs and healthy VLPs, respectively. Dots represent abundance or VBR of pooled mouse fecal samples at a single sampling point. At each sampling point, mouse fecal samples in each cage were pooled from 2 mice (n=3 cages per group, 6 mice per group). Error bars, SE. UC bac, UC-HMA mice
Fig. 5
Fig. 5
Differences in virome composition of UC-HMA mice after VLP gavage. Data shown is from experiment B (trial #1). A NMDS of Bray-Curtis dissimilarity of scaffolds between HMA mice given healthy VLPs, UC VLPs, or PBS during the (left) bacterial colonization period, (middle) VLP gavage period, or (right) DSS/washout period. Significant differences in Bray-Curtis dissimilarity were assessed in each time period using adonis PERMANOVA (p ≤ 0.05). Dots represent pooled mouse fecal samples at a single sampling point. All sampling points of the longitudinal study were included in the NMDS and comparative analyses. NMDS stress: bacterial colonization period (stress = 0.146), VLP gavage period (stress = 0.181), DSS/washout (stress = 0.148). B Relative abundance of viral families between treatment groups over the experimental time periods. (C) DESeq2 differentially abundant scaffolds between UC-HMA mice given healthy (left) or UC (right) VLPs compared to the PBS control. Differentially abundant scaffolds represent those that significantly changed after VLP gavage between treatment groups. Scaffolds with adjusted p values ≤ 0.01 and with log2fold changes greater or less than 1 were considered differentially abundant using a two-tailed wald test. Black points on volcano plots indicate overlayed under-abundant scaffolds. At each sampling point, mouse fecal samples in each cage were pooled from 2 mice (n=3 cages per group, 6 mice per group; UCbac, UC-HMA mice)
Fig. 6
Fig. 6
UC VLP administration differentially modulates bacterial community composition in UC-HMA mice. A Mean relative abundance of Eubacterium limosum (left, data shown is from experiment “B” (trial #1) and Escherichia-Shigella sp. (right, data shown is from experiment “C”) in UC-HMA mice over time was determined using 16S rRNA gene sequencing. ANCOM II was used to confirm that these species were differentially abundant between treatment groups [50]. Error bars, SE. B Data shown is from experiment ‘B’ (trial #1). PCoA on weighted UniFrac distance between HMA mice during the bacterial colonization period, VLP gavage period, and DSS/washout period. Significant differences between weighted UniFrac distances were assessed using PERMANOVA (p ≤ 0.05) (bottom). Samples from all sampling points were included in the PCoA and comparative analyses. Mouse fecal samples in each cage were pooled from 2 mice (n=3 cages, 6 mice per treatment group). Dots represent pooled mouse fecal samples at a single sampling point. UCbac, UC-HMA mice
Fig. 7
Fig. 7
UC VLPs exacerbate the severity of experimental colitis in the presence of gut bacteria. AC Data shown is from experiment “B” (trial #1). DF Data shown is from experiment “C.” A Mean body weight change during experimental colitis induction between the indicated groups. B Mean colon length at day 5 post-DSS administration between the three groups. C Mean inflammatory cytokine production in colon tissue explant at day 5 post-DSS administration. D Mean length of the colon at day 5 post-DSS administration of the following groups: UC bacteria colonized mice treated with UC VLPs with/without DSS challenge, UC bacteria colonized mice treated with heat-killed (HK) UC VLPs and UC VLP treatment alone. E, F Mean inflammatory cytokine production in colon tissue explants of the indicated groups. A Data were analyzed by two-way ANOVA with Bonferroni for multiple comparisons. BF Data were analyzed using a two-tailed unpaired parametric t test (*p < 0.05, **p < 0.01, ***p < 0.001). Error bars, SD. Data shown from one experiment. Each dot represents an individual mouse. UCbac, UC-HMA mice

Similar articles

Cited by

References

    1. Valdes AM, Walter J, Segal E, Spector TD. Role of the gut microbiota in nutrition and health. BMJ. 2018;361:k2179. doi: 10.1136/bmj.k2179. - DOI - PMC - PubMed
    1. Belkaid Y, Hand TW. Role of the microbiota in immunity and inflammation. Cell. 2014;157:121–141. doi: 10.1016/j.cell.2014.03.011. - DOI - PMC - PubMed
    1. Arpaia N, et al. Metabolites produced by commensal bacteria promote peripheral regulatory T-cell generation. Nature. 2013;504:451–455. doi: 10.1038/nature12726. - DOI - PMC - PubMed
    1. Atarashi K, et al. Treg induction by a rationally selected mixture of Clostridia strains from the human microbiota. Nature. 2013;500:232–236. doi: 10.1038/nature12331. - DOI - PubMed
    1. Furusawa Y, et al. Commensal microbe-derived butyrate induces the differentiation of colonic regulatory T cells. Nature. 2013;504:446–450. doi: 10.1038/nature12721. - DOI - PubMed

Publication types

Grants and funding