

Identification of a cytokine-dominated immunosuppressive class in squamous cell lung carcinoma with implications for immunotherapy resistance
- PMID: 35799269
- PMCID: PMC9264601
- DOI: 10.1186/s13073-022-01079-x
Identification of a cytokine-dominated immunosuppressive class in squamous cell lung carcinoma with implications for immunotherapy resistance
Abstract
Background: Immune checkpoint blockade (ICB) therapy has revolutionized the treatment of lung squamous cell carcinoma (LUSC). However, a significant proportion of patients with high tumour PD-L1 expression remain resistant to immune checkpoint inhibitors. To understand the underlying resistance mechanisms, characterization of the immunosuppressive tumour microenvironment and identification of biomarkers to predict resistance in patients are urgently needed.
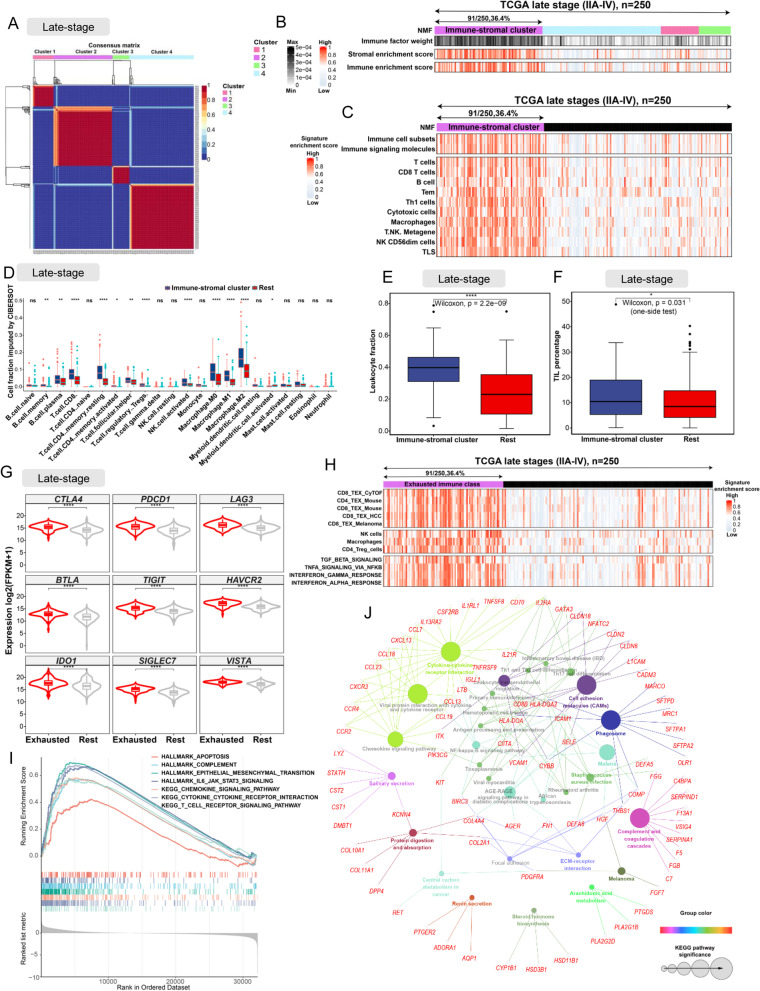
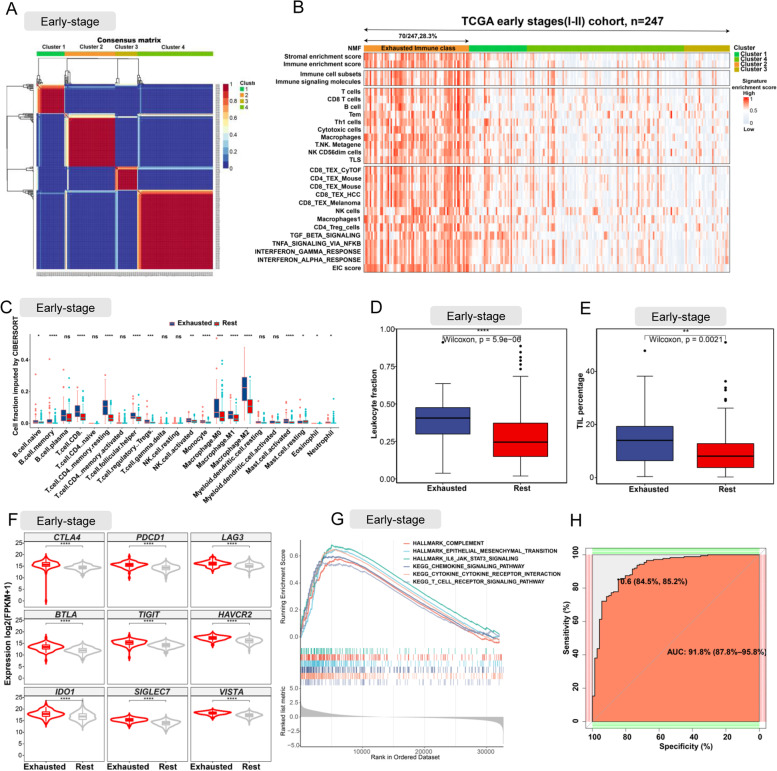
Methods: Our study retrospectively analysed RNA sequencing data of 624 LUSC samples. We analysed gene expression patterns from tumour microenvironment by unsupervised clustering. We correlated the expression patterns with a set of T cell exhaustion signatures, immunosuppressive cells, clinical characteristics, and immunotherapeutic responses. Internal and external testing datasets were used to validate the presence of exhausted immune status.
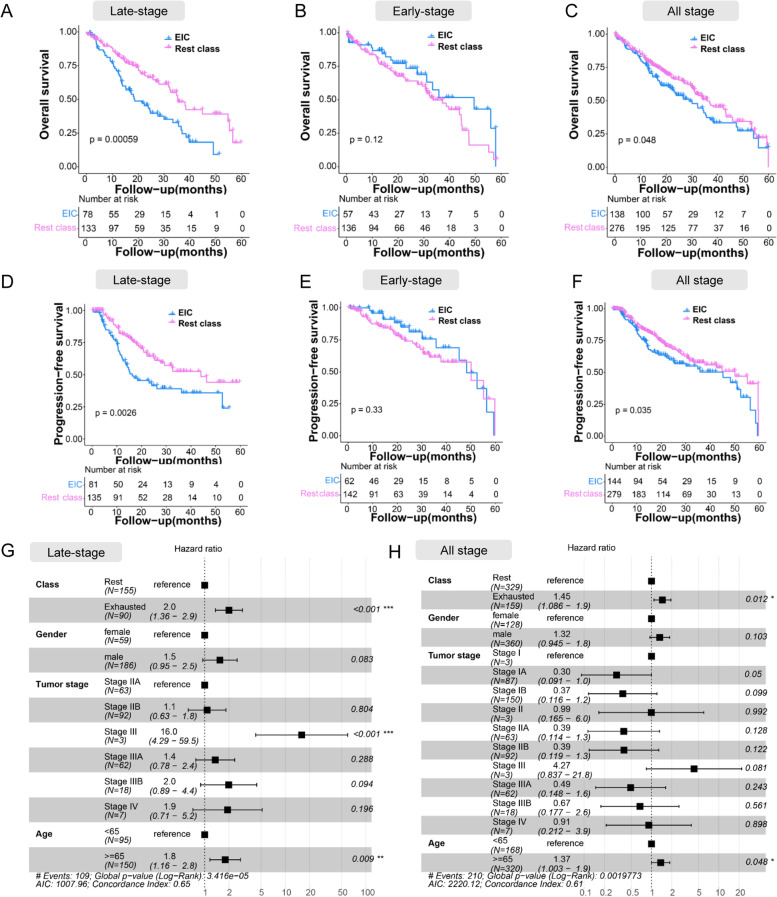
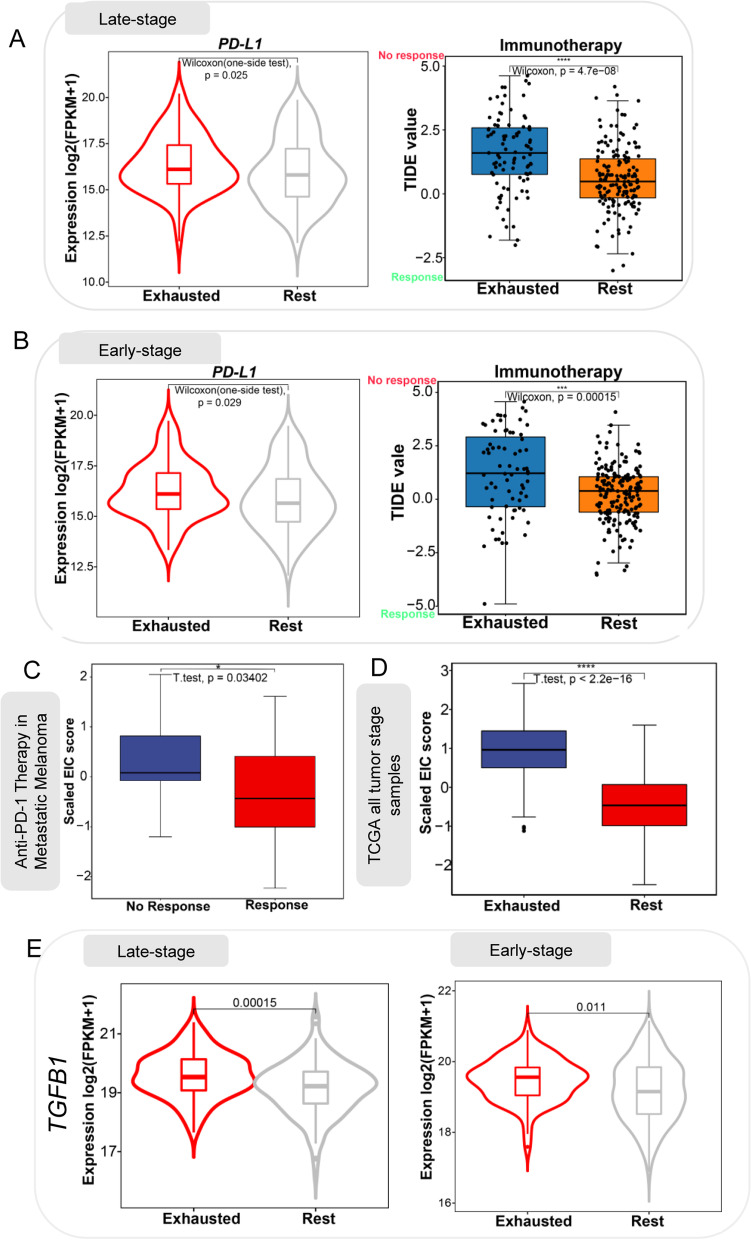
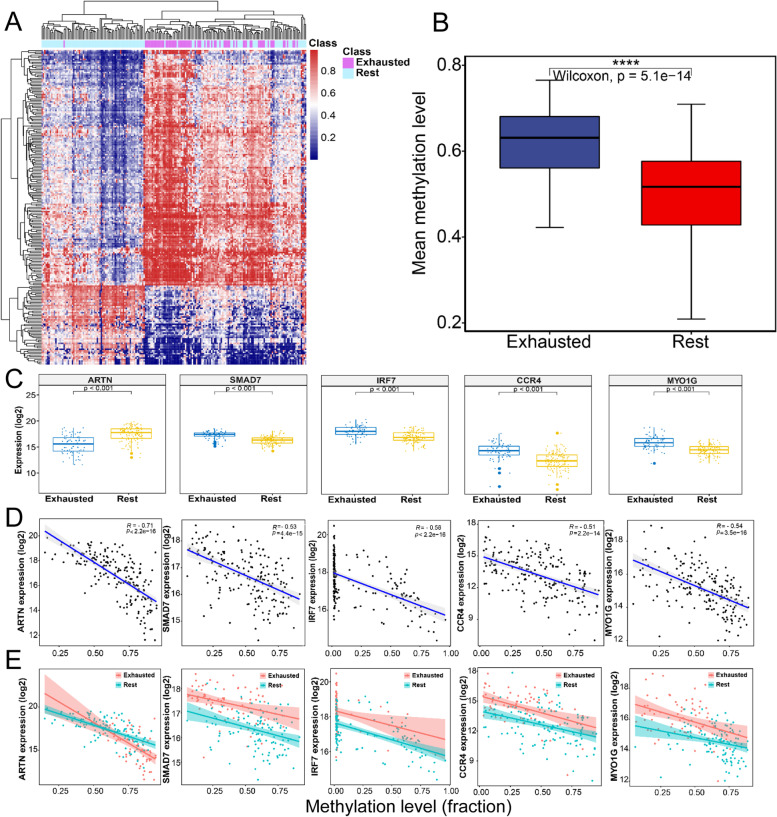
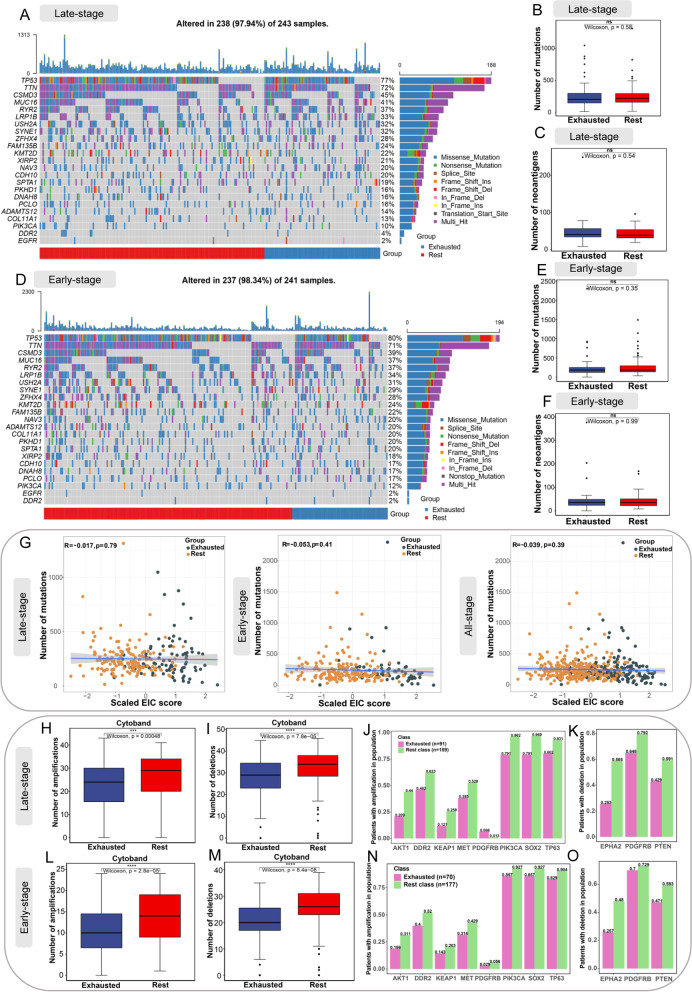
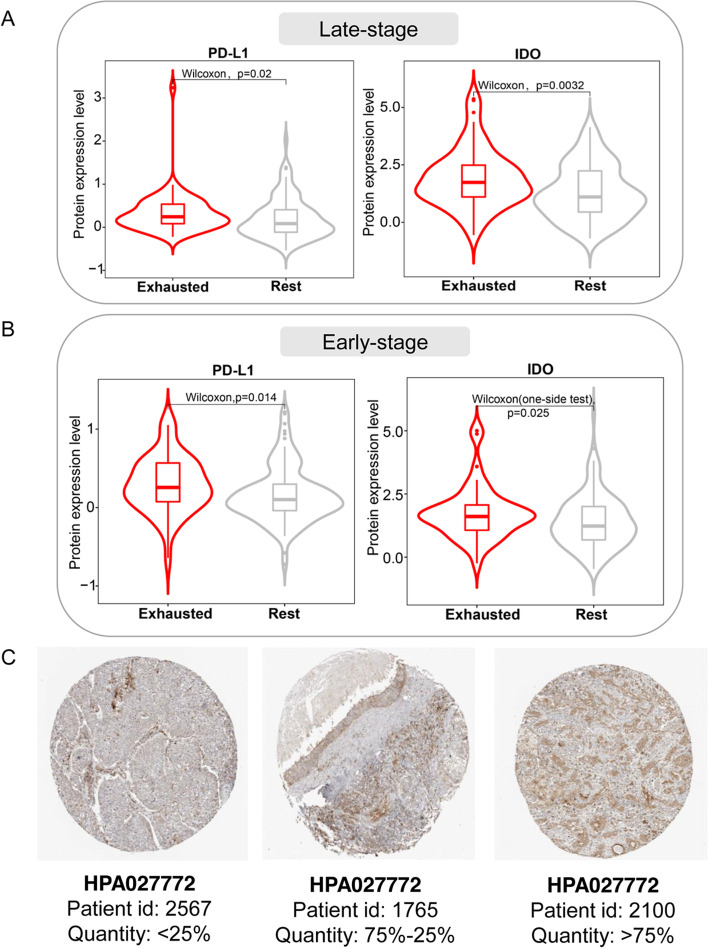
Results: Approximately 28 to 36% of LUSC patients were found to exhibit significant enrichments of T cell exhaustion signatures, high fraction of immunosuppressive cells (M2 macrophage and CD4 Treg), co-upregulation of 9 inhibitory checkpoints (CTLA4, PDCD1, LAG3, BTLA, TIGIT, HAVCR2, IDO1, SIGLEC7, and VISTA), and enhanced expression of anti-inflammatory cytokines (e.g. TGFβ and CCL18). We defined this immunosuppressive group of patients as exhausted immune class (EIC). Although EIC showed a high density of tumour-infiltrating lymphocytes, these were associated with poor prognosis. EIC had relatively elevated PD-L1 expression, but showed potential resistance to ICB therapy. The signature of 167 genes for EIC prediction was significantly enriched in melanoma patients with ICB therapy resistance. EIC was characterized by a lower chromosomal alteration burden and a unique methylation pattern. We developed a web application ( http://lilab2.sysu.edu.cn/tex & http://liwzlab.cn/tex ) for researchers to further investigate potential association of ICB resistance based on our multi-omics analysis data.
Conclusions: We introduced a novel LUSC immunosuppressive class which expressed high PD-L1 but showed potential resistance to ICB therapy. This comprehensive characterization of immunosuppressive tumour microenvironment in LUSC provided new insights for further exploration of resistance mechanisms and optimization of immunotherapy strategies.
Keywords: Immune checkpoint blockade resistance; Immunogenomics; Immunosuppressive cytokine; LUSC; T cell exhaustion; Tumour microenvironment.
© 2022. The Author(s).
Conflict of interest statement
The authors declare that they do not have any competing interests.
Figures
Similar articles
-
Identification of cytokine-predominant immunosuppressive class and prognostic risk signatures in glioma.J Cancer Res Clin Oncol. 2023 Nov;149(14):13185-13200. doi: 10.1007/s00432-023-05173-4. Epub 2023 Jul 21. J Cancer Res Clin Oncol. 2023. PMID: 37479756 Free PMC article.
-
Identification of immunosuppressive signature subtypes and prognostic risk signatures in triple-negative breast cancer.Front Oncol. 2023 Jun 12;13:1108472. doi: 10.3389/fonc.2023.1108472. eCollection 2023. Front Oncol. 2023. PMID: 37377907 Free PMC article.
-
Comprehensive analyses of a CD8+ T cell infiltration related gene signature with regard to the prediction of prognosis and immunotherapy response in lung squamous cell carcinoma.BMC Bioinformatics. 2023 Jun 6;24(1):238. doi: 10.1186/s12859-023-05302-3. BMC Bioinformatics. 2023. PMID: 37280525 Free PMC article.
-
The Current Landscape of Immune Checkpoint Blockade in Metastatic Lung Squamous Cell Carcinoma.Molecules. 2021 Mar 5;26(5):1392. doi: 10.3390/molecules26051392. Molecules. 2021. PMID: 33807509 Free PMC article. Review.
-
Biomarkers of Immune Checkpoint Blockade Response in Triple-Negative Breast Cancer.Curr Treat Options Oncol. 2021 Mar 20;22(5):38. doi: 10.1007/s11864-021-00833-4. Curr Treat Options Oncol. 2021. PMID: 33743085 Review.
Cited by
-
Single-cell RNA sequencing of neurofibromas reveals a tumor microenvironment favorable for neural regeneration and immune suppression in a neurofibromatosis type 1 porcine model.Front Oncol. 2023 Sep 25;13:1253659. doi: 10.3389/fonc.2023.1253659. eCollection 2023. Front Oncol. 2023. PMID: 37817770 Free PMC article.
-
Investigating the correlation between IDO1/PD-L1 expression or co-expression and EGFR/KRAS gene mutations in advanced NSCLC.Sci Rep. 2025 Aug 7;15(1):28985. doi: 10.1038/s41598-025-14768-5. Sci Rep. 2025. PMID: 40775266 Free PMC article.
-
Methods for assessment of the tumour microenvironment and immune interactions in non-small cell lung cancer. A narrative review.Front Oncol. 2023 Apr 18;13:1129195. doi: 10.3389/fonc.2023.1129195. eCollection 2023. Front Oncol. 2023. PMID: 37143952 Free PMC article. Review.
-
Identification of cytokine-predominant immunosuppressive class and prognostic risk signatures in glioma.J Cancer Res Clin Oncol. 2023 Nov;149(14):13185-13200. doi: 10.1007/s00432-023-05173-4. Epub 2023 Jul 21. J Cancer Res Clin Oncol. 2023. PMID: 37479756 Free PMC article.
-
Integrative multi-omics analysis unveils the connection between transcriptomic characteristics associated with mitochondria and the tumor immune microenvironment in lower-grade gliomas.Sci Rep. 2024 Oct 10;14(1):23675. doi: 10.1038/s41598-024-74281-z. Sci Rep. 2024. PMID: 39390013 Free PMC article.
References
Publication types
MeSH terms
Substances
LinkOut - more resources
Full Text Sources
Medical
Research Materials
