. 2022 Sep;31(9):1778-1789.
doi: 10.1177/09622802221109523. Epub 2022 Jul 7.

Uncertainty quantification for epidemiological forecasts of COVID-19 through combinations of model predictions

Affiliations

Uncertainty quantification for epidemiological forecasts of COVID-19 through combinations of model predictions

Daniel S Silk et al. Stat Methods Med Res. 2022 Sep.

Abstract

Scientific advice to the UK government throughout the COVID-19 pandemic has been informed by ensembles of epidemiological models provided by members of the Scientific Pandemic Influenza group on Modelling. Among other applications, the model ensembles have been used to forecast daily incidence, deaths and hospitalizations. The models differ in approach (e.g. deterministic or agent-based) and in assumptions made about the disease and population. These differences capture genuine uncertainty in the understanding of disease dynamics and in the choice of simplifying assumptions underpinning the model. Although analyses of multi-model ensembles can be logistically challenging when time-frames are short, accounting for structural uncertainty can improve accuracy and reduce the risk of over-confidence in predictions. In this study, we compare the performance of various ensemble methods to combine short-term (14-day) COVID-19 forecasts within the context of the pandemic response. We address practical issues around the availability of model predictions and make some initial proposals to address the shortcomings of standard methods in this challenging situation.

Keywords: COVID-19; disease forecasting; model combination; model stacking; uncertainty quantification.


Conflict of interest statement

Declaration of conflicting interests: The author(s) declared no potential conflicts of interest with respect to the research, authorship, and/or publication of this article.

Figures

Figure 1.
Figure 1.
Sharpness, bias and calibration scores for the (left) individual and (right) ensemble forecasts, for all regions and value types delivered on (top) 30th June and (bottom) 7th July 2020. Note that multiple points are hidden when they coincide. The shading of the quadrants (from darker to lighter) implies a preference for over-prediction rather than under-prediction, and for prediction intervals that contain too many data points, rather than too few.
Figure 2.
Figure 2.
The best-performing individual model or ensemble method for each region/nation and value type (for forecasts delivered on the 23rd and 30th June, and 7th and 14th July 2020), evaluated using the absolute distance from the origin on the calibration-bias plots. Ties were broken using the sharpness score. For each date, only the overall best-performing model/ensemble is displayed, but for clarity, the results are separated into (left) individual models and (right) combinations. Region/nation and value type pairs for which there were less than two individual models with both training and forecast data available were excluded from the analysis.
Figure 3.
Figure 3.
Performance of individual models and ensemble methods for each region/nation and value type (for forecasts delivered on the 23rd and 30th June, and 7th and 14th July 2020). The height of each bar is calculated as the reciprocal of the weighted average interval score, so that higher bars correspond to better performance. Gaps in the results correspond to region/nation and value type pairs for which a model did not provide forecasts. No combined predictions were produced for Scotland hospital_prev on the 7th July as forecasts were only provided from a single model.
Figure 4.
Figure 4.
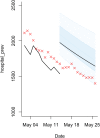
Quantile Regression Averaging (QRA) forecast for hospital bed occupancy in the North West region. A large discontinuity between the current and past forecasts (black line) of the individual model corresponding to the covariate with the largest regression coefficient can lead to increased bias for the QRA algorithm. The median, 50% and 90% QRA prediction intervals are shown in blue, while the data is shown in red. (Colour figure available online)
Figure 5.
Figure 5.
QRA (blue) and SQRA (green) forecasts for hospital bed occupancy in the North West region for a forecast window beginning on 14 May. SQRA corrects for the discontinuity between past and current forecasts for the individual model (black line) that corresponds to the covariate with the largest coefficient. Data is shown in red. (Colour figure available online)

References

    1. Semenov MA, Stratonovitch P. Use of multi-model ensembles from global climate models for assessment of climate change impacts. Clim Res 2010; 41: 1–14.
    1. Raftery AE, Madigan D, Hoeting JA. Bayesian model averaging for linear regression models. J Am Stat Assoc 1997; 92: 179–191.
    1. Madigan D, Raftery AE, Volinsky C, et al.. Bayesian model averaging. In Proceedings of the AAAI workshop on integrating multiple learned models, Portland, OR, pp. 77–83, 1996.
    1. Hoeting JA, Madigan D, Raftery AE, et al.. Bayesian model averaging: A tutorial. Stat Sci 1999; 382–401.
    1. Wallis KF. Combining density and interval forecasts: A modest proposal. Oxf Bull Econ Stat 2005; 67: 983–994.