. 2022 Oct;24(10):4869-4884.
doi: 10.1111/1462-2920.16122. Epub 2022 Jul 7.

Biogeographical variation in antimicrobial resistance in rivers is influenced by agriculture and is spread through bacteriophages

Affiliations

Biogeographical variation in antimicrobial resistance in rivers is influenced by agriculture and is spread through bacteriophages

Tilde Andersson et al. Environ Microbiol. 2022 Oct.

Abstract

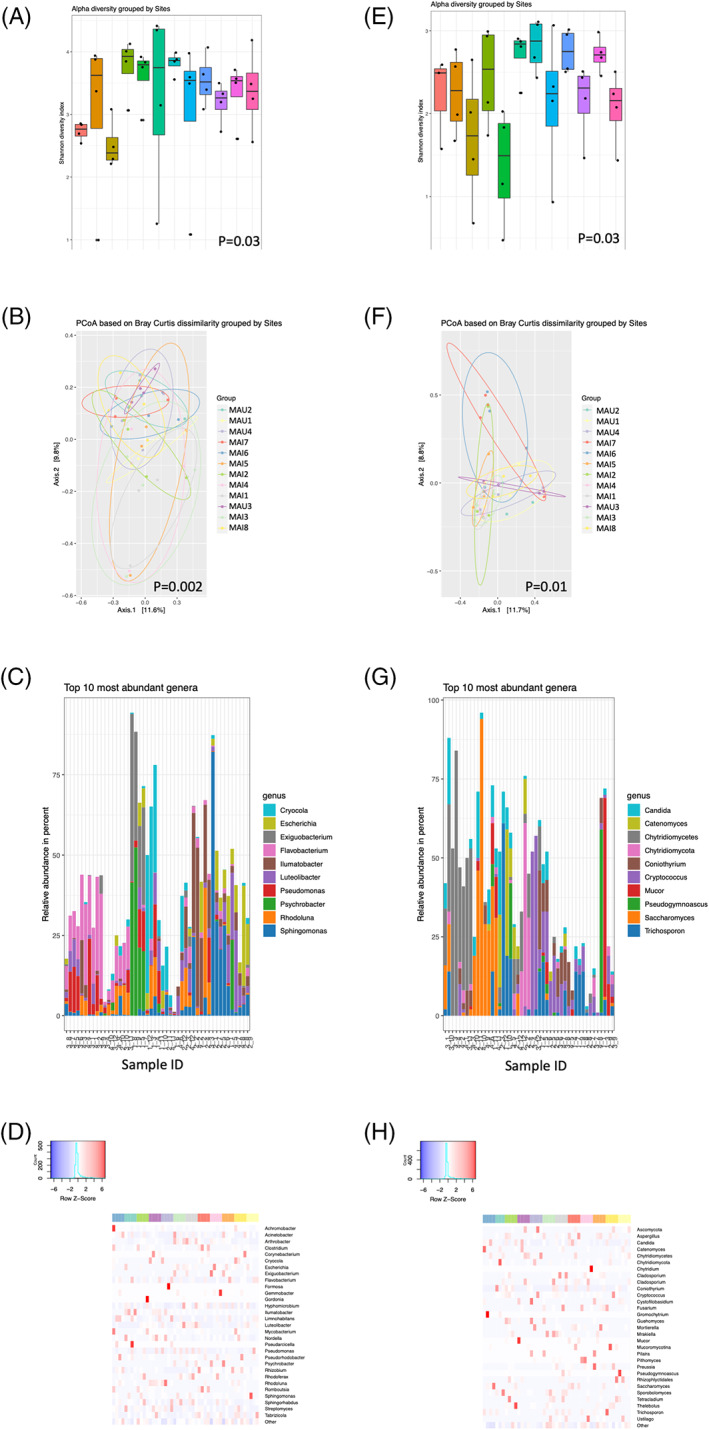
Antibiotic resistance is currently an extensive medical challenge worldwide, with global numbers increasing steadily. Recent data have highlighted wastewater treatment plants as a reservoir of resistance genes. The impact of these findings for human health can best be summarized using a One Health concept. However, the molecular mechanisms impacting resistance spread have not been carefully evaluated. Bacterial viruses, that is bacteriophages, have recently been shown to be important mediators of bacterial resistance genes in environmental milieus and are transferrable to human pathogens. Herein, we investigated the biogeographical impact on resistance spread through river-borne bacteriophages using amplicon deep sequencing of the microbiota, absolute quantification of resistance genes using ddPCR, and phage induction capacity within wastewater. Microbial biodiversity of the rivers is significantly affected by river site, surrounding milieu and time of sampling. Furthermore, areas of land associated with agriculture had a significantly higher ability to induce bacteriophages carrying antibiotic resistance genes, indicating their impact on resistance spread. It is imperative that we continue to analyse global antibiotic resistance problem from a One Health perspective to gain novel insights into mechanisms of resistance spread.


Conflict of interest statement

The authors declare no competing financial interests.

Figures

FIGURE 1
FIGURE 1
Geographical overview of isolated samples. Samples were isolated from river Maipo and Maule, crossing Chile in the Metropolitan, Valparaiso, and Maule region (A). Details regarding river Maipo and Maule are given in (B) and (C), respectively
FIGURE 2
FIGURE 2
Microbial diversity varies between rivers. Water collected from the two Chilean rivers Maipo (MAI) and Maule (MAU) was analysed in terms of prokaryotic alpha (Shannon's Diversity Index) (A) and beta (Bray–Curtis dissimilarity analysis) (B) diversity based on Illumina 16S/18S sequencing. The top 10 most common prokaryotic genera identified in 48 samples from river Maipo and river Maule as detected by heat map analysis (C) as well as presented as abundance of the prokaryotic flora (D). Eukaryotic alpha (Shannon's Diversity Index) (E) and beta (Bray–Curtis dissimilarity analysis) (F) diversity was similarly plotted, with prevalence in river Maipo and Maule (G) with a corresponding heat map (H). Sample IDs are labelled according to xy, where x is time point (e.g. 1–4) and y is location (e.g. MAI1‐8, MAU1‐4)
FIGURE 3
FIGURE 3
River site is a determinant for microbial diversity. Different river sites from both rivers (Maipo, n = 8; Maule, n = 4) were characterized for prokaryotic alpha (Shannon's Diversity Index) (A) and beta (Bray–Curtis dissimilarity analysis) (B) diversity. The top 10 most common prokaryotic genera as detected by heat map analysis (C) as well as presented as abundance of the prokaryotic flora (D). Similarly, eukaryotic alpha (Shannon's Diversity Index) (E) and beta (Bray–Curtis dissimilarity analysis) (F) diversity as well as prevalence in the river sites (G) were plotted with a corresponding heat map (H). Sample IDs are labelled according to xy, where x is time point (e.g. 1–4) and y is location (e.g. MAI1‐8, MAU1‐4)
FIGURE 4
FIGURE 4
Temporal changes affect microbial biodiversity in rivers. River samples were collected during different time points, and prokaryotic and eukaryotic diversity changes monitored through changes in the 16S and 18S rRNA composition. Alpha diversity (Shannon's Diversity Index) for prokaryotes (A) and eukaryotes (E), beta diversity (Bray–Curtis dissimilarity analysis) for prokaryotes (B) and eukaryotes (F), the top 10 most commonly identified prokaryotes (C) and eukaryotes (G) during the different collection time points based on heat map analysis were plotted and summarized in a heat map representing the abundance for prokaryotes (D) and eukaryotes (H). Note that the prevalence plot and heat map is identical to Figure 2(C,D) and Figure 2(G,H), but the analysis differs. Sample IDs are labelled according to xy, where x is time point (e.g. 1–4) and y is location (e.g. MAI1‐8, MAU1‐4)
FIGURE 5
FIGURE 5
Seasonal and regional variation in phage induction in the rivers Maule and Maipo. Water collected from different river sites was added to an E. coli reporter system for bacteriophage induction (e.g. recA activation, SOS response) and induction measured as GFP levels, both for river Maule and Maipo (A). Induction was analysed based on regional variation according to agricultural areas (Agr.), city (City) or environment (Env.) for both rivers combined (B), river Maule (C) and river Maipo (D). Data were analysed by ANOVA followed by Tukey's test post hoc. *p < 0.05 and **p < 0.01, versus City. #p < 0.05 versus environmental locations. + denotes two sample sets from a similar distance (e.g. pre and post WWTP). The solid line shows the average phage induction and the grey shaded area the 95% confidence interval
FIGURE 6
FIGURE 6
Antibiotic resistance genes are prevalent in bacterial and phage populations. River Maipo and Maule are illustrated with open and closed circles, respectively. (A) and (B), bacteria; (C) and (D) phage. X‐axis denotes number of gene copies in sample
FIGURE 7
FIGURE 7
Presence of resistance genes in phages and bacteria. Presence (+) or absence (−) of phage resistance genes tetA and tetM in relation to (A) corresponding bacterial resistance genes, and (B) phage resistance gene tetM. Presence (+) or absence (−) of bacterial resistance gene tetA in relation to (C) bacterial resistance gene tetM. (D) Presence (+) or absence (−) of bacterial resistance genes tetA and tetM in relation to corresponding phage resistance genes. Presence of resistance gene TetA in bacteria and phages stratified on agricultural or urban setting in (E) all river systems, and in (F) the Maipo river. (G) Presence of resistance genes in bacteria and phages stratified on time‐point of collection. (H) Assessment of phage‐inducing ability stratified on presence of resistance gene tetM in phages. Statistical analyses were done using Mann–Whitney U test with bars representing the median value. X‐axis denotes number of gene copies in sample

References

    1. Anand, T. , Bera, B.C. , Vaid, R.K. , Barua, S. , Riyesh, T. , Virmani, N. et al. (2016) Abundance of antibiotic resistance genes in environmental bacteriophages. Journal of General Virology, 97, 3458–3466. - PubMed
    1. Balcazar, J.L. (2014) Bacteriophages as vehicles for antibiotic resistance genes in the environment. PLoS Pathogens, 10, e1004219. - PMC - PubMed
    1. Bambic, D., McBride, G., Miller, W., Stott, R. & Wuertz, S. (2011) Quantification of pathogens and sources of microbial indicators for QMRA in recreational waters. In: Water intelligence online, Vol. 10. London, UK: IWA Publishing.
    1. Bortolaia, V. , Kaas, R.S. , Ruppe, E. , Roberts, M.C. , Schwarz, S. , Cattoir, V. et al. (2020) ResFinder 4.0 for predictions of phenotypes from genotypes. Journal of Antimicrobial Chemotherapy, 75, 3491–3500. - PMC - PubMed
    1. Bouki, C. , Venieri, D. & Diamadopoulos, E. (2013) Detection and fate of antibiotic resistant bacteria in wastewater treatment plants: a review. Ecotoxicology and Environmental Safety, 91, 1–9. - PubMed

Publication types