. 2022 Jun 28:2022:1146186.
doi: 10.1155/2022/1146186. eCollection 2022.

Downregulation of PTCD1 in Bladder Urothelial Carcinoma Predicts Poor Prognosis and Levels of Immune Infiltration

Affiliations

Downregulation of PTCD1 in Bladder Urothelial Carcinoma Predicts Poor Prognosis and Levels of Immune Infiltration

Zhongbao Zhou et al. J Oncol. .

Abstract

Pentatricopeptide repeat domain 1 (PTCD1) was reported to regulate mitochondrial metabolism and oxidative phosphorylation. However, the effect and mechanism of PTCD1 in the development of bladder urothelial carcinoma (BLCA) remain unclear. The databases from The Cancer Genome Atlas (TCGA) and Human Protein Atlas (HPA) were used to analyze the expression changes, clinical features, and prognostic values of PTCD1. A nomogram was built to predict the prognostic outcomes of BLCA cases. The potential genes interacting with PTCD1 were explored by Weighted Gene Coexpression Network Analysis (WGCNA). The estimation of associations between PTCD1 and tumor mutations, tumor immunities, and m6A methylations was performed. The study found that the gradual decrease of PTCD1 expression was observed with the increase of stage and grade. Low PTCD1 expression was greatly correlated with higher pathological stage, N stage, and poor prognosis in TCGA cohorts; interestingly, low-grade BLCA cases all exhibited high expression of PTCD1. HPA database analysis implied that the expression of PTCD1 protein in BLCA was lower than that in normal bladder tissue, and the protein expression of PTCD1 in high-grade BLCA was lower than that in low-grade BLCA. Multivariate Cox regression analysis indicated that PTCD1 may serve as an independent factor influencing prognosis of BLCA. Mechanistically, PTCD1 played a regulatory role in BLCA progression through multiple tumor-related pathways containing PI3K-Akt signaling, ECM-receptor interaction, oxidative phosphorylation, and extracellular matrix organization. WGCNA reported that PTCD1 had a strong positive correlation with POLR2J, ZNHT1, ATP5MF, PDAP1, BUD31, and COPS6. Besides, the mRNA expression of PTCD1 was negatively associated with immune cells' infiltrations, immune functions, and checkpoints, especially with some m6A methylation regulators in BLCA. In sum, downregulation of PTCD1 expression may be involved in the development of BLCA and remarkably correlated with poor prognosis. Meantime, it showed an influence in immune cell infiltration and may serve as an agreeable prognostic indicator in BLCA.


Conflict of interest statement

The authors have no conflicts of interest to declare regarding the publication of this paper.

Figures
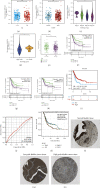
Figure 1
Figure 1
The PTCD1 expression level and survival analysis in BLCA. (a) The PTCD1 expressions of patients with BLCA according to different clinical characteristics including age (a), gender (b), stage (c), and grade (d). The PTCD1 expression (e), OS (f), PFS (g), and DFS (h) of stages I-II versus stages III-IV in the TCGA-BLCA dataset. The K-M curve between low-PTCD1 group and high-PTCD1 group in the TCGA database (i) and AUC curve related to OS (j). The survival curve based on the median expression of PTCD1 as the threshold in ENCORI database (k). Protein expression of PTCD1 in normal bladder tissue (l), low-grade (m) and high-grade (n) bladder cancer. P < 0.05; ∗∗P < 0.01; and ∗∗∗P < 0.001.
Figure 2
Figure 2
The Sankey diagram showed the connection between TNM stage, PTCD1 expression, and survival status, which showed that patients with high expression of PTCD1 tended to survive more.
Figure 3
Figure 3
(a) Univariate Cox regression analysis; (b) multivariate Cox regression analysis; (c) nomogram for predicting probability of patients with 1-, 3-, and 5-year OS; and (d) actual and predicted survivals by the calibration curves.
Figure 4
Figure 4
(a, b) Enriched biological process (BP), cellular component (CC), and molecular function (MF) of the DEGs. (c, d) Enriched Kyoto Encyclopedia of Genes and Genomes (KEGG) pathways of the DEGs.
Figure 5
Figure 5
Identification of the module related with PTCD1 in DEGs dataset. (a) Clustering dendrograms of samples as well as traits; (b) the left panel shows the scale-free fitting indices for various soft-thresholding powers (β); (c) cluster dendrogram of coexpression network modules based on the 1-TOM matrix; (d) the gene interaction network of all modules; (e) heatmap of the correlation between module eigengenes and traits of BLCA; and (f) correlation heatmap between each module. Each module represents a cluster of corelated genes and was assigned a unique color.
Figure 6
Figure 6
(a) Coexpression network of PTCD1 in the turquoise module. (b) Dot heatmap of gene correlation in coexpression network. (c) The bar chart showed the number of connecting nodes of target mRNAs in network. The association of PTCD1 with top six core genes including POLR2J (d), ZNHT1 (e), ATP5MF (f), PDAP1(g), BUD31 (h), and COPS6 (i).
Figure 7
Figure 7
Mutation feature of PTCD1 in BLCA. The alteration frequency with mutation type and mutation site of PTCD1 (a). Distribution of frequently mutated genes in Patients with PTCD1 mutation. The upper bar plot shows the tumor mutation burden (TMB) for each patient, whereas the left bar plot indicates the gene mutation frequency in different groups (a). The top 10 BLCA-correlated mutation genes in patients with PTCD1 mutation and the mutation frequency, variant classification, variant type, and SNV class of the mutated genes in high- and low-PTCD1 subgroups (b).
Figure 8
Figure 8
The immune infiltration (a), immune function (b), and immune checkpoint (c) of the high- and low-PTCD1 group for BLCA patients in the TCGA cohorts. P < 0.05; ∗∗P < 0.01; and ∗∗∗P < 0.001.
Figure 9
Figure 9
The m6A-related genes of the high- and low-PTCD1 group for BLCA patients in the TCGA cohorts. P < 0.05; ∗∗P < 0.01; and ∗∗∗P < 0.001.

References

    1. Antoni S., Ferlay J., Soerjomataram I., Znaor A., Jemal A., Bray F. Bladder cancer incidence and mortality: a global overview and recent trends. European Urology . 2017;71(1):96–108. doi: 10.1016/j.eururo.2016.06.010. - DOI - PubMed
    1. Lopez-Beltran A., Cimadamore A., Blanca A., et al. Immune checkpoint inhibitors for the treatment of bladder cancer. Cancers . 2021;13(1):p. 131. doi: 10.3390/cancers13010131. - DOI - PMC - PubMed
    1. Lenis A. T., Lec P. M., Chamie K., Mshs M. D. Bladder cancer: a review. JAMA . 2020;324(19):p. 1980. doi: 10.1001/jama.2020.17598. - DOI - PubMed
    1. Kaseb H., Aeddula N. R. Bladder Cancer. StatPearls. Treasure Island (FL) St. Petersburg, FL, USA: StatPearls Publishing LLC; 2022.
    1. Bhanvadia S. K. Bladder cancer survivorship. Current Urology Reports . 2018;19(12):p. 111. doi: 10.1007/s11934-018-0860-6. - DOI - PubMed

LinkOut - more resources