

Tuberculosis Among Native Hawaiian and Other Pacific Islander Persons: United States and U.S.-Affiliated Pacific Islands, 2010-2019
- PMID: 35801148
- PMCID: PMC9257550
- DOI: 10.1089/heq.2022.0065
Tuberculosis Among Native Hawaiian and Other Pacific Islander Persons: United States and U.S.-Affiliated Pacific Islands, 2010-2019
Abstract
Background: In recent years, tuberculosis (TB) incidence in the United States has declined overall but remained high among Native Hawaiian and Other Pacific Islander (NH/PI) persons. Few studies have examined the epidemiology of TB among NH/PI persons, particularly in the U.S.-Affiliated Pacific Islands (USAPI). We describe TB incidence and characteristics of NH/PI patients during 2010-2019.
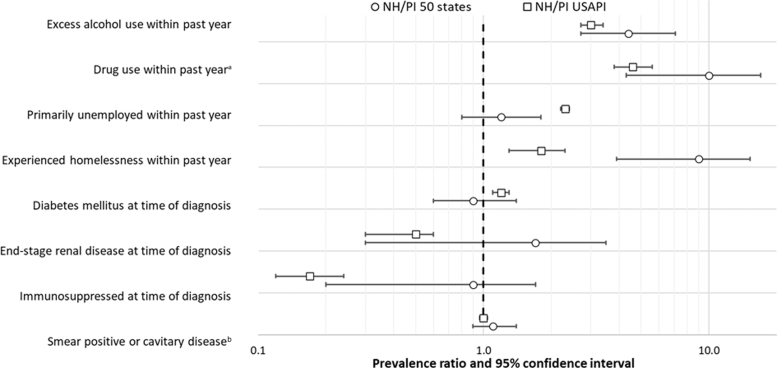
Methods: We used data from the National Tuberculosis Surveillance System to characterize TB cases reported among NH/PI persons born in the 50 U.S. states (defined to include District of Columbia) and the USAPI. We calculated annual TB incidence among NH/PI patients, stratified by place of birth (U.S. states or USAPI). Using Asian persons born outside the United States-persons historically grouped with NH/PI persons as one racial category-as the reference, we compared demographic, clinical, and socio-behavioral characteristics of NH/PI TB patients.
Results: During 2010-2019, 4359 TB cases were reported among NH/PI patients born in the U.S. states (n=205) or the USAPI (n=4154). Median annual incidence per 100,000 persons was 6.5 cases (persons born in the U.S. states) and 150.7 cases (persons born in the USAPI). The proportion of TB patients aged <15 years was higher among NH/PI persons (U.S. states: 54%, USAPI: 24%) than among Asian persons born outside the United States (1%).
Conclusions: TB incidence among NH/PI persons is high, particularly among persons born in the USAPI, emphasizing the need to enhance TB prevention strategies in these communities. Interventions should be tailored toward those who experience the highest risk, including NH/PI children and adolescents.
Keywords: U.S.-Affiliated Pacific Islands; tuberculosis.
© Molly Deutsch-Feldman et al., 2022; Published by Mary Ann Liebert, Inc.
Conflict of interest statement
No competing financial interests exist.
Figures


Similar articles
-
Tuberculosis - United States, 2022.MMWR Morb Mortal Wkly Rep. 2023 Mar 24;72(12):297-303. doi: 10.15585/mmwr.mm7212a1. MMWR Morb Mortal Wkly Rep. 2023. PMID: 36952282 Free PMC article.
-
Cervical Cancer Incidence in the US-Affiliated Pacific Islands.JAMA Oncol. 2024 Nov 1;10(11):1561-1564. doi: 10.1001/jamaoncol.2024.3675. JAMA Oncol. 2024. PMID: 39264606
-
Molecular epidemiology of Mycobacterium tuberculosis in the United States-Affiliated Pacific Islands.Asia Pac J Public Health. 2014 Jan;26(1):77-84. doi: 10.1177/1010539512469249. Epub 2012 Dec 13. Asia Pac J Public Health. 2014. PMID: 23239749 Free PMC article.
-
Best Practices for Community-Engaged Research with Pacific Islander Communities in the US and USAPI: A Scoping Review.J Health Care Poor Underserved. 2019;30(4):1302-1330. doi: 10.1353/hpu.2019.0101. J Health Care Poor Underserved. 2019. PMID: 31680100 Free PMC article.
-
Chronic disease surveillance systems within the US Associated Pacific Island jurisdictions.Prev Chronic Dis. 2011 Jul;8(4):A86. Epub 2011 Jun 15. Prev Chronic Dis. 2011. PMID: 21672410 Free PMC article. Review.
Cited by
-
Editorial: Community Engagement Is Key to Promoting Asian American, Native Hawaiian, and Pacific Islander Health.Health Equity. 2022 Sep 1;6(1):681-683. doi: 10.1089/heq.2022.0124. eCollection 2022. Health Equity. 2022. PMID: 36225667 Free PMC article. No abstract available.
-
A Literature Review on the Adherence to Screening Guidelines for Latent Tuberculosis Infection Among Persons Living With HIV.Hawaii J Health Soc Welf. 2023 Dec;82(12):289-295. Hawaii J Health Soc Welf. 2023. PMID: 38093759 Free PMC article. Review.
References
-
- Centers for Disease Control and Prevention. Reported Tuberculosis in the United States. 2020. Available at https://www.cdc.gov/tb/statistics/reports/2020/default.htm Accessed March 21, 2022.
-
- Centers for Disease Control and Prevention. Table 11B. Chlamydia—Rates of Reported Cases* by Race/Hispanic Ethnicity, Age Group, and Sex, United States. 2019. Available at https://www.cdc.gov/std/statistics/2019/tables/11b.htm Accessed March 21, 2022.
-
- Centers for Disease Control and Prevention. Table 22B. Gonorrhea—Rates of Reported Cases* by Race/Hispanic Ethnicity, Age Group, and Sex, United States. 2019. Available at https://www.cdc.gov/std/statistics/2019/tables/22b.htm Accessed March 21, 2022.
-
- Palafox N, Kaanoi M. Health Disparities Among Pacific Islanders. Available at https://www.minorityhealth.hhs.gov/assets/pdf/checked/Health%20Dispariti... Accessed March 3, 2021.
LinkOut - more resources
Full Text Sources
Research Materials
Miscellaneous