. 2022 Aug;21(8):e13663.
doi: 10.1111/acel.13663. Epub 2022 Jul 7.

A partial reduction of VDAC1 enhances mitophagy, autophagy, synaptic activities in a transgenic Tau mouse model

Affiliations

A partial reduction of VDAC1 enhances mitophagy, autophagy, synaptic activities in a transgenic Tau mouse model

Murali Vijayan et al. Aging Cell. 2022 Aug.

Abstract

Alzheimer's disease (AD) is the most common cause of mental dementia in the aged population. AD is characterized by the progressive decline of memory and multiple cognitive functions, and changes in behavior and personality. Recent research has revealed age-dependent increased levels of VDAC1 in postmortem AD brains and cerebral cortices of APP, APPxPS1, and 3xAD.Tg mice. Further, we found abnormal interaction between VDAC1 and P-Tau in the AD brains, leading to mitochondrial structural and functional defects. Our current study aimed to understand the impact of a partial reduction of voltage-dependent anion channel 1 (VDAC1) protein on mitophagy/autophagy, mitochondrial and synaptic activities, and behavior changes in transgenic TAU mice in Alzheimer's disease. To determine if a partial reduction of VDAC1 reduces mitochondrial and synaptic toxicities in transgenic Tau (P301L) mice, we crossed heterozygote VDAC1 knockout (VDAC1+/- ) mice with TAU mice and generated double mutant (VDAC1+/- /TAU) mice. We assessed phenotypic behavior, protein levels of mitophagy, autophagy, synaptic, other key proteins, mitochondrial morphology, and dendritic spines in TAU mice relative to double mutant mice. Partial reduction of VDAC1 rescued the TAU-induced behavioral impairments such as motor coordination and exploratory behavioral changes, and learning and spatial memory impairments in VDAC1+/- /TAU mice. Protein levels of mitophagy, autophagy, and synaptic proteins were significantly increased in double mutant mice compared with TAU mice. In addition, dendritic spines were significantly increased; the mitochondrial number was significantly reduced, and mitochondrial length was increased in double mutant mice. Based on these observations, we conclude that reduced VDAC1 is beneficial in symptomatic-transgenic TAU mice.

Keywords: Alzheimer's disease; autophagy; hexokinases; mitochondria; mitochondrial biogenesis; mitophagy; oxidative stress; voltage-dependent anion channel 1.


Conflict of interest statement

The authors declare no conflict of interest.

Figures

FIGURE 1
FIGURE 1
Rotarod and open field, behavioral assessment of 6‐month‐old WT, VDAC1+/−, TAU, and VDAC1+/−/TAU mice. Rotarod test: (a) latency to fall of various cohorts, namely WT, VDAC1+/−, TAU, and VDAC1+/−/TAU mice as assessed by the rotarod test. VDAC1+/−/TAU mice improve motor learning and coordination. (b) TAU mice spent less time on the rod (lower latency to fall), indicating impaired motor learning and coordination compared to the WT mice (****p < 0.0001). Open field test: TAU mice exhibited reduced locomotor and exploratory activity than VDAC1+/−/TAU mice (*p < 0.05), as evidenced by reduced total distance traveled and average speed. (c) Quantification of total distance traveled, (d) average speed, (e) the number of center entries, and (f) time spent in the center area by all indicated cohorts assessed by open field test. (g) Shows representative trajectory maps (time spent in the center) of all mentioned cohorts as analyzed by an open field test. N = 10 per group. Bars represent mean ± SEM. ns, not significant, *p <  0.05, **p  < 0.01, ***p  <  0.001, ****p < 0.0001, one‐way ANOVA followed by Turkey's test for multiple comparisons
FIGURE 2
FIGURE 2
Y‐maze and Morris water maze, behavioral assessment of 6‐month‐old WT, VDAC1+/−, TAU, and VDAC1+/−/TAU mice. Y‐maze test: (a) Y‐maze test shows TAU mice display significantly more total arm entries than VDAC1+/−/TAU mice (***p < 0.001). (b) Spatial memory assessment using the Y‐maze spontaneous alternation test. TAU mice showed significantly reduced percentages of spontaneous alternation (**p < 0.01 vs. WT mice). VDAC1+/−/TAU mice significantly increased the percentage of spontaneous alternation compared with the TAU mice (**p < 0.01). (c) Representative tracks of mice (total number of entries) in the Y‐maze test. Morris water maze test: (d) the average time to find a platform was significantly decreased in VDAC1+/−/TAU mice compared to TAU mice (****p < 0.0001). At the same time, (e) distance traveled (****p < 0.0001), and (f) average speed (****p < 0.0001), (g) the number of entries in the NW quadrant (****p < 0.0001) were significantly increased in VDAC1+/−/TAU mice compared to TAU mice. (h) Representative swimming tracks of mice (time to find the platform) in Morris water maze test. N = 10 per group. Bars represent mean ± SEM. ns, not significant, *p < 0.05, **p < 0.01, ***p < 0.001, ****p < 0.0001, one‐way ANOVA followed by Turkey's test for multiple comparisons
FIGURE 3
FIGURE 3
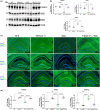
Western Blot, Immunofluorescence and quantification analysis of proteins regulating mitophagy proteins in 6‐month‐old WT, VDAC1+/−, TAU, and VDAC1+/−/TAU mice. (a) Representative immunoblots. (b) Quantitative densitometry analysis of mitophagy proteins PARKIN (****p < 0.0001), PINK1 (**p < 0.01) were significantly increased, and BNIP3L (**p < 0.01) was significantly decreased in VDAC1+/−/TAU mice compared to TAU mice. Each lane was loaded with 40 μg of total protein. Housing‐keeping protein beta‐actin was used as the loading control. Data are from three independent experiments with similar results (N = 3). (c) Representative immunofluorescence images of 10‐micron coronal sections (10×). (d) Fluorescence intensity analysis of mitophagy proteins PARKIN (****p < 0.0001), PINK1 (****p < 0.0001) were significantly increased and BNIP3L (***p < 0.001) was significantly decreased in VDAC1+/−/TAU mice compared to TAU mice. Data are from three independent experiments with similar results (N = 3) with 10–15 fields per mouse. Scale bar: 500 μm. Results were expressed as mean ± SEM. ns, not significant, *p < 0.05, **p < 0.01, ***p < 0.001, ****p < 0.0001, one‐way ANOVA followed by Turkey's test for multiple comparisons
FIGURE 4
FIGURE 4
Western Blot, Immunofluorescence and quantification analysis of proteins regulating autophagy proteins in 6‐month‐old WT, VDAC1+/−, TAU, and VDAC1+/−/TAU mice. (a) Representative immunoblots. (b) Quantitative densitometry analysis of autophagy proteins‐LC3B‐I (**p < 0.01), ATG5 (**p < 0.01), Beclin1 (*p < 0.051), P62 (**p < 0.01) were significantly increased in VDAC1+/− TAU mice compared to TAU mice. Each lane was loaded with 40 μg of total protein. Housing‐keeping protein beta‐actin was used as the loading control. Data are from three independent experiments with similar results (N = 3). (c) Representative immunofluorescence images of 10‐micron coronal sections (10×). (d) Fluorescence intensity analysis of autophagy proteins LC3B (****p < 0.0001), ATG5 (***p < 0.001), Beclin1 (****p < 0.0001), P62 (****p < 0.0001) were significantly increased in VDAC1+/−/TAU mice compared to TAU mice. Data are from three independent experiments with similar results (N = 3) with 10–15 fields per mouse. Scale bar: 500 μm. Results were expressed as mean ± SEM. ns, not significant, *p < 0.05, **p < 0.01, ***p < 0.001, ****p < 0.0001, one‐way ANOVA followed by Turkey's test for multiple comparisons
FIGURE 5
FIGURE 5
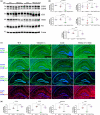
Western Blot and quantification analysis of proteins regulating synaptic proteins in 6‐month‐old WT, VDAC1+/−, TAU, and VDAC1+/−/TAU mice. (a) Representative immunoblots. (b) Quantitative densitometry analysis of synaptic proteins PSD95 (***p < 0.001), synaptophysin (**p < 0.01), SNAP25 (***p < 0.001) were significantly increased in VDAC1+/−/TAU mice compared to TAU mice. Each lane was loaded with 40 μg of total protein. Housing‐keeping protein beta‐actin was used as the loading control. Data are from three independent experiments with similar results (N = 3). (c) Representative immunofluorescence images of 10‐micron coronal sections (10×). (d) Fluorescence intensity analysis of synaptic proteins PSD95 (****p < 0.0001), synaptophysin (****p < 0.0001), SNAP25 (****p < 0.0001) were significantly increased in VDAC1+/−/TAU mice compared to TAU mice. Data are from three independent experiments with similar results (N = 3) with 10–15 fields per mouse. Scale bar: 500 μm. Results were expressed as mean ± SEM. ns, not significant, *p < 0.05, **p < 0.01, ***p < 0.001, ****p < 0.0001, one‐way ANOVA followed by Turkey's test for multiple comparisons. [Correction added on 11 July 2022, after first online publication: the layers for the beta actin panel in Figure (5a) was placed incorrectly and it has been corrected in this version.]
FIGURE 6
FIGURE 6
Western Blot, Immunofluorescence and quantification analysis of other key proteins (Total TAU, P‐TAU, VDAC1, HK1, HK2, AKT, GSK3B) in the hippocampal fields of 6‐month‐old WT, VDAC1+/−, TAU, and VDAC1+/−/TAU mice. (a, c, e) Representative immunoblots. (b, d, f) Quantitative densitometry analysis of HK1 (**p < 0.01), HK2 (*p < 0.05), AKT (**p < 0.01) were significantly increased, and GSK3A (****p < 0.0001), GSK3B (****p < 0.0001), ANT1 (****p < 0.0001), pS422 (****p < 0.0001), VDAC1 (****p < 0.0001) were significantly decreased in VDAC1+/−/TAU mice compared to TAU mice. Each lane was loaded with 40 μg of total protein. Housing‐keeping protein beta‐actin was used as the loading control. Data are from three independent experiments with similar results (N = 3). (c) Representative immunofluorescence images of 10‐micron coronal sections (10×). (d) Fluorescence intensity analysis of total TAU (****p < 0.0001), P‐TAU (****p < 0.0001), VDAC1 (***p < 0.001), GSK3B (***p < 0.001) were significantly decreased, HK1 (****p < 0.0001), HK2 (****p < 0.0001), AKT (****p < 0.0001) were significantly increased in VDAC1+/−/TAU mice compared to TAU mice. Data are from three independent experiments with similar results (N = 3) with 10–15 fields per mouse. Scale bar: 500 μm. Results were expressed as mean ± SEM. ns, not significant, *p < 0.05, **p < 0.01, ***p < 0.001, ****p < 0.0001, one‐way ANOVA followed by Turkey's test for multiple comparisons
FIGURE 7
FIGURE 7
Transmission electron microscopy (TEM) analysis of the hippocampus and cerebral cortex region in 6‐month‐old WT, VDAC1+/−, TAU, and VDAC1+/−/TAU mice. (a) Representative electron micrographs of mitochondria in the hippocampus and cerebral cortex of all indicated cohorts. (b) Mitochondrial number in the hippocampus. (c) Represents the mitochondrial length in the hippocampus. (d) Represents the mitochondrial number in the cerebral cortex. (e) Represents the mitochondrial length in the cerebral cortex. Significantly decreased number of mitochondria in hippocampi (****p < 0.0001) and cortex (****p < 0.0001) of VDAC1+/−/TAU mice relative to TAU mice, the mitochondrial length is significantly increased in hippocampal (****p < 0.0001) and cerebral cortical tissues (****p < 0.0001) in VDAC1+/−/TAU mice. (f) Synaptic densities are sharply defined and contain electron‐dense materials uniformly distributed in all indicated cohorts of the hippocampus and cerebral cortex. The arrowheads show the bowl‐shaped structure of synapses and synaptic mitochondria with normal structure. Magnification ×22,000. (g) Synapse number in the hippocampus. (h) Synapse number in the cerebral cortex. The synapse numbers were found to be significantly increased in the hippocampi (****p < 0.0001) and cerebral cortical tissues (****p < 0.0001) of VDAC1+/−/TAU mice relative to TAU mice. N = 5 per group. Results were expressed as mean ± SEM. ns, not significant, *p < 0.05, **p < 0.01, ***p < 0.001, ****p < 0.0001, one‐way ANOVA followed by Turkey's test for multiple comparisons (scale bar = 600 nm)
FIGURE 8
FIGURE 8
Microphotography of Golgi‐Cox impregnated brain slice of 6‐month‐old WT, VDAC1+/−, TAU, and VDAC1+/−/TAU mice. (a) Golgi‐Cox impregnated image of the whole mouse brain. (b, c) Images of the hippocampus (4× and 10×) are well stained. (d) Magnified images of the hippocampus‐ Dendritic spines can also be visualized at higher magnification (100×). (e, f) The cerebral cortex (10× and 20×) is well stained. (g) Magnified images of the cerebral cortex‐ Dendritic spines can also be visualized at higher magnification (100×). (h) The number of dendritic spines in the hippocampus. (i) Dendritic length in the hippocampus. Significantly increased dendritic number (****p < 0.0001) and the length of dendritic spines (****p < 0.0001) in VDAC1+/−/TAU mice relative to TAU mice. N = 5 per group. Results were expressed as mean ± SEM. ns, not significant, *p < 0.05, **p < 0.01, ***p < 0.001, ****p < 0.0001, one‐way ANOVA followed by Turkey's test for multiple comparisons. Scale bars 1000 μm in (a, b & e), 400 μm in (c), 200 μm in (f) and 1 μm, 2 μm, 5 μm, 10 μm in (d & g)

Similar articles

Cited by

References

    1. Abu‐Hamad, S. , Zaid, H. , Israelson, A. , Nahon, E. , & Shoshan‐Barmatz, V. (2008). Hexokinase‐I protection against apoptotic cell death is mediated via interaction with the voltage‐dependent anion channel‐1: Mapping the site of binding. The Journal of Biological Chemistry, 283(19), 13482–13490. 10.1074/jbc.M708216200 - DOI - PubMed
    1. Ashrafi, G. , & Schwarz, T. L. (2013). The pathways of mitophagy for quality control and clearance of mitochondria. Cell Death and Differentiation, 20(1), 31–42. 10.1038/cdd.2012.81 - DOI - PMC - PubMed
    1. Azoulay‐Zohar, H. , Israelson, A. , Abu‐Hamad, S. , & Shoshan‐Barmatz, V. (2004). In self‐defence: Hexokinase promotes voltage‐dependent anion channel closure and prevents mitochondria‐mediated apoptotic cell death. The Biochemical Journal, 377(Pt 2), 347–355. 10.1042/BJ20031465 - DOI - PMC - PubMed
    1. Brandt, R. , Hundelt, M. , & Shahani, N. (2005). Tau alteration and neuronal degeneration in tauopathies: Mechanisms and models. Biochimica et Biophysica Acta, 1739(2–3), 331–354. 10.1016/j.bbadis.2004.06.018 - DOI - PubMed
    1. Cai, Q. , & Jeong, Y. Y. (2020). Mitophagy in Alzheimer's disease and other age‐related neurodegenerative diseases. Cells, 9(1), 150. 10.3390/cells9010150 - DOI - PMC - PubMed

Publication types