Reactive oxygen species activated by mitochondria-specific camptothecin prodrug for enhanced chemotherapy
- PMID: 35801419
- PMCID: PMC9589304
- DOI: 10.17305/bjbms.2022.7194
Reactive oxygen species activated by mitochondria-specific camptothecin prodrug for enhanced chemotherapy
Abstract
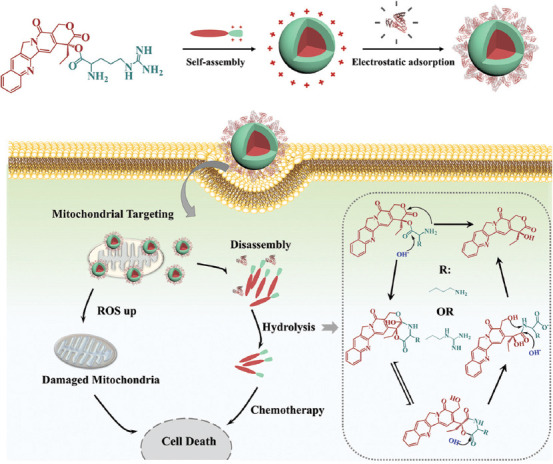
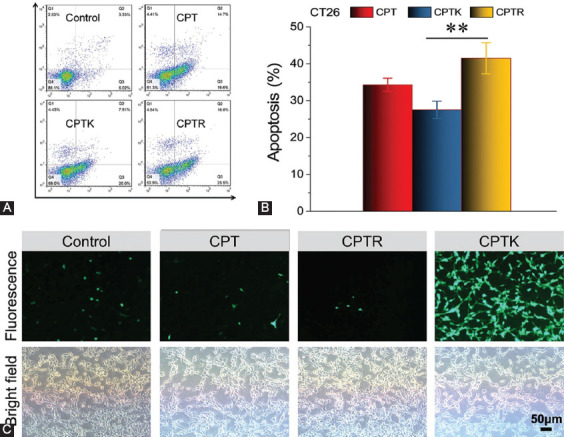
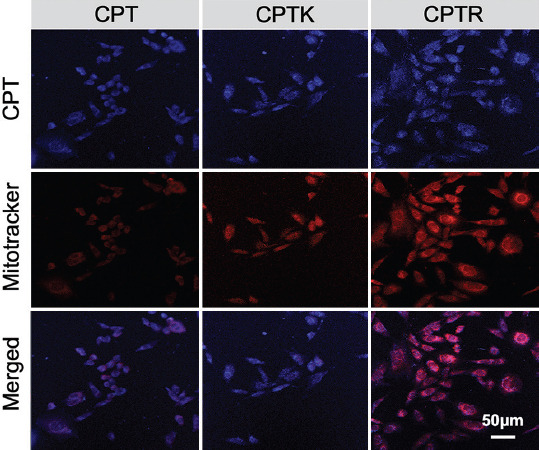
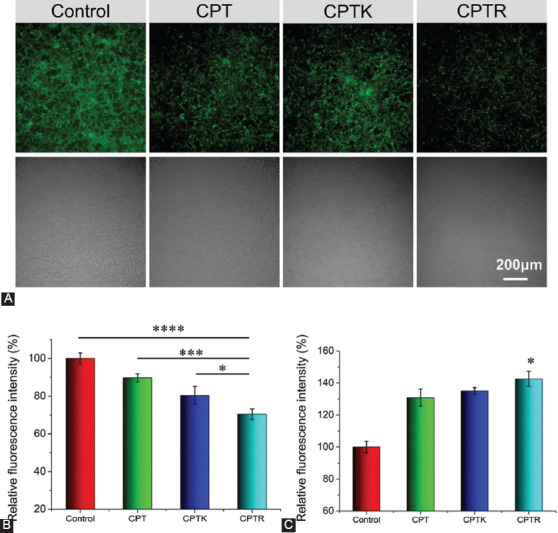
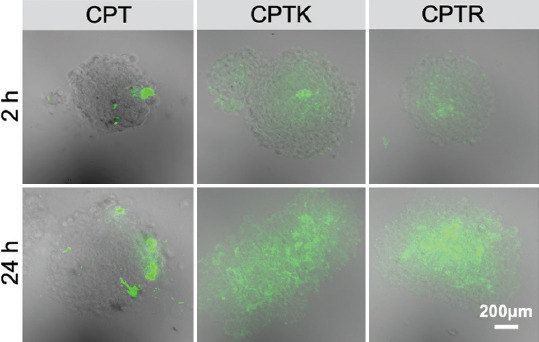
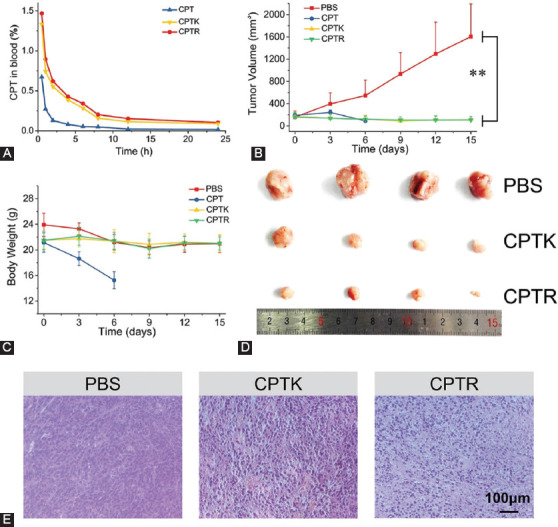
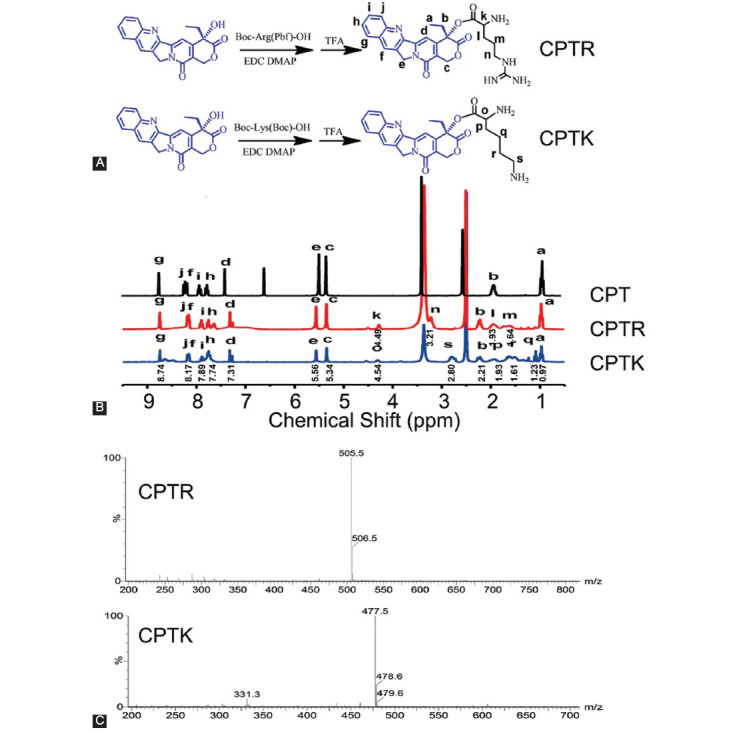
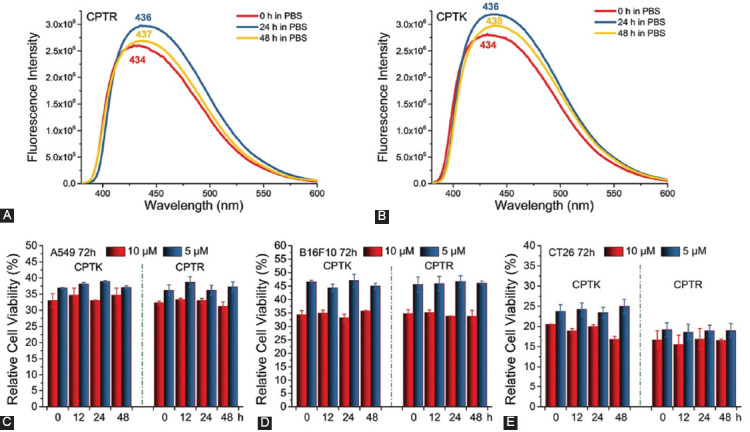
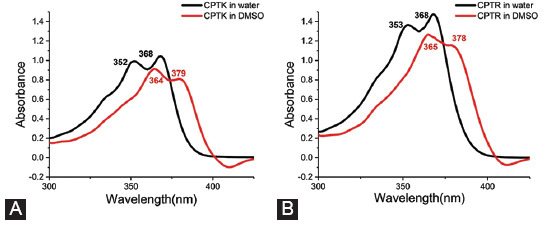
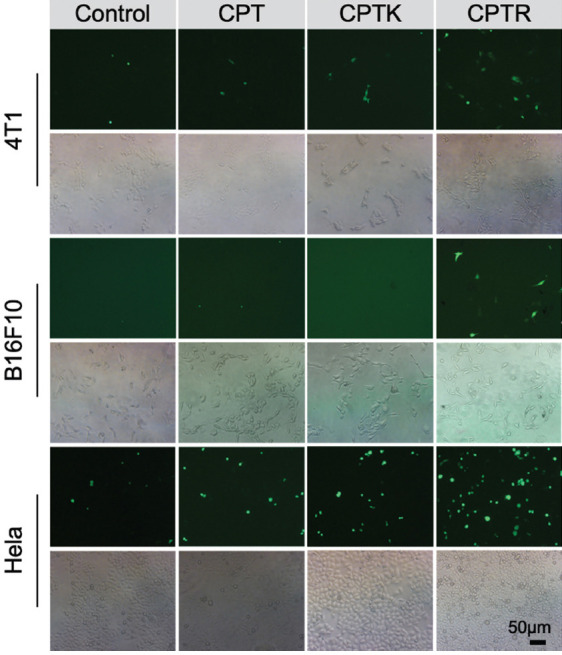
Camptothecin (CPT) has attracted much attention due to its potent antitumor activities. However, the undesirable physicochemical properties, including poor water-solubility, unstable lactone ring and severe adverse effects limit its further application. In this study, two water-soluble prodrugs, CPT-lysine (CPTK) and CPT-arginine (CPTR), were designed and synthesized by conjugating lysine or arginine with CPT, improving its solubility, pharmacokinetic properties and tumor penetration. Importantly, the introduction of arginine into CPTR contributed to the mitochondria-specific delivery, which increased mitochondrial reactive oxygen species (ROS) generation, induced mitochondria dysfunction and enhanced cell apoptosis and in vivo anti-cancer effect. This strategy is believed to hold great potential for organelle-specific synergistic anti-tumor therapy.
Conflict of interest statement
Conflicts of interest: The authors declare no conflicts of interest.
Figures
Similar articles
-
Mitochondria-Specific Anticancer Drug Delivery Based on Reduction-Activated Polyprodrug for Enhancing the Therapeutic Effect of Breast Cancer Chemotherapy.ACS Appl Mater Interfaces. 2019 Aug 14;11(32):29330-29340. doi: 10.1021/acsami.9b10211. Epub 2019 Aug 2. ACS Appl Mater Interfaces. 2019. PMID: 31329411
-
A camptothecin prodrug induces mitochondria-mediated apoptosis in cancer cells with cascade activations.Chem Commun (Camb). 2021 Oct 21;57(84):11033-11036. doi: 10.1039/d1cc04379j. Chem Commun (Camb). 2021. PMID: 34608474
-
Tumor permeable self-delivery nanodrug targeting mitochondria for enhanced chemotherapy.J Control Release. 2023 Sep;361:792-802. doi: 10.1016/j.jconrel.2023.08.032. Epub 2023 Aug 23. J Control Release. 2023. PMID: 37595665
-
An overview on the development of new potentially active camptothecin analogs against cancer.Mini Rev Med Chem. 2014;14(12):953-62. doi: 10.2174/1389557514666141029233037. Mini Rev Med Chem. 2014. PMID: 25355593 Review.
-
Strategies Targeting DNA Topoisomerase I in Cancer Chemotherapy: Camptothecins, Nanocarriers for Camptothecins, Organic Non-Camptothecin Compounds and Metal Complexes.Curr Drug Targets. 2016;17(16):1928-1939. doi: 10.2174/1389450117666160502151707. Curr Drug Targets. 2016. PMID: 27138759 Review.
Cited by
-
Reactive oxygen species mediated apoptotic death of colon cancer cells: therapeutic potential of plant derived alkaloids.Front Endocrinol (Lausanne). 2023 Jul 25;14:1201198. doi: 10.3389/fendo.2023.1201198. eCollection 2023. Front Endocrinol (Lausanne). 2023. PMID: 37560308 Free PMC article. Review.
-
Ni/Mn-Complex-Tethered Tetranuclear Polyoxovanadates: Crystal Structure and Inhibitory Activity on Human Hepatocellular Carcinoma (HepG-2).Molecules. 2023 Sep 28;28(19):6843. doi: 10.3390/molecules28196843. Molecules. 2023. PMID: 37836686 Free PMC article.
-
Co-delivery of dimeric camptothecin and chlorin e6 via polypeptide-based micelles for chemo-photodynamic synergistic therapy.Chin Med. 2023 Oct 13;18(1):133. doi: 10.1186/s13020-023-00817-6. Chin Med. 2023. PMID: 37833804 Free PMC article.
References
-
- Hertzberg RP, Caranfa MJ, Hecht SM. On the mechanism of topoisomerase-I inhibition by Camptothecin-evidence for binding to an enzyme DNA complex. Biochemistry. 1989;28(11):4629–38. https://doi.org/10.1021/bi00437a018. - PubMed
-
- Acevedo-Morantes CY, Acevedo-Morantes MT, Suleiman-Rosado D, Ramirez-Vick JE. Evaluation of the cytotoxic effect of camptothecin solid lipid nanoparticles on MCF7 cells. Drug Deliv. 2013;20(8):338–48. https://doi.org/10.3109/10717544.2013.834412. - PubMed
-
- Gao Y, Li LB, Zhai GX. Preparation and characterization of Pluronic/TPGS mixed micelles for solubilization camptothecin. Colloid Surface B. 2008;64(2):194–9. https://doi.org/10.1016/j.colsurfb.2008.01.021. - PubMed
-
- Fassberg J, Stella VJ. A kinetic and mechanistic study of the hydrolysis of camptothecin and some analogs. J Pharm Sci. 1992;81(7):676–84. https://doi.org/10.1002/jps.2600810718. - PubMed
-
- Mi ZH, Burke TG. Differential interactions of camptothecin lactone and carboxylate forms with human blood components. Biochemistry. 1994;33(34):10325–36. https://doi.org/10.1021/bi00200a013. - PubMed