Circulating cytokine profile and modulation of regulatory T cells in chronic hepatitis B patients with type 2 diabetes mellitus
- PMID: 35801423
- PMCID: PMC9901894
- DOI: 10.17305/bjbms.2022.7525
Circulating cytokine profile and modulation of regulatory T cells in chronic hepatitis B patients with type 2 diabetes mellitus
Abstract
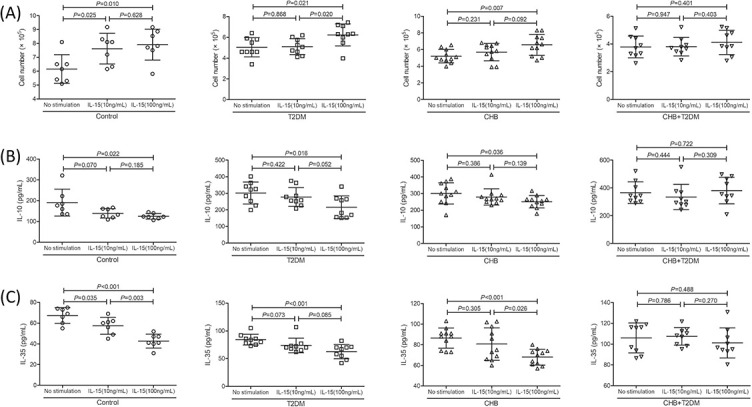
The risk of hepatitis B virus (HBV) infection is higher in patients with diabetes mellitus, and diabetes mellitus is one of the metabolic complications of HBV infection. However, the cytokine profile of chronic hepatitis B (CHB) patients with type 2 diabetes mellitus (T2DM) is not fully understood. The aim of this study was to investigate the cytokine expression profile in CHB patients with T2DM, and to assess the regulatory function of cytokines to regulatory T cells (Tregs). Forty-four T2DM patients, 39 CHB patients, 17 patients with CHB and T2DM, and 21 control subjects were enrolled. Cytokine levels in the plasma were measured by Luminex multiplex assay. CD4+CD25+CD127dim/- Tregs were detected by flow cytometry. Tregs were purified and stimulated with recombinant human interleukin-15 (IL-15). The regulation of IL-15 on Tregs function was investigated by measuring cell number, IL-10/IL-35 secretion, and mRNA expression of immune checkpoint molecules in a Tregs+PBMC co-culture system. We found that levels of IL-1α, IL-6, and IL-33 were upregulated, while IFN-α, IL-2, IL-7, and IL-15 were downregulated in T2DM and CHB patients. CHB patients with T2DM had even lower plasma IL-7 and IL-15 levels. Tregs percentage was elevated in T2DM and CHB patients. CHB patients with T2DM had increased levels of Tregs, which correlated negatively with IL-15. Tregs showed stronger inhibitory activity in CHB patients with T2DM than in controls, T2DM, and CHB patients, which presented as reduction in cellular proliferation and induction of IL-10/IL-35 secretion. IL-15 suppressed Tregs function and inhibited the expression of immune checkpoint molecules in Tregs. The current data suggest that insufficient IL-15 levels and decreased responsiveness of Tregs to IL-15 signaling might contribute to strong immune dysfunction in CHB patients with T2DM.
Figures


Similar articles
-
Interleukin-35 modulates the balance between viral specific CD4+CD25+CD127dim/- regulatory T cells and T helper 17 cells in chronic hepatitis B virus infection.Virol J. 2019 Apr 16;16(1):48. doi: 10.1186/s12985-019-1158-0. Virol J. 2019. PMID: 30992023 Free PMC article.
-
Circulating CD4+ CD25+ regulatory T cells correlate with chronic hepatitis B infection.Immunology. 2008 Jan;123(1):57-65. doi: 10.1111/j.1365-2567.2007.02691.x. Epub 2007 Aug 31. Immunology. 2008. PMID: 17764450 Free PMC article.
-
Interleukin-35 Suppresses Antiviral Immune Response in Chronic Hepatitis B Virus Infection.Front Cell Infect Microbiol. 2017 Nov 13;7:472. doi: 10.3389/fcimb.2017.00472. eCollection 2017. Front Cell Infect Microbiol. 2017. PMID: 29181338 Free PMC article.
-
Changes of Th17 cells, regulatory T cells, Treg/Th17, IL-17 and IL-10 in patients with type 2 diabetes mellitus: a systematic review and meta-analysis.Endocrine. 2022 May;76(2):263-272. doi: 10.1007/s12020-022-03043-6. Epub 2022 Apr 9. Endocrine. 2022. PMID: 35397088
-
Immune Regulation by T Regulatory Cells in Hepatitis B Virus-Related Inflammation and Cancer.Scand J Immunol. 2017 Mar;85(3):175-181. doi: 10.1111/sji.12524. Scand J Immunol. 2017. PMID: 28109025 Review.
Cited by
-
Differences between inflammatory cells infiltrated into tunica intima, media, and adventitia of ascending aortic aneurysms within diabetic and hypertensive patients.Biomol Biomed. 2023 Jul 3;23(4):596-604. doi: 10.17305/bb.2022.8565. Biomol Biomed. 2023. PMID: 36724019 Free PMC article.
-
Differences and Associations of NLRP3 Inflammasome Levels with Interleukins 1α, 1β, 33 and 37 in Adults with Prediabetes and Type 2 Diabetes Mellitus.Biomedicines. 2023 Apr 28;11(5):1315. doi: 10.3390/biomedicines11051315. Biomedicines. 2023. PMID: 37238986 Free PMC article.
-
Lidocaine Modulates Cytokine Production and Reprograms the Tumor Immune Microenvironment to Enhance Anti-Tumor Immune Responses in Gastric Cancer.Int J Mol Sci. 2025 Mar 31;26(7):3236. doi: 10.3390/ijms26073236. Int J Mol Sci. 2025. PMID: 40244064 Free PMC article.
References
-
- Stasi C, Silvestri C, Voller F. Hepatitis B vaccination and immunotherapies: An update. Clin Exp Vaccine Res. 2020;9(1):1–7. https://doi.org/10.7774/cevr.2020.9.1.1. - PMC - PubMed
-
- Cui F, Shen L, Li L, Wang H, Wang F, Bi S, et al. Prevention of chronic hepatitis B after 3 decades of escalating vaccination policy, China. Emerg Infect Dis. 2017;23(5):765–72. https://doi.org/10.3201/eid2305.161477. - PMC - PubMed
-
- Liu J, Liang W, Jing W, Liu M. Countdown to 2030: Eliminating hepatitis B disease, China. Bull World Health Organ. 2019;97(3):230–8. https://doi.org/10.2471/blt.18.219469. - PMC - PubMed
-
- Xu Y, Wang L, He J, Bi Y, Li M, Wang T, et al. Prevalence and control of diabetes in Chinese adults. JAMA. 2013;310(9):948–59. - PubMed
-
- Hamed AE, Elsahar M, Elwan NM, El-Nakeep S, Naguib M, Soliman HH, et al. Managing diabetes and liver disease association. Arab J Gastroenterol. 2018;19(4):166–79. https://doi.org/10.1016/j.ajg.2018.08.003. - PubMed
MeSH terms
Substances
LinkOut - more resources
Full Text Sources
Medical
Research Materials