

Monitoring resistance and resilience using carbon trajectories: Analysis of forest management-disturbance interactions
- PMID: 35801514
- PMCID: PMC10077906
- DOI: 10.1002/eap.2704
Monitoring resistance and resilience using carbon trajectories: Analysis of forest management-disturbance interactions
Abstract
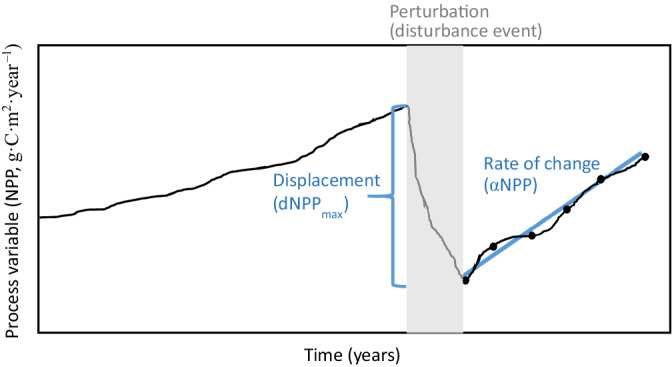
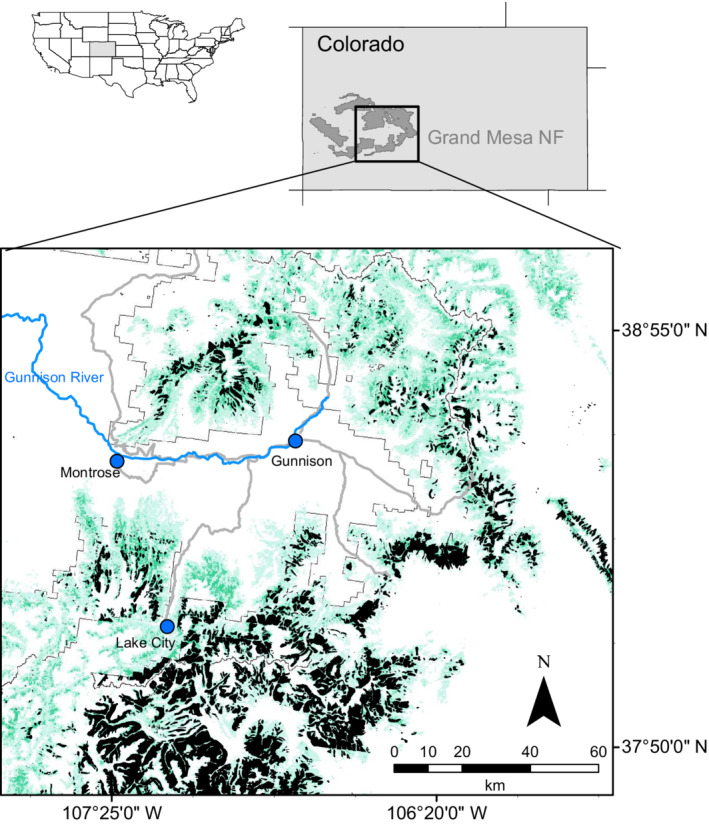
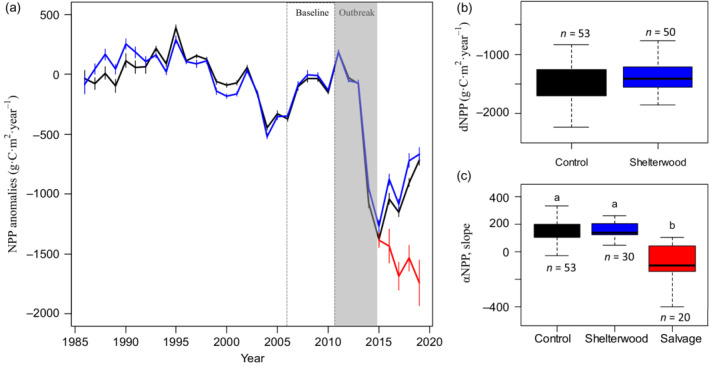
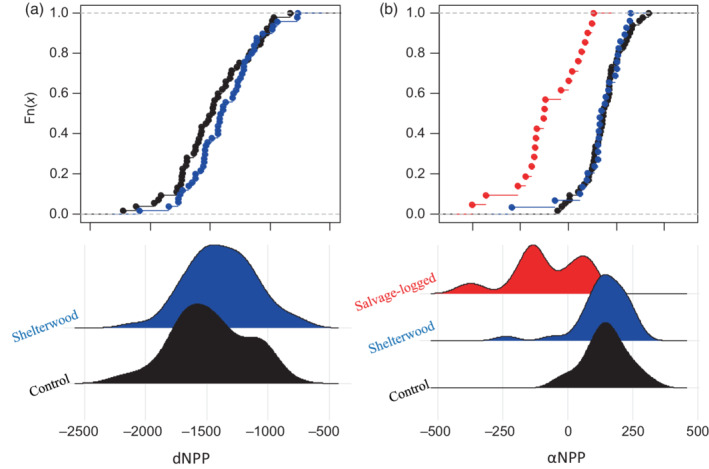
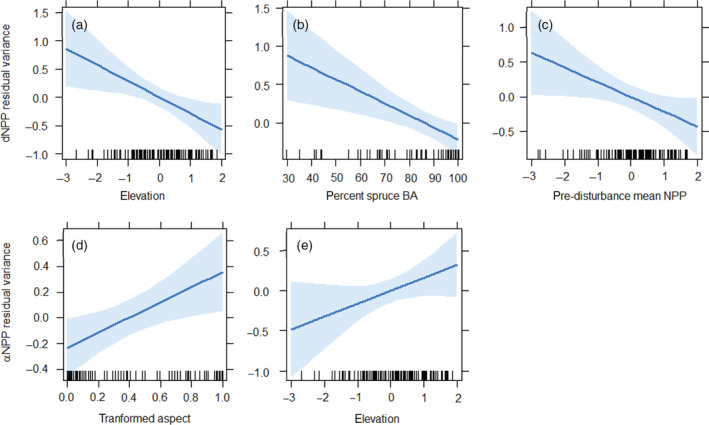
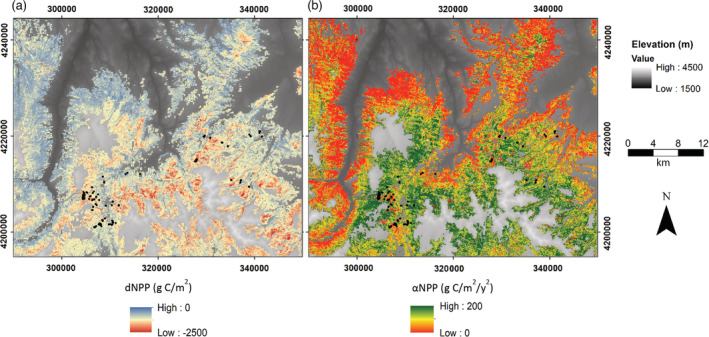
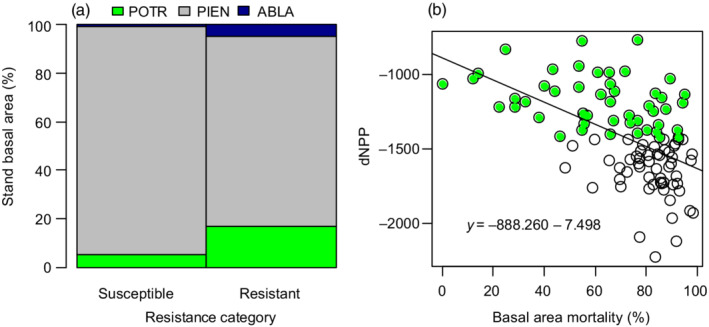
A changing climate is altering ecosystem carbon dynamics with consequences for natural systems and human economies, but there are few tools available for land managers to meaningfully incorporate carbon trajectories into planning efforts. To address uncertainties wrought by rapidly changing conditions, many practitioners adopt resistance and resilience as ecosystem management goals, but these concepts have proven difficult to monitor across landscapes. Here, we address the growing need to understand and plan for ecosystem carbon with concepts of resistance and resilience. Using time series of carbon fixation (n = 103), we evaluate forest management treatments and their relative impacts on resistance and resilience in the context of an expansive and severe natural disturbance. Using subalpine spruce-fir forest with a known management history as a study system, we match metrics of ecosystem productivity (net primary production, g C m-2 year-1 ) with site-level forest structural measurements to evaluate (1) whether past management efforts impacted forest resistance and resilience during a spruce beetle (Dendroctonus rufipennis) outbreak, and (2) how forest structure and physiography contribute to anomalies in carbon trajectories. Our analyses have several important implications. First, we show that the framework we applied was robust for detecting forest treatment impacts on carbon trajectories, closely tracked changes in site-level biomass, and was supported by multiple evaluation methods converging on similar management effects on resistance and resilience. Second, we found that stand species composition, site productivity, and elevation predicted resistance, but resilience was only related to elevation and aspect. Our analyses demonstrate application of a practical approach for comparing forest treatments and isolating specific site and physiographic factors associated with resistance and resilience to biotic disturbance in a forest system, which can be used by managers to monitor and plan for both outcomes. More broadly, the approach we take here can be applied to many scenarios, which can facilitate integrated management and monitoring efforts.
Keywords: ecosystem function; forest carbon; forest disturbance; forest management; spruce beetle.
© 2022 The Authors. Ecological Applications published by Wiley Periodicals LLC on behalf of The Ecological Society of America. This article has been contributed to by U.S. Government employees and their work is in the public domain in the USA.
Conflict of interest statement
The authors declare no conflict of interest.
Figures
References
-
- Alexander, R. 1987. “Ecology, Silviculture, and Management of the Engelmann Spruce ‐ Subalpine Fir Type in the Central and Southern Rocky Mountains.” U.S.D.A. Forest Service, Agriculture Handbook No. 659. Washington, D.C.: U.S.D.A. Forest Service.
-
- Angeler, D. G. , and Allen C. R.. 2016. “Quantifying Resilience.” Journal of Applied Ecology 53: 617–24.
-
- Berthelot, S. , Frühbrodt T., Hajek P., Nock C. A., Dormann C. F., Bauhus J., and Fründ J.. 2021. “Tree Diversity Reduces the Risk of Bark Beetle Infestation for Preferred Conifer Species, but Increases the Risk for Less Preferred Hosts.” Journal of Ecology 109: 2649–61.
-
- Churchill, D. J. , Larson A. J., Dahlgreen M. C., Franklin J. F., Hessburg P. F., and Lutz J. A.. 2013. “Restoring Forest Resilience: From Reference Spatial Patterns to Silvicultural Prescriptions and Monitoring.” Forest Ecology and Management 291: 442–57.
-
- Colorado State Forest Service . 2018. “Report on the Health of Colorado's Forests.” Colorado State Forest Service. Colorado State University, Fort Collins, Colorado.
Publication types
MeSH terms
Substances
Associated data
Grants and funding
LinkOut - more resources
Full Text Sources
Miscellaneous
