. 2022 Sep;48(3):151.
doi: 10.3892/or.2022.8363. Epub 2022 Jul 8.

Anti‑oncogenic and pro‑myogenic action of the MKK6/p38/AKT axis induced by targeting MEK/ERK in embryonal rhabdomyosarcoma

Affiliations

Anti‑oncogenic and pro‑myogenic action of the MKK6/p38/AKT axis induced by targeting MEK/ERK in embryonal rhabdomyosarcoma

Agnese Di Rocco et al. Oncol Rep. 2022 Sep.

Abstract

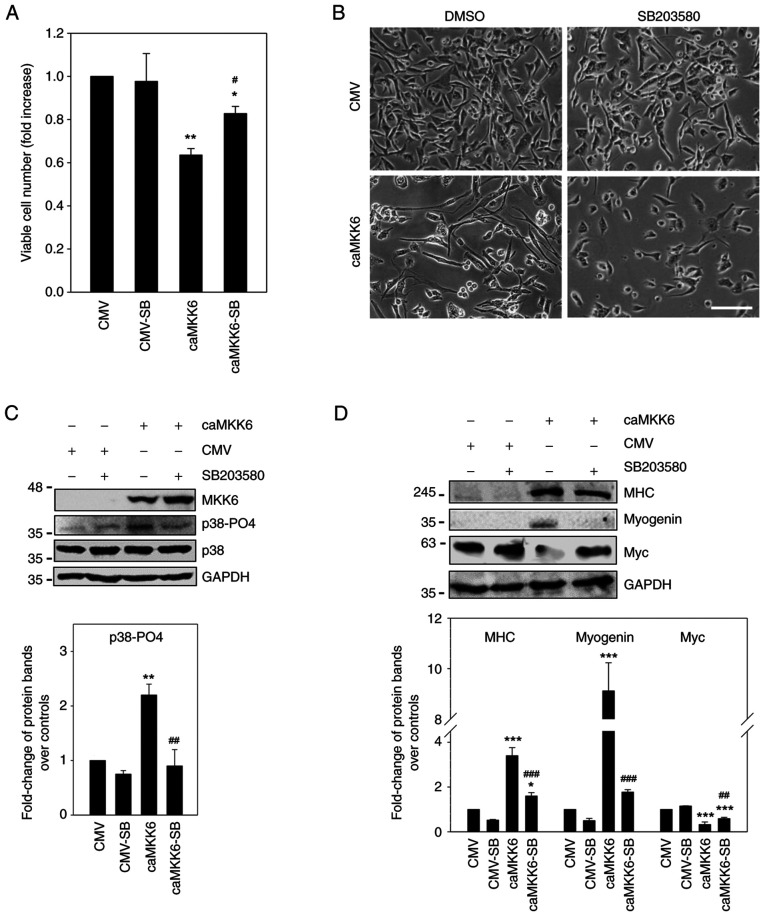
Insights into the molecular and cellular biology of embryonal rhabdomyosarcoma (ERMS), an aggressive paediatric tumour, are required in order to identify new targets for novel treatments that may benefit patients with this disease. The present study examined the functional effects of MKK3 and MKK6, two upstream kinases of p38, and found that the ectopic expression of MKK6 led to rapid p38 activation and the myogenic differentiation of ERMS cells, whereas MKK3 failed to induce differentiation, while maintaining the proliferation state. Myogenin and myosin heavy chain were induced in MKK6‑overexpressing ERMS cells and were inhibited by the p38 inhibitor, SB203580. The expression of Myc and ERK‑PO4 increased under the effect of SB203580, whereas it decreased in MKK6‑overexpressing cells. AKT activation was part of the myogenic program triggered by MKK6 overexpression alone. To the best of our knowledge, the present study demonstrates, for the first time, that the endogenous MKK6 pathway may be recovered by MEK/ERK inhibition (U0126 and trametinib) and that it concomitantly induces the reversal of the oncogenic pattern and the induction of the myogenic differentiation of ERMS cell lines. The effects of MEK/ERK inhibitors markedly increase the potential clinical applications in ERMS, particularly on account of the MEK inhibitor‑induced early MKK6/p38 axis activation and of their anti‑oncogenic effects. The findings presented herein lend further support to the antitumour effects of MKK6; MKK6 may thus represent a novel target for advanced personalised treatments against ERMS.

Keywords: MEK/ERK inhibitors; MKK6; Myc; embryonal rhabdomyosarcoma; p38.


Conflict of interest statement

The authors declare that they have no competing interests.

Figures

Figure 1.
Figure 1.
MKK3 and MKK6 gene expression levels in ERMS and NSM samples. Using the R2-Genomics Analysis and Visualization Platform, MKK3 or MKK6 gene expression was assessed in ERMS primary tumours or NSM across different datasets: (A) Barr and Assmann datasets, (B) Davicioni and Hofman datasets, (C) Schafer Welle dataset. Statistical analysis was performed using one-way ANOVA. (A-C) Right panels illustrate the relative expression of MKK3 and MKK6 in ERMS samples. ERMS, embryonal rhabdomyosarcoma; NSM, normal skeletal muscle.
Figure 2.
Figure 2.
Role of MKK3 and MKK6 in the control of proliferation and differentiation of RD cells. (A) MKK3 and MKK6 western blots are shown as the control of the transfection with dnMKK3, caMKK3 or caMKK6 vectors; western blot analysis of Myc, ERK-PO4 and ERK, cyclin D1 and p21 in RD cells transfected with caMKK6, dnMKK3 or caMKK3. GAPDH was used as a loading control. (B) Western blot analysis of myogenic differentiation markers, MHC, myogenin and p38-PO4 using the same samples as in (A). Tubulin was used as a loading control. Phospho-kinases were also normalised for unphosphorylated isoforms. The numbers on the left of the blots indicate the protein size (kDa). Experiments were performed three times. (A and B) Right panels illustrate the quantitative evaluations of the different western blots performed, expressed as the mean ± SD. Statistical analyses were performed using one-way ANOVA with Dunnett's post hoc test: ***P<0.001; **P<0.01 vs. CMV. MHC, myosin heavy chain.
Figure 3.
Figure 3.
Morphological and functional changes induced by MKK6 or MKK3 overexpression in RD cells. (A) Western blots showing MKK3 and MKK6 expression as the control of the transfection with the specific vectors. Tubulin was used as a loading control. The numbers on the left of the blots indicate the protein size (kDa). (B) Differences in viable RD cell number in cells transfected with empty vector (CMV), caMKK3 or caMKK6 assessed using the trypan blue exclusion assay. Histograms represent the mean value ± SD of three independent experiments. Statistical analyses were performed using one-way ANOVA with Dunnett's post hoc test: **P<0.01; *P<0.05 vs. CMV. (C) Phase contrast images of RD cells transfected with CMV, caMKK3 or caMKK6. MKK6 induces typical elongated myogenic morphology not present in caMKK3 transfected RD cells. (D) CMV-, caMKK3- or caMKK6-transfected cells after immunofluorescence staining with Myc or MHC antibodies. DAPI was used for nuclear staining. Scale bars, 50 µm. Experiments were performed twice. MHC, myosin heavy chain.
Figure 4.
Figure 4.
Anti-oncogenic and pro-myogenic signals are mediated by p38 activation in RD cells. (A) Proliferation of RD cells overexpressing MKK6 treated with or without SB203580 (5 µM) assessed using trypan blue exclusion assay. Histograms represent the mean value ± SD of two independent experiments. Statistical analyses were performed using two-way ANOVA with Tukey's post hoc test: **P<0.01; *P<0.05 vs. CMV; #P<0.05 vs. caMKK6. (B) Morphological evaluation of RD cells transfected with caMKK6 treated with or without SB203580 (5 µM). Scale bars, 50 µm. Experiments were performed twice. (C) RD cells transfected with empty vector (CMV) or caMKK6 and treated with or without the SB203580 (5 µM) p38 inhibitor were analysed for phospho-active p38 expression level. GAPDH was used for protein quantification. Phospho-p38 was also normalised for total unphosphorylated isoform. MKK6 expression is shown as a transfection control. (D) Western blots of MHC, myogenin and Myc in RD cells transfected with CMV or caMKK6 and treated with or without SB203580 (5 µM) p38 inhibitor. (C and D) The numbers on the left of the blots indicate the protein size (kDa). Lower panels represent quantitative evaluations of the western blots expressed as the mean ± SD. Statistical analyses were performed using two-way ANOVA with Tukey's post hoc test: ***P<0.001; **P<0.01; *P<0.05 vs. CMV; ###P<0.001; ##P<0.01 vs. caMKK6. Experiments were performed three times. MHC, myosin heavy chain.
Figure 5.
Figure 5.
Anti-oncogenic and pro-myogenic effects induced by MEK/ERK inhibitor U0126 in RD cells are mediated by p38. (A) Cell proliferation of p38-silenced RD cells treated with or without U0126 (10 µM) assessed using trypan blue exclusion assay. Histograms represent the mean value ± SD of two independent experiments. Statistical analyses were performed using two-way ANOVA with Tukey's post hoc test: **P<0.01; *P<0.05 vs. CMV. (B) Morphological evaluation of p38-silenced RD cells treated with or without U0126 (10 µM). Scale bars, 50 µm. Experiments were performed twice. (C) RD cells silenced with a combination of two p38 shRNA or scramble (SCR) shRNA and treated or not with 10 µM U0126 were analysed for phospho-active p38 expression level. GAPDH was used for protein quantification. (D) Western blots of MHC, myogenin and Myc in RD cells silenced as in (C) treated with 10 µM U0126 or left untreated. GAPDH was used as a loading control. (C and D) The numbers on the left of the blots indicate the protein size (kDa). Lower panels represent the quantitative evaluations of the western blots expressed as the mean ± SD. Statistical analyses were performed using two-way ANOVA with Tukey's post hoc test: ***P<0.001; **P<0.01 vs. SCR; §§§P<0.001; §§P<0.01 vs. SCR-U0126. Experiments were performed three times. MHC, myosin heavy chain.
Figure 6.
Figure 6.
TE cell differentiation is dependent on MKK6/p38 pathway activation. TE cells transfected with CMV or caMKK6 were treated with 5 µM SB203580 or left untreated; western blots of MKK6, Myc, ERK-PO4, p38-PO4, myogenin and MHC were normalised to tubulin. Phospho-kinases were also normalised for unphosphorylated isoforms. The numbers on the left of the blots indicate the protein size (kDa). Lower panel represent histograms of the quantitative evaluations of the western blots expressed as the mean ± SD. Statistical analyses were performed using two-way ANOVA with Tukey's post hoc test: ***P<0.001; *P<0.05 vs. CMV; ###P<0.001; ##P<0.01 vs. caMKK6. Experiments were performed three times. TE cells, TE671 cells; MHC, myosin heavy chain.
Figure 7.
Figure 7.
MKK6 is induced by MEK/ERK inhibitors in RD cells. RD cells were treated with 10 µM U0126 or 10 nM trametinib and the expression levels of MKK6-PO4, p38-PO4, MHC and myogenin were examined using western blot analysis. GAPDH and unphosphorylated kinases were used to normalise MKK6 and p38 (3 h and O/N panel); tubulin and GAPDH were used to normalise MHC and myogenin, respectively (3 days panel). The numbers on the left of the blots indicate the protein size (kDa). Lower panels represent histograms of the quantitative evaluations of the western blots, expressed as the mean ± SD. Statistical analyses were performed by using one-way ANOVA with Dunnett's post hoc test: ***P<0.001; **P<0.01; *P<0.05 vs. negative control. Experiments were performed three times. MHC, myosin heavy chain; O/N, overnight; C, negative control.
Figure 8.
Figure 8.
AKT is induced by MEK/ERK inhibition. RD and TE cells were treated with 10 µM U0126 or left untreated and lysates were analysed for AKT-PO4 Ser473 and AKT-PO4 Thr308 expression. Both phosphorylation levels were increased after O/N, 1 day and 3 days of treatments. The numbers on the left of the blots indicate the protein size (kDa). In the lower panels, quantitative evaluations of the western blots are shown as the mean ± SD. Statistical analyses were performed using a Student's t-test: ***P<0.001; **P<0.01; *P<0.05 vs. negative control (control). Experiments were performed twice. TE cells, TE671 cells; O/N, overnight.
Figure 9.
Figure 9.
AKT activation is part of myogenic differentiation in RD cells. (A) Cells transfected with empty vector (CMV), caMKK3 or caMKK6 were analysed for AKT-PO4 Ser473, AKT-PO4 Thr308 and p38-PO4 expression. Both AKT phosphorylation sites and p38 were activated by caMKK6 transfection, whereas they were absent in CMV and caMKK3 transfected cells; MKK3 and MKK6 overexpression is shown as a transfection control. GAPDH was used for protein quantification. Phospho-kinases were also normalised for unphosphorylated isoforms. The numbers on the left of the blots indicate the protein size (kDa). Right panel represents histograms of the quantitative evaluations of the western blots, expressed as the mean ± SD. Statistical analyses were performed using one-way ANOVA with Dunnett's post hoc test: ***P<0.001 vs. CMV. (B) Western blots showing the reduced AKT phosphorylation in caMKK6-transfected RD cells treated with 5 µM SB203580. (C) Both AKT phosphorylation levels were not activated by U0126 in p38-silenced RD cells, whilst they were present in scramble control-transfected (SCR) cells treated with U0126. GAPDH was used as loading control. (B and C) The numbers on the left of the blots indicate the protein size (kDa). Lower panels represent histograms of the quantitative evaluations of the western blots, expressed as the mean ± SD. Statistical analyses were performed using two-way ANOVA with Tukey's post hoc test: ***P<0.001; **P<0.01; *P<0.05 vs. CMV or SCR; ###P<0.001 vs. caMKK6; §§§P<0.001 vs. SCR-U0126. Experiments were performed twice.
Figure 10.
Figure 10.
MKK3 and MKK6 kinases in ERMS cells. Summary diagram describing the differential role played by MKK3 and MKK6 in controlling growth arrest and myogenic differentiation in ERMS cells. MHC, myosin heavy chain.

Similar articles

Cited by

References

    1. Shern JF, Chen L, Chmielecki J, Wei JS, Patidar R, Rosenberg M, Ambrogio L, Auclair D, Wang J, Song YK, et al. Comprehensive genomic analysis of rhabdomyosarcoma reveals a landscape of alterations affecting a common genetic axis in fusion-positive and fusion-negative tumors. Cancer Discov. 2014;4:216–231. doi: 10.1158/2159-8290.CD-13-0639. - DOI - PMC - PubMed
    1. Sun X, Guo W, Shen JK, Mankin HJ, Hornicek FJ, Duan Z. Rhabdomyosarcoma: Advances in molecular and cellular biology. Sarcoma. 2015;2015:232010. doi: 10.1155/2015/232010. - DOI - PMC - PubMed
    1. Chardin P, Yeramian P, Madaule P, Tavitian A. N-ras gene activation in the RD human rhabdomyosarcoma cell line. Int J Cancer. 1985;35:647–652. doi: 10.1002/ijc.2910350513. - DOI - PubMed
    1. Felix CA, Kappel CC, Mitsudomi T, Nau MM, Tsokos M, Crouch GD, Nisen PD, Winick NJ, Helman LJ. Frequency and diversity of p53 mutations in childhood rhabdomyosarcoma. Cancer Res. 1992;52:2243–2247. - PubMed
    1. McCubrey JA, Steelman LS, Abrams SL, Lee JT, Chang F, Bertrand FE, Navolanic PM, Terrian DM, Franklin RA, D'Assoro AB, et al. Roles of the RAF/MEK/ERK and PI3K/PTEN/AKT pathways in malignant transformation and drug resistance. Adv Enzyme Regul. 2006;46:249–279. doi: 10.1016/j.advenzreg.2006.01.004. - DOI - PubMed

MeSH terms

Substances