. 2022 Jul 8;7(13):e160267.
doi: 10.1172/jci.insight.160267.

HIV viral transcription and immune perturbations in the CNS of people with HIV despite ART

Affiliations

HIV viral transcription and immune perturbations in the CNS of people with HIV despite ART

Shelli F Farhadian et al. JCI Insight. .

Abstract

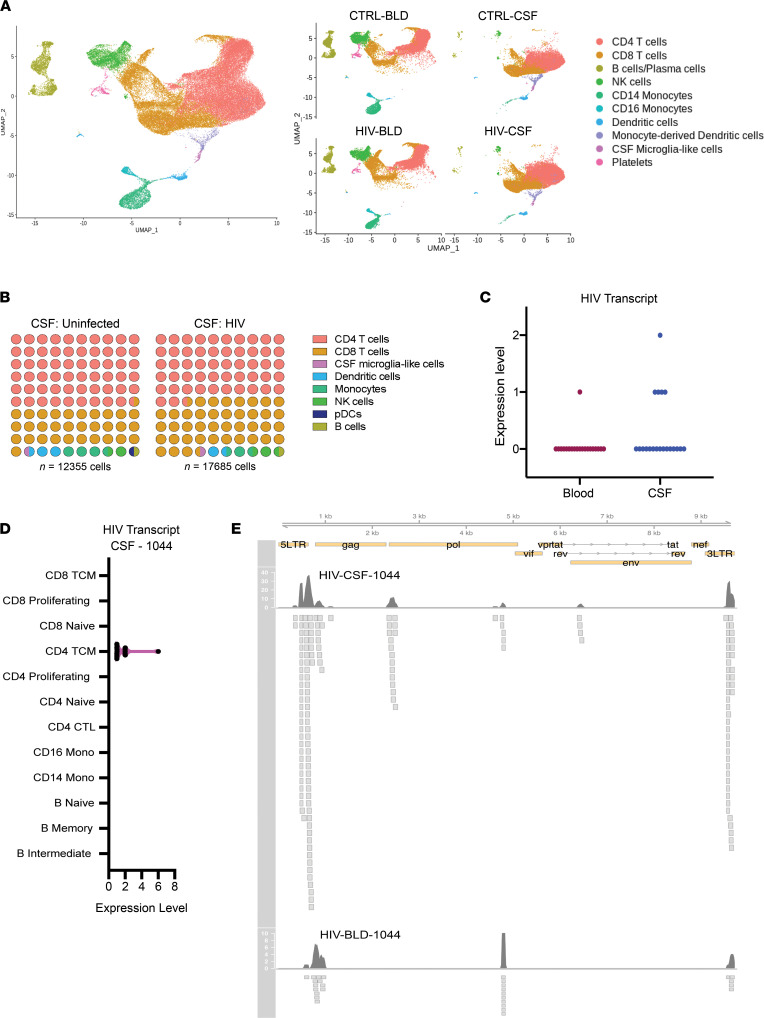
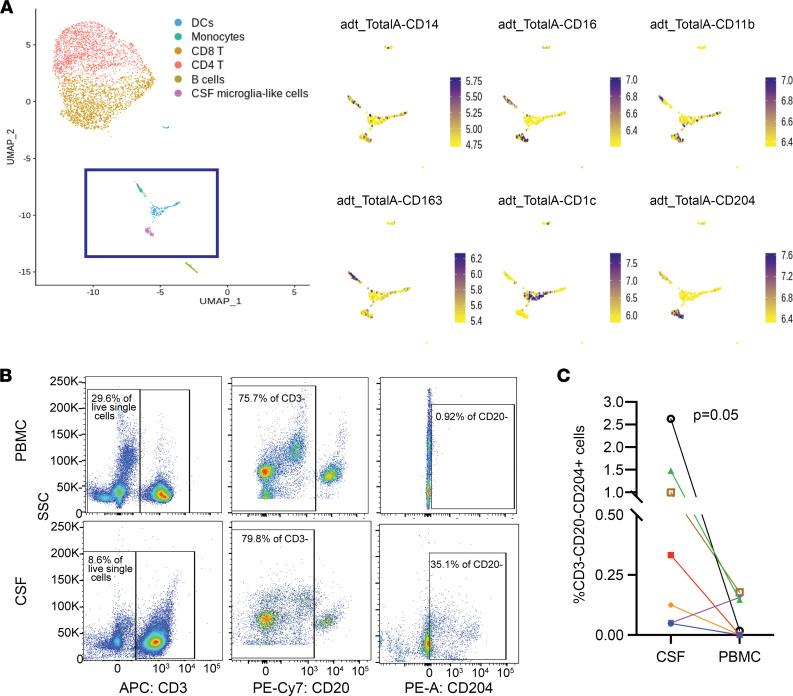
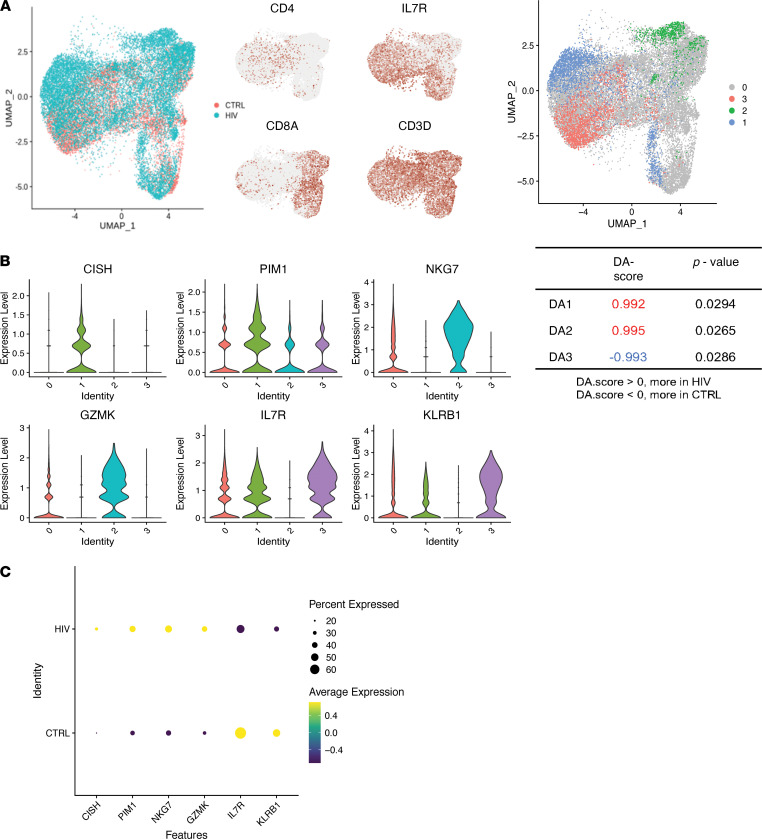
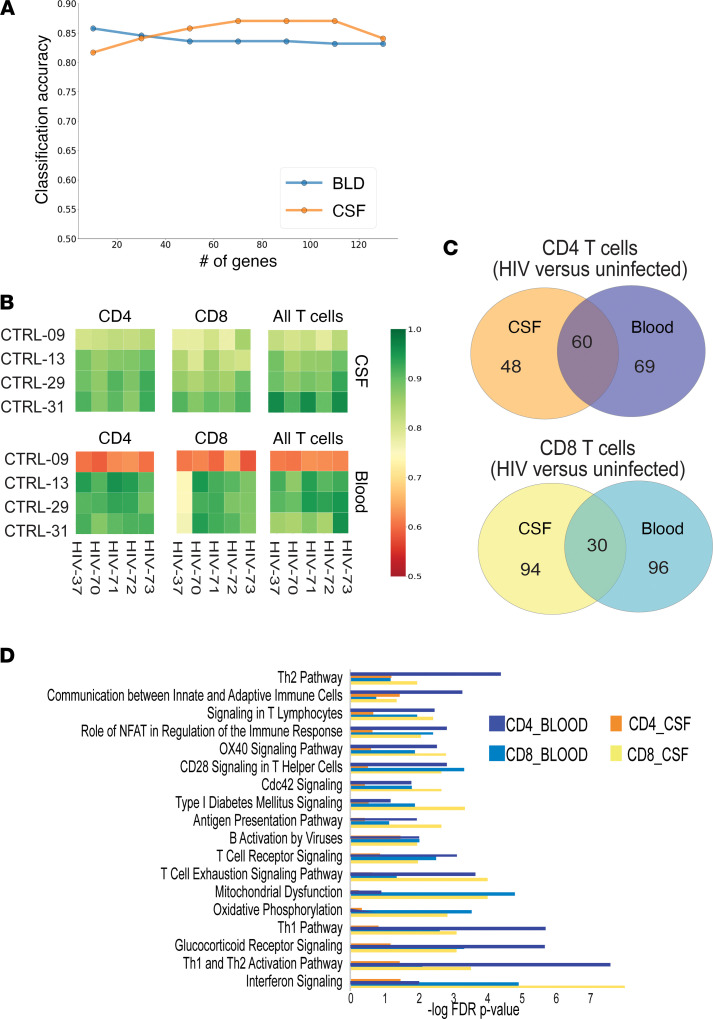
People with HIV (PWH) on antiretroviral therapy (ART) experience elevated rates of neurological impairment, despite controlling for demographic factors and comorbidities, suggesting viral or neuroimmune etiologies for these deficits. Here, we apply multimodal and cross-compartmental single-cell analyses of paired cerebrospinal fluid (CSF) and peripheral blood in PWH and uninfected controls. We demonstrate that a subset of central memory CD4+ T cells in the CSF produced HIV-1 RNA, despite apparent systemic viral suppression, and that HIV-1-infected cells were more frequently found in the CSF than in the blood. Using cellular indexing of transcriptomes and epitopes by sequencing (CITE-seq), we show that the cell surface marker CD204 is a reliable marker for rare microglia-like cells in the CSF, which have been implicated in HIV neuropathogenesis, but which we did not find to contain HIV transcripts. Through a feature selection method for supervised deep learning of single-cell transcriptomes, we find that abnormal CD8+ T cell activation, rather than CD4+ T cell abnormalities, predominated in the CSF of PWH compared with controls. Overall, these findings suggest ongoing CNS viral persistence and compartmentalized CNS neuroimmune effects of HIV infection during ART and demonstrate the power of single-cell studies of CSF to better understand the CNS reservoir during HIV infection.

Keywords: AIDS/HIV; Neurological disorders; Neuroscience.


Conflict of interest statement

Conflict of interest: The authors have declared that no conflict of interest exists.

Figures

Figure 1
Figure 1. Single-cell RNA sequencing of CSF and blood from PWH and uninfected controls.
(A) Combined (left) and split (right) uniform manifold approximation and projection (UMAP) of CSF cells and PBMCs (blood, BLD) from PWH and uninfected controls (CTRL). n = 75,734 cells (30,040 CSF cells and 35,694 PBMCs). (B) Frequency of immune cell types in the CSF in PWH compared with uninfected controls demonstrating significantly (P < 0.05, χ2 test) more CD8+ and fewer CD4+ T cells in the CSF of PWH compared with uninfected controls (n = 17,685 cells from 5 PWH and n = 12,355 cells from 4 uninfected controls). (C) HIV transcript expression levels in blood (PBMCs) and CSF single cells mapped to consensus HXB2 HIV reference sequence. (D) HIV transcript expression within annotated immune cell subsets using reference-based mapping. Shown in pink is violin plot with black dots representing individual cells in which HIV transcripts were detected. For C and D, data are combined from 4 PWH (n = 16,147 CSF cells, and n = 17,061 PBMCs). (E) Alignment track of HIV transcripts in all single cells from CSF and blood of 1 participant (HIV-1044) across the annotated HXB2 consensus sequence. Top panel with read coverage displayed as histogram and below is pile-up view of the individual reads. pDC, plasmacytoid DC; TCM, T central memory; CTL, cytoxic T lymphocyte.
Figure 2
Figure 2. CD204 is a protein marker for CSF microglia-like cells.
(A) Combined protein and transcriptome analysis of CSF cells in a person with HIV. Left panel shows clustering of single cells based on transcriptome analysis. Myeloid cells are contained within the purple box. Right panel shows CITE-seq analysis of 6 protein markers of CSF myeloid cells (UMAP), demonstrating that CD204 is a protein marker for CSF microglia-like cells. (B) Representative flow cytometry plot and (C) frequency of CD3CD20CD204+ cells in the CSF and the PBMCs of PWH detected by flow cytometry. Each color represents an individual participant. n = 7. Two-sided P = 0.05, Wilcoxon matched pairs signed rank test.
Figure 3
Figure 3. Differential abundance analysis of CSF T cells.
(A) Left, UMAP projection of CSF T cells from PWH (blue) and uninfected controls (CTRL; red). Right, cells are colored if they belong to a region that is DA in PWH compared with CTRL. Identities 1 and 2 are DA regions that were found more frequently in PWH, and identity 3 is the DA region that was found less frequently in PWH compared with uninfected controls. Cells colored gray are not in DA regions. (B) Violin plot showing expression of genes that distinguish the DA regions from all other T cells. (C) Dot plot showing average expression of DA T cell marker genes in the CSF T cells of PWH compared with uninfected controls. The size of the dot corresponds to the percentage of cells expressing the gene. The color represents the average expression level. n = 5 PWH and n = 4 uninfected controls.
Figure 4
Figure 4. Feature selection by STG identifies genes that differentiate compartment (CSF or blood) and disease state (HIV or uninfected) with high accuracy.
(A) Accuracy plots for predicting HIV versus uninfected donor status of CSF or blood cells using the number of features shown on x axis. (B) Accuracy heatmaps for individual test pairs using a leave-two-out cross-validation. Green indicates that the disease state (HIV or uninfected) of the sample was ascertained with high accuracy using genes derived from the STG model. (C) Venn diagrams for genes that predict disease state in each compartment and cell type. (D) Ingenuity pathway analysis (IPA) of genes from C. n = 5 PWH and n = 4 uninfected controls.
Figure 5
Figure 5. CSF inflammatory cytokines and chemokines are dysregulated in PWH despite ART.
(A) Heatmap demonstrating cytokine levels in the CSF of PWH (purple) compared with uninfected controls (green). Shown is the list of cytokines for which levels in PWH are significantly different from uninfected controls (q < 0.05). Cytokines are ordered by significance (q value), and participants are ordered by hierarchical clustering. Adjusted P value (q) computed by paired t tests and FDR controlled using Benjamini, Krieger, and Yekutieli. (B) Linear regression analysis demonstrating the effect of the CD4/CD8 T cell ratio on CSF cytokines in PWH after controlling for age, race, sex, and history of substance use disorder. n = 44 PWH, n = 22 uninfected controls.

References

    1. Samji H, et al. Closing the gap: increases in life expectancy among treated HIV-positive individuals in the United States and Canada. PLoS One. 2013;8(12):e81355. doi: 10.1371/journal.pone.0081355. - DOI - PMC - PubMed
    1. Borges AH, et al. Predicting risk of cancer during HIV infection: the role of inflammatory and coagulation biomarkers. AIDS. 2013;27(9):1433–1441. doi: 10.1097/QAD.0b013e32835f6b0c. - DOI - PMC - PubMed
    1. Ancuta P, et al. Microbial translocation is associated with increased monocyte activation and dementia in AIDS patients. PLoS One. 2008;3(6):e2516. doi: 10.1371/journal.pone.0002516. - DOI - PMC - PubMed
    1. Lyons JL, et al. Plasma sCD14 is a biomarker associated with impaired neurocognitive test performance in attention and learning domains in HIV infection. J Acquir Immune Defic Syndr. 2011;57(5):371–379. doi: 10.1097/QAI.0b013e3182237e54. - DOI - PMC - PubMed
    1. Anderson AM, et al. Cognitive and neuronal link with inflammation: a longitudinal study in people with and without HIV infection. J Acquir Immune Defic Syndr. 2020;85(5):617–625. doi: 10.1097/QAI.0000000000002484. - DOI - PMC - PubMed

Publication types