. 2022 Jul 22;50(13):7680-7696.
doi: 10.1093/nar/gkac563.

Structural and functional characterization of DdrC, a novel DNA damage-induced nucleoid associated protein involved in DNA compaction

Affiliations

Structural and functional characterization of DdrC, a novel DNA damage-induced nucleoid associated protein involved in DNA compaction

Anne-Sophie Banneville et al. Nucleic Acids Res. .

Erratum in

Abstract

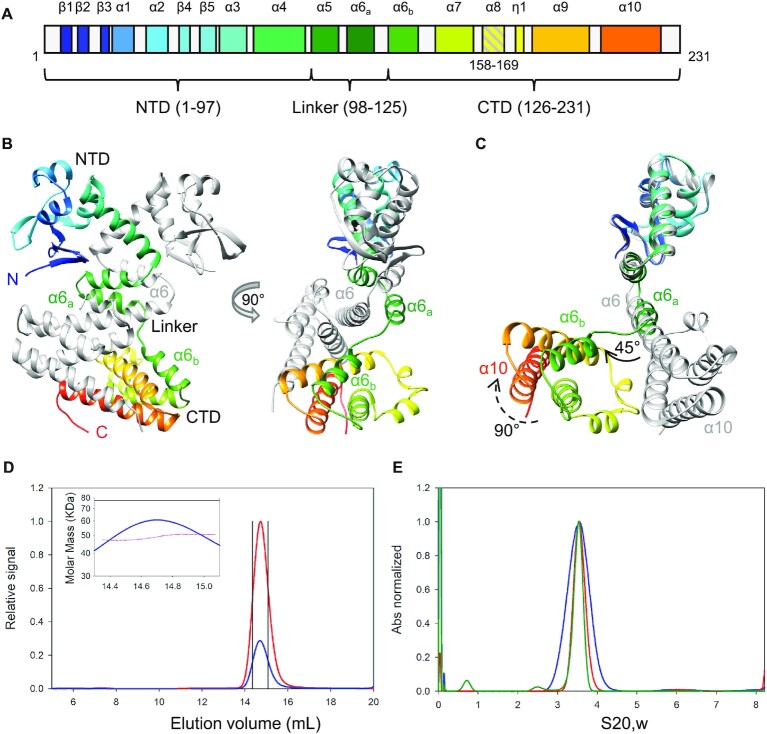
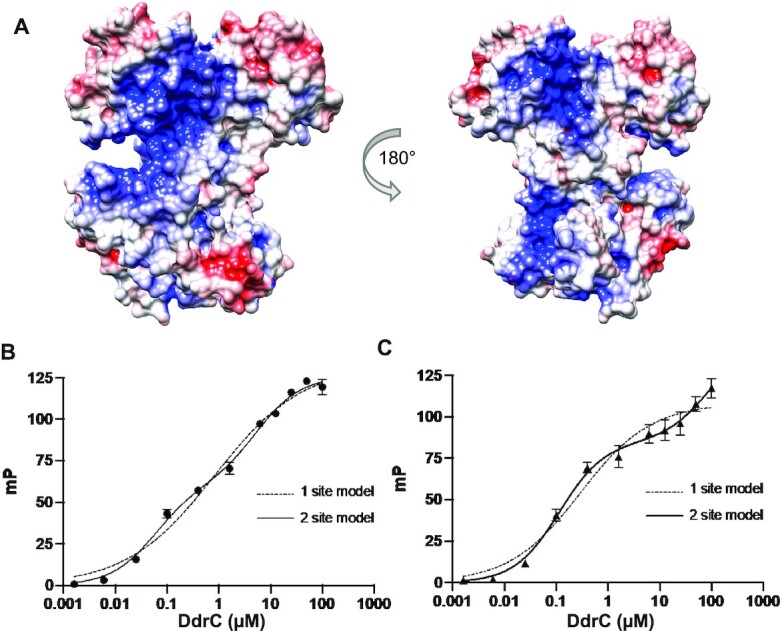
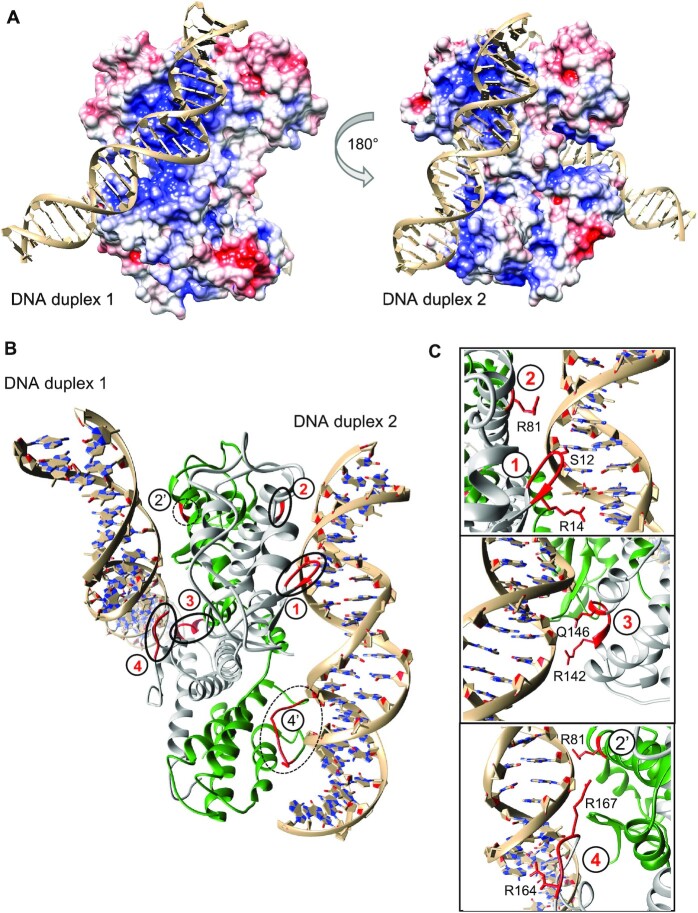
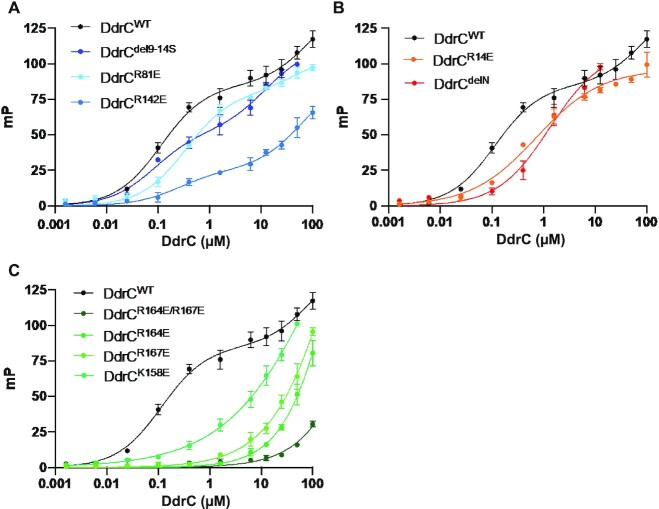
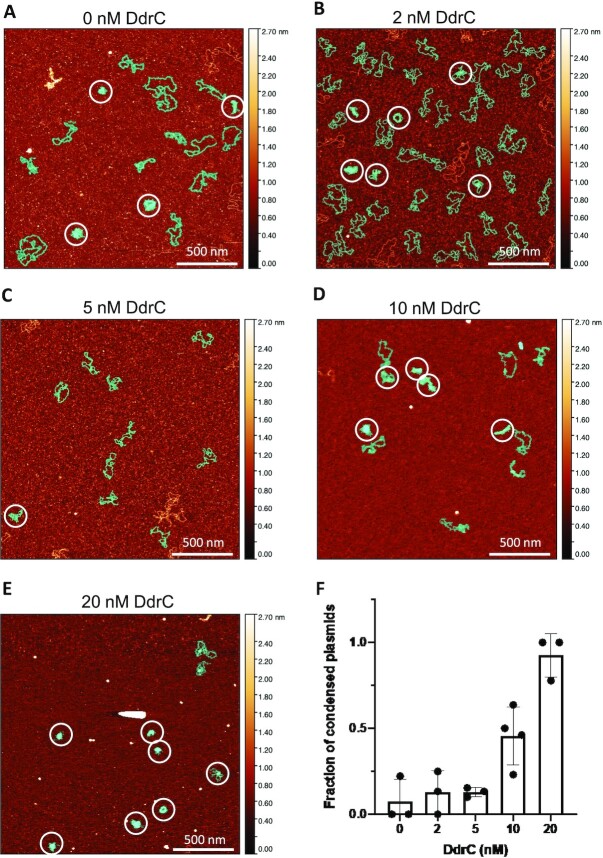
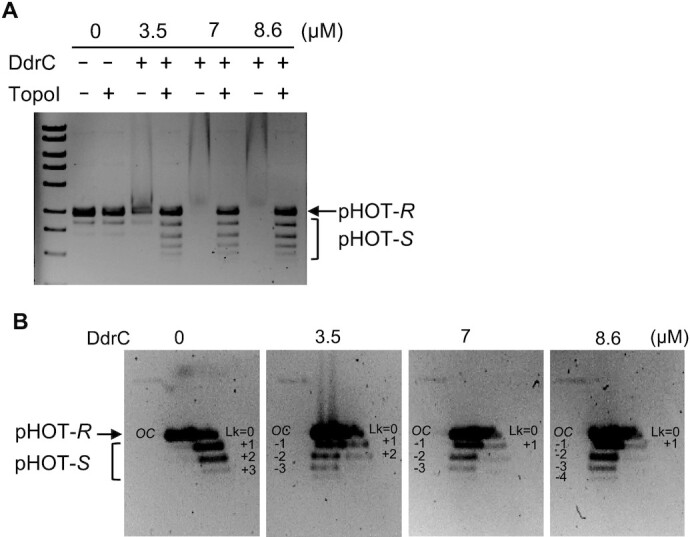
Deinococcus radiodurans is a spherical bacterium well-known for its outstanding resistance to DNA-damaging agents. Exposure to such agents leads to drastic changes in the transcriptome of D. radiodurans. In particular, four Deinococcus-specific genes, known as DNA Damage Response genes, are strongly up-regulated and have been shown to contribute to the resistance phenotype of D. radiodurans. One of these, DdrC, is expressed shortly after exposure to γ-radiation and is rapidly recruited to the nucleoid. In vitro, DdrC has been shown to compact circular DNA, circularize linear DNA, anneal complementary DNA strands and protect DNA from nucleases. To shed light on the possible functions of DdrC in D. radiodurans, we determined the crystal structure of the domain-swapped DdrC dimer at a resolution of 2.5 Å and further characterized its DNA binding and compaction properties. Notably, we show that DdrC bears two asymmetric DNA binding sites located on either side of the dimer and can modulate the topology and level of compaction of circular DNA. These findings suggest that DdrC may be a DNA damage-induced nucleoid-associated protein that enhances nucleoid compaction to limit the dispersion of the fragmented genome and facilitate DNA repair after exposure to severe DNA damaging conditions.


Figures

Figure 1.
Figure 1.
DdrC is an unusual domain-swapped dimer composed of two domains. (A) Secondary structure organization of DdrC (chain B), colored from blue (N-terminus) to orange (C-terminus). In chain A, helix α8 (residues 158 to 169) is disordered and helix α6 forms a long continuous helix. NTD: N-terminal domain, CTD: C-terminal domain. (B) Front and side views of the DdrC dimer, with monomer A colored in gray and monomer B colored in rainbow colors from blue (N-terminus) to red (C-terminus). The side view of DdrC highlights the asymmetry between the two faces of the dimer. (C) Side view of the overlay of the two DdrC chains using the NTD as a reference. Chains A and B are colored as in (B). The α6a and α6b helices in chain B correspond to a distorted conformation of the long α6 helix of chain A, probably to accommodate the domain swapping of the two monomers. (D) Size-exclusion chromatogram obtained from SEC-MALLS analysis of DdrC. The blue line corresponds to the refractive index and the red line to the light scattering. The inset represents a close-up view of the DdrC refractive index peak (defined by black lines), illustrating molar mass points in pink obtained along the peak. The mean mass of DdrC derived from this data was 49.1 kDa, corresponding to a dimer. (E) Distribution of sedimentation coefficients obtained by analytical ultracentrifugation analysis of DdrC at three concentrations: 1 mg.ml–1 (green), 4 mg.ml–1 (red) and 8 mg.ml–1 (blue). The normalized absorption is plotted versus S20,w, the sedimentation coefficient corrected to 20°C in pure water. A majority of the sample (94 ± 4%) was found in a peak at a S20,w value of 3.55S with a mean mass of 43.5 ± 3.5 kDa from Non-Interacting Species analysis, corresponding here again to a dimer.
Figure 2.
Figure 2.
DdrC exhibits a classic yet negatively charged wHTH motif. (A) wHTH motifs of DdrC and structurally similar proteins, BsRacA (PDB code 5I44), Dachshund (PDB code 1L8R) and SKI-DHD (PDB code 1SBX). The proteins are colored based on their secondary structure, with α-helices in blue and β-sheets in orange. (B) DdrC, BsRacA, Dachshund and SKI-DHD are colored by electrostatic surface potential, as calculated by APBS. The color scale is the same for all proteins, ranging from −5 to + 5 kT/e, with negative charges in red and positive charges in blue.
Figure 3.
Figure 3.
DdrC dimer bears two DNA-binding sites. (A) Depiction of the electrostatic surface potential of the DdrC dimer, as calculated by APBS. Positive and negative charges are colored in blue and red, respectively from −5 to + 5 kT/e. (B, C) Fluorescence polarization measurements of 0–100 μM DdrC binding to 10 nM 5′-FAM-labeled dsDNA oligonucleotides of 20 bp (B) or 50 bp (C). The graphs present the mean (black circles for 20 bp DNA and black triangles for 50 bp DNA) and standard deviation (SD shown as vertical error bars) of four individual polarization values recorded at each DdrC concentration. Data were fitted to one of two models using Prism 8: one-site specific binding with Hill coefficient (dashed line) and two-sites specific binding (solid line). The two fits were compared using the Akaike's Information Criterion, AIC, implemented in Prism 8, and the probability of the two-sites model being correct was determined to be >99.99% for both the 20 and 50mer dsDNAs with deltaAIC values of respectively 40.2 and 47.09.
Figure 4.
Figure 4.
DdrC-dsDNA models derived from MD simulations. (A) Model of DNA-bound DdrC dimer used for MD simulations. Two 25 bp dsDNA fragments were manually positioned along the two positively charged grooves lining each side of the DdrC dimer. (B) Model of DNA-bound DdrC dimer (monomer A in grey and monomer B in green) at the end of MD simulation run3, illustrating the four major contact points (labeled 1–4 in red) and two additional contact points (labelled 2′ and 4′ in black) between the DNA duplexes and the DdrC protein. The regions of DdrC in contact with the DNA are highlighted in red. (C) Close-up views of the major DdrC-DNA contact sites illustrated in (B). The main residues involved in the interactions with the DNA are shown as sticks and are labelled.
Figure 5.
Figure 5.
DNA binding curves derived from the fluorescence polarization (FP) measurements of wild-type (WT) and the three classes of DdrC mutants, class 1 (A), class 2 (B) and class 3 (C), binding to 50 bp dsDNA. The binding curve of WT DdrC is shown in black in all three panels for comparison. (A) Blue curves correspond to class 1 DdrC mutants (DdrCdel9-14S, DdrCR81E and DdrCR142E) retaining two distinct DNA binding sites. (B) Red/orange curves correspond to class 2 DdrC mutants (DdrCdelN and DdrCR14E) having lost the second, low-affinity binding site and exhibiting reduced affinity for their high-affinity site. (C) Green curves correspond to DdrC mutants (DdrCK158E, DdrCR164E, DdrCR167E and DdrCR164E/R167E) having severely impaired DNA binding properties. For reasons of clarity, the binding curve of DdrCR164A/R167A, which is very similar to that of DdrCR164E is only presented in Supplementary Figure S8. Data points and associated error bars correspond respectively to the mean and standard deviation of four individual FP measurements. In all cases, the data points were fitted to either a 1-site or a 2-site binding model in GraphPad Prism 8 and the best fits are shown. DNA binding constants derived from these fits are presented in Table 3 and individual graphs are provided in Supplementary Figure S8.
Figure 6.
Figure 6.
DdrC maintains circular plasmid in a condensed conformation. (A–E) Representative AFM images of 0.5 nM of pUC19sc incubated with 0 (A), 2 (B), 5 (C), 10 (D) and 20 nM (E) DdrC. Additional images are presented in Supplementary Figure S9. All images correspond to 4 μm2 areas, in which the assemblies displaying a more condensed conformation are indicated by white circles. The light-blue/green mask highlights assemblies that have been used in the statistical analysis presented in (F). Assemblies that touch the border of the image or were not clearly identifiable due to unresolved overlapping were excluded from the statistical analysis. The z-scale bar is shown as a color gradient to indicate the distribution of height in the images. Scale bar corresponds to 500 nm. (F) Histogram and scatter plot illustrating the mean fraction of condensed pUC19sc-DdrC assemblies as a function of DdrC concentration. The error bars represent the standard deviation of at least three replicates. Individual data points correspond to the fraction of condensed assemblies derived from a single AFM image after estimation of the projected surface area of individual assemblies.
Figure 7.
Figure 7.
DdrC changes the topology of plasmid DNA by constraining DNA supercoils. (A) Relaxed pHOT plasmid DNA (200 ng, pHOT-R) incubated with 0, 3.5, 7 and 8.6 μM DdrC was then treated or not with topoisomerase I (TopoI) from wheat germ. After deproteinization, reaction products were separated by electrophoresis on a 1.2% agarose gel to resolve topoisomers. Treating relaxed plasmid DNA with TopoI has no effect, whereas treating relaxed plasmid DNA pre-incubated with 3.5–8.6 μM DdrC prior to the TopoI treatment results in a ladder-like pattern, corresponding to topoisomers exhibiting different extents of supercoiling (pHOT-S). (B) The supercoiled topoisomers resulting from DdrC and TopoI treatment were further separated by bidimensional gel with 3 μg/ml chloroquine included in the gel and buffer in the second dimension. Under these conditions, positively supercoiled topoisomers (with linking numbers of +1, +2, +3) migrate towards the right and negatively supercoiled topoisomers (with linking numbers of −1, −2, −3, −4) migrate leftwards (Supplementary Figure S10). The associated changes in linking number are indicated next to their respective bands. OC: open circular (nicked) DNA. The full gels are shown in Supplementary Figure S10.

Similar articles

Cited by

References

    1. Battista J.R. Against all odds: the survival strategies of Deinococcus radiodurans. Annu. Rev. Microbiol. 1997; 51:203–224. - PubMed
    1. Daly M.J. Accumulation of Mn(II) in Deinococcus radiodurans facilitates gamma-radiation resistance. Science. 2004; 306:1025–1028. - PubMed
    1. Cox M.M., Battista J.R.. Deinococcus radiodurans - the consummate survivor. Nat. Rev. Microbiol. 2005; 3:882–892. - PubMed
    1. Timmins J., Moe E.. A decade of biochemical and structural studies of the DNA repair machinery of Deinococcus radiodurans. Comput. Struct. Biotechnol. J. 2016; 14:168–176. - PMC - PubMed
    1. Floc’h K., Lacroix F., Servant P., Wong Y.-S., Kleman J.-P., Bourgeois D., Timmins J.. Cell morphology and nucleoid dynamics in dividing Deinococcus radiodurans. Nat. Commun. 2019; 10:3815. - PMC - PubMed

Publication types