. 2022 Jul 22;50(13):7436-7450.
doi: 10.1093/nar/gkac555.

Determination of human DNA replication origin position and efficiency reveals principles of initiation zone organisation

Affiliations

Determination of human DNA replication origin position and efficiency reveals principles of initiation zone organisation

Guillaume Guilbaud et al. Nucleic Acids Res. .

Abstract

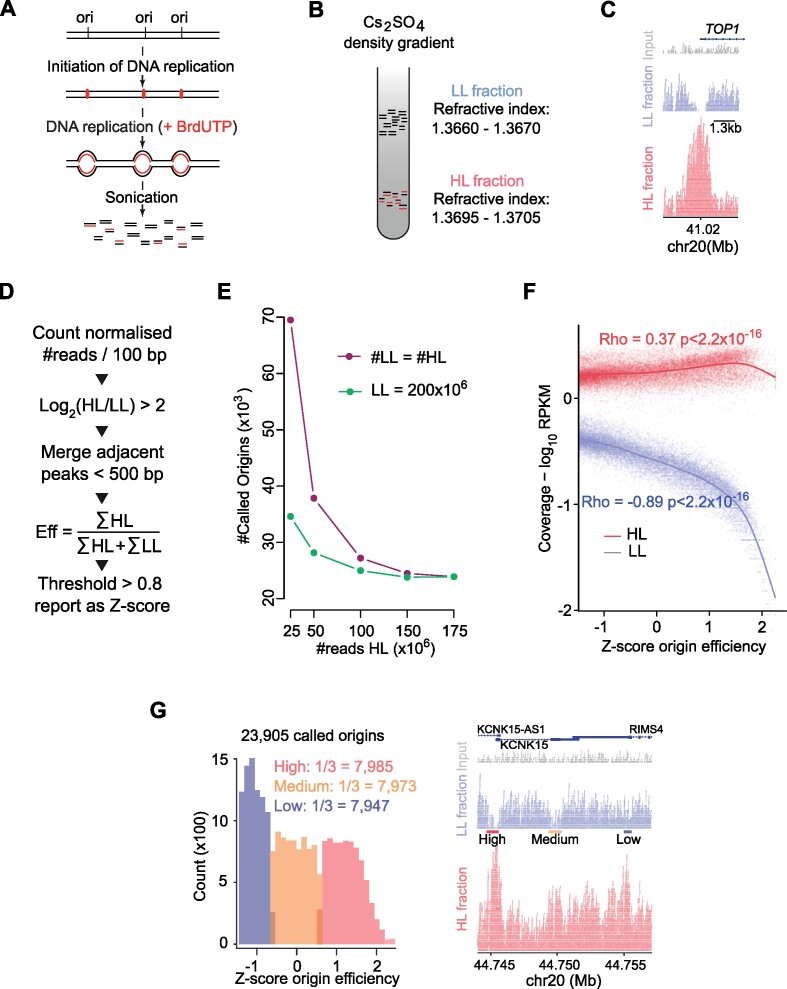
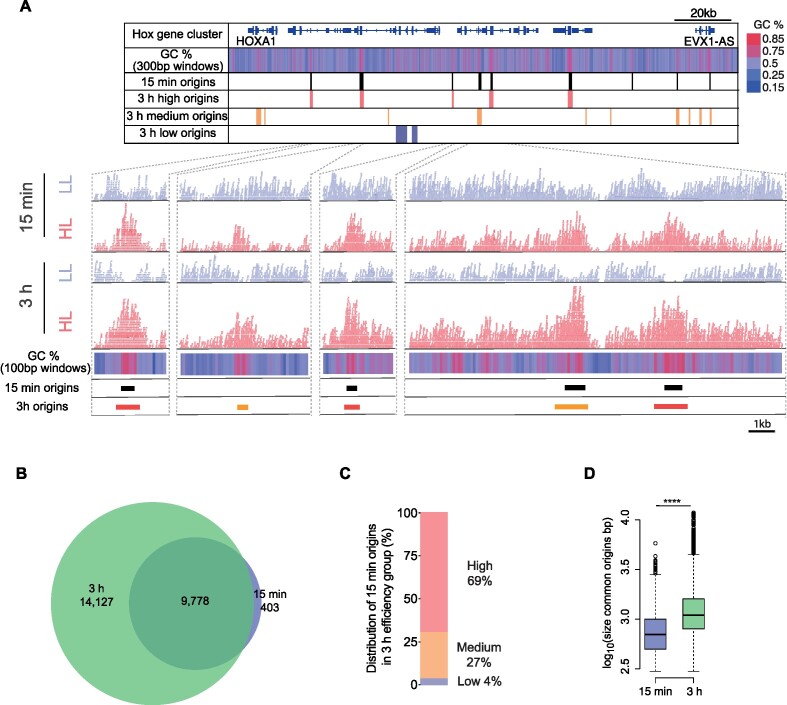
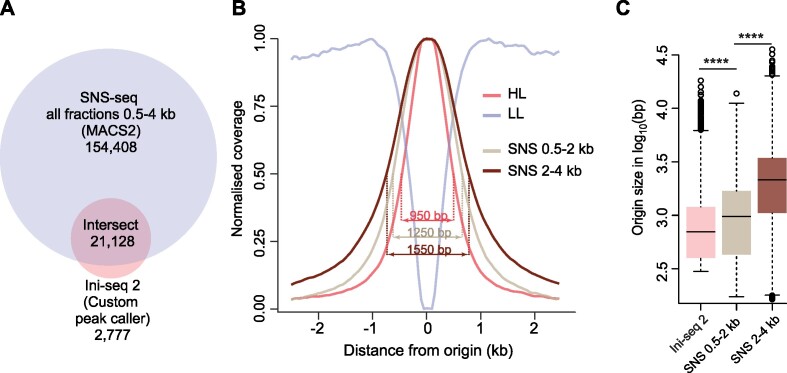
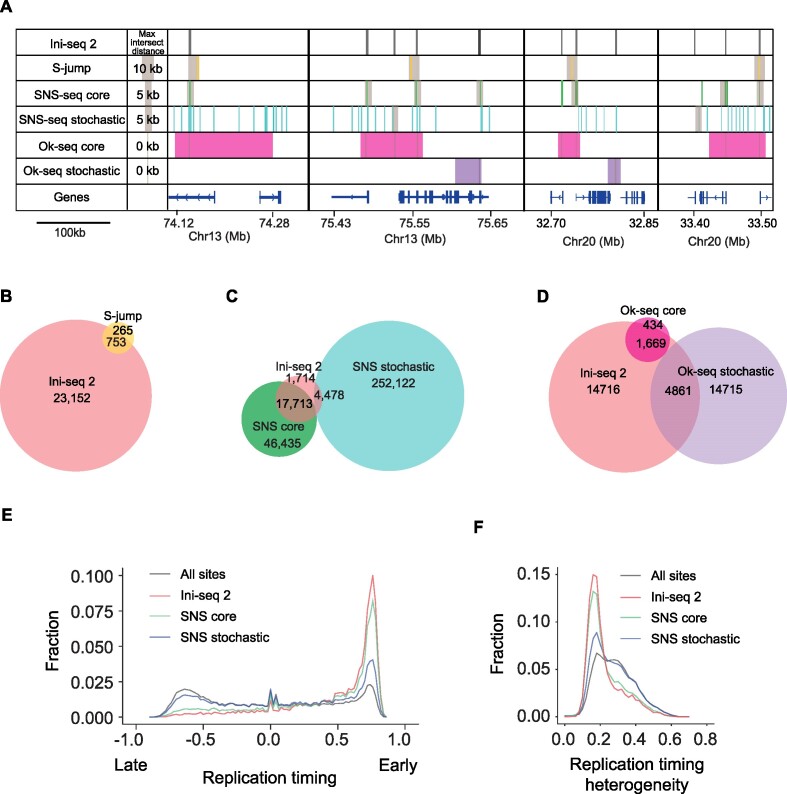
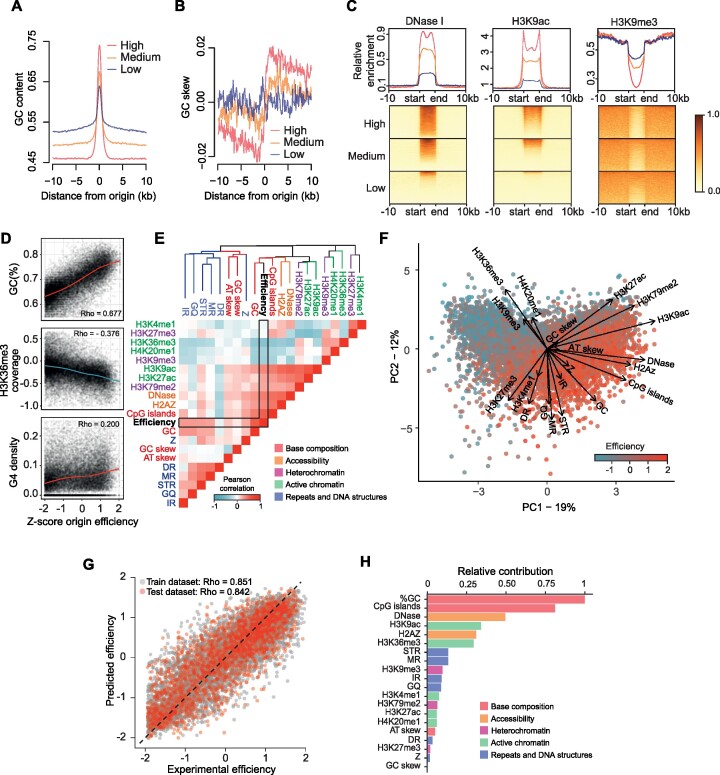
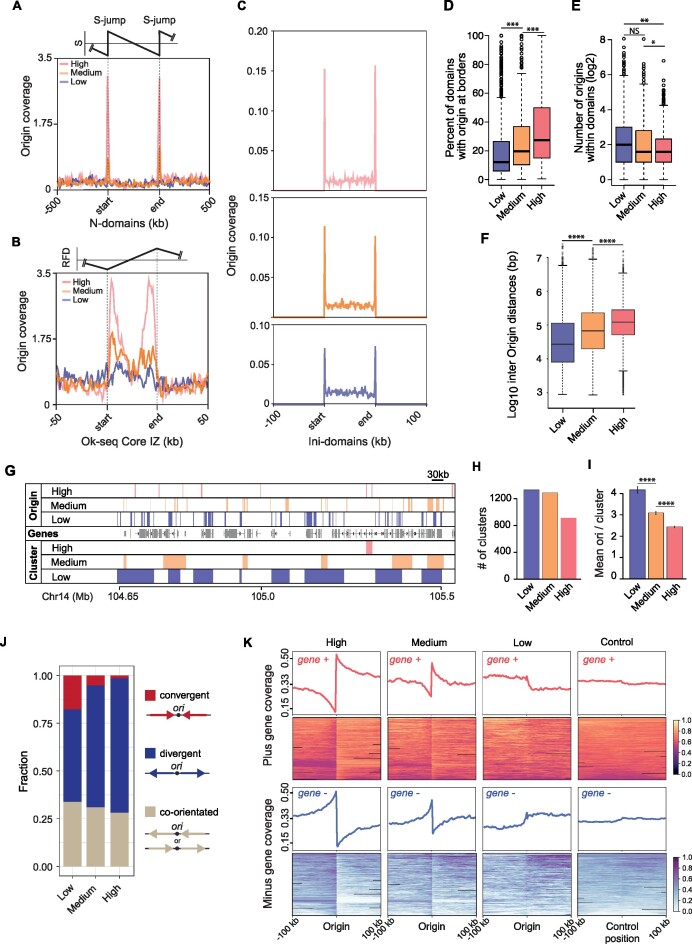
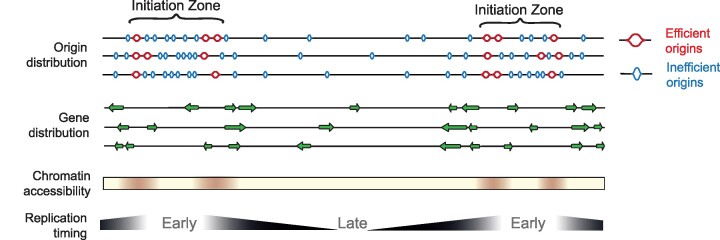
Replication of the human genome initiates within broad zones of ∼150 kb. The extent to which firing of individual DNA replication origins within initiation zones is spatially stochastic or localised at defined sites remains a matter of debate. A thorough characterisation of the dynamic activation of origins within initiation zones is hampered by the lack of a high-resolution map of both their position and efficiency. To address this shortcoming, we describe a modification of initiation site sequencing (ini-seq), based on density substitution. Newly replicated DNA is rendered 'heavy-light' (HL) by incorporation of BrdUTP while unreplicated DNA remains 'light-light' (LL). Replicated HL-DNA is separated from unreplicated LL-DNA by equilibrium density gradient centrifugation, then both fractions are subjected to massive parallel sequencing. This allows precise mapping of 23,905 replication origins simultaneously with an assignment of a replication initiation efficiency score to each. We show that origin firing within early initiation zones is not randomly distributed. Rather, origins are arranged hierarchically with a set of very highly efficient origins marking zone boundaries. We propose that these origins explain much of the early firing activity arising within initiation zones, helping to unify the concept of replication initiation zones with the identification of discrete replication origin sites.


Figures

Figure 1.
Figure 1.
Ini-seq 2: a method allowing fine mapping of replication origins and their efficiency. (A) Schematic representation of the ini-seq 2 workflow to label active DNA replication origins in nuclei from EJ30 cells by density substitution. (B) Separation of the newly synthesised (heavy/light, HL) and unreplicated (light/light, LL) DNA by equilibrium density centrifugation in caesium sulfate gradients. (C) An IGV screenshot demonstrating enrichment of HL reads (red) and depletion of LL reads (blue) reads at a well-studied origin near the TSS of the TOP1 gene. Total input DNA is represented in gray. (D) Diagrammatic representation of the custom algorithm developed to call ini-seq 2 replication origins. (E) Number of called origins as a function of the number of reads sequenced. Purple line: reads in HL = reads in LL; green line: a fixed number of LL reads (200 × 106) while the number of HL reads is varied. (F) Read coverage for each origin as a function of efficiency. Red = HL, blue = LL. Correlation: Pearson. (G) Classing of origin efficiencies. (Left) Distribution of origins by their efficiencies and binning of equal numbers into high, medium and low classes. (Right) IGV screenshot showing a genomic region containing examples of the three classes of origins. HL reads are shown in red; LL reads in blue and total input DNA reads in gray.
Figure 2.
Figure 2.
Time-dependent HL reads enrichment and LL reads depletion at origin sites. (A) Upper panel: Ini-seq 2 origins called in the Hox gene cluster on chromosome 7, at 15 minutes and 3 hours alongside GC content heatmap (blue gradient <50% GC; red gradient >50% GC; 300 bp windows). Lower panels: Example IGV screenshots of raw mapped reads from the HL (red) and the LL (blue) around the indicated called origins. Total mapped reads for each condition: 15 minutes LL: 173 × 106; HL: 115 × 106; 3 hours LL: 199 × 106; HL: 176 × 106. GC content heatmap computed for 100 bp windows. (B) Overlap of origins called by ini-seq 2 at 15 minutes and 3 hours. Permutation test P = 0.0001, Z-score 842. (C) Distribution of the 9,778 origins identified at 15 minutes that are also called at 3 hours by their class assigned (high, medium or low) at 3 hours. (D) Distribution of sizes of called origins. ****P < 2.2 × 10–16; K-S test.
Figure 3.
Figure 3.
Comparison of ini-seq 2 and SNS-seq in EJ30 cells. (A) Overlap of origins called by SNS-seq and ini-seq 2. SNS-seq was performed on two fractions, 0.5–2 and 2–4 kb, which were pooled. Permutation test P = 0.0001, Z-score: 538. (B) Read coverage around ini-seq 2 and SNS-seq origins. Width values are for the half height of each distribution. (C) Distribution of origin size defined by ini-seq 2 and SNS-seq. ****P < 2.2 × 10–16; K-S test.
Figure 4.
Figure 4.
Comparison of ini-seq 2 origins mapped in other cell lines. (A) Four representative genomic regions illustrating the position of origins identified by ini-seq 2 (black bars), S-jumps (yellow bars), SNS-seq core (green bars), SNS-seq stochastic (turquoise bars), Ok-seq core (magenta bars) and Ok-seq stochastic (purple bars). Gray boxes indicate the maximum distance that has been allowed to accept an intersect, computed based on the average size of the origins called by each method (see Materials and Methods). (BD) Venn diagrams showing the overlap between (B) ini-seq 2 origins and S-jumps, permutation test P = 0.0001, Z-score 58; (C) ini-seq 2 origins and SNS-seq, permutation test for core and stochastic, respectively, P = 0.0001, Z-score 379 and P = 0.0001, Z-score 217; (D) ini-seq 2 origins and Ok-seq, permutation test for core and stochastic, respectively, P = 0.0001, Z-score 89 and P = 0.0001, Z-score 61. (E) Distribution of origins determined by ini-seq 2 and SNS-seq as a function of replication timing. (F) Distribution of origins determined by ini-seq 2 and SNS-seq as a function of replication timing heterogeneity observed across nine cell lines (see Materials and Methods).
Figure 5.
Figure 5.
Determinants of origin efficiency. (A) GC content in a 20 kb window around origin centres for the three efficiency classes of ini-seq 2 origins. (B) GC skew (G – C / G + C) computed in 100 bp bins in a 20 kb window around the origin center for the three efficiency classes of ini-seq 2 origins. (C) Coverage plots for DNase I hypersensitivity, H3K9 acetylation and H3K9 trimethylation within and 10 kb around the three efficiency classes of ini-seq 2 origins. Origin lengths were scaled and are defined by ‘start’ and ‘end’ labels. (D) GC content, H3K36 trimethylation and G4 density as a function of origin efficiency. Correlation: Pearson. (E) Heatmap reporting the correlation between pairwise combinations of origin features. Blue = negative Pearson correlations; Red = positive Pearson correlations. The dendrogram is generated using an unsupervised clustering algorithm based on distances computed from Pearson correlations (see Materials and Methods). The colors of the branches denote the five types of origin features. Abbreviations: IR, inverted repeat; GQ, G quadruplex; STR, short tandem repeat; MR, mirror repeat; DR, direct repeat; Z, Z-DNA. (F) Principal component analysis of origin efficiency using features described in panel (E), highlighting the strength and direction, i.e. eigenvectors, for the contribution of each feature to origin efficiency. (G) A statistical model allows prediction of origin efficiency using these features as predictors. Origins used to train and test the model are depicted in gray and red, respectively. (H) Quantitative estimate of predictor contribution to the statistical model. The colors of the bars denote the five types of origin features.
Figure 6.
Figure 6.
The higher-order organisation of replication origins by efficiency. (A) Origin coverage grouped by efficiency in normalised N-domains ± 500 kb. (B) Origin coverage grouped by efficiency in Ok-seq core initiation zones ± 50 kb. (C) Origin coverage grouped by efficiency in ini-domains ± 100 kb. (D) Percentage of ini-domains with origins of each efficiency class at their boundaries. ***P < 1 × 10–7; K-S test. (E) Number of origins of each efficiency class within the ini-domains (borders analysed in D were excluded). **P < 1 × 10–5; *P < 1 × 10–3; K-S test. (F) Inter-origin distances grouped by origin efficiency class. Central bar = median; whiskers = interquartile range. ****P < 2.2 × 10–16; K-S test. (G) Origin clustering. Example IGV screenshot showing the clustering of ini-seq 2 origins by efficiency in a ∼ 1 Mb region of chromosome 14. Top three lanes: mapping of the three efficiency classes of ini-seq 2 origins. Middle lane: genes. Lower three lanes: Origin clusters determined using the clusterdist function of clusterscan (33), set at 30 kb (see Materials and Methods). (H) Number of clusters found in each ini-seq 2 origin efficiency class. (I) Mean number of origins per cluster for each efficiency class (****P < 5 × 10–12 for low versus medium; P < 7 × 10–15 for medium versus high. (J) Quantification of the orientation of the first gene either side of an origin, grouped by origin efficiency class. Gene orientation of the two adjacent genes is classed by the direction of transcription as convergent, divergent or co-orientated. (K) Gene orientation coverage around the three classes of ini-seq 2 origins and a randomised control compared with 8,000 randomly picked positions from a pool of genomic locations that are equidistant from two origins.
Figure 7.
Figure 7.
Model for the organisation of replication initiation zones in the human genome. Ini-seq 2 origins define early replicating regions of the genome with an ‘open’ chromatin structure. The borders of initiation zones are defined by the most efficient origins and local gene organisation that will minimise head-on transcription,i.e. the core of the initiation zone is depleted in genes but enriched at the boundary with genes co-orientated with the direction of leading strand replication.

Similar articles

Cited by

References

    1. Ganier O., Prorok P., Akerman I., Méchali M. Metazoan DNA replication origins. Curr. Opin. Cell Biol. 2019; 58:134–141. - PubMed
    1. Hyrien O. Peaks cloaked in the mist: the landscape of mammalian replication origins. J. Cell Biol. 2015; 208:147–160. - PMC - PubMed
    1. Hamlin J.L., Mesner L.D., Dijkwel P.A. A winding road to origin discovery. Chromosome Res. 2010; 18:45–61. - PMC - PubMed
    1. Huberman J.A., Riggs A.D. On the mechanism of DNA replication in mammalian chromosomes. J. Mol. Biol. 1968; 32:327–341. - PubMed
    1. Heintz N.H., Hamlin J.L. An amplified chromosomal sequence that includes the gene for dihydrofolate reductase initiates replication within specific restriction fragments. Proc. Natl. Acad. Sci. U.S.A. 1982; 79:4083–4087. - PMC - PubMed

Publication types