

Identification of nucleobase chemical modifications that reduce the hepatotoxicity of gapmer antisense oligonucleotides
- PMID: 35801870
- PMCID: PMC9303313
- DOI: 10.1093/nar/gkac562
Identification of nucleobase chemical modifications that reduce the hepatotoxicity of gapmer antisense oligonucleotides
Abstract
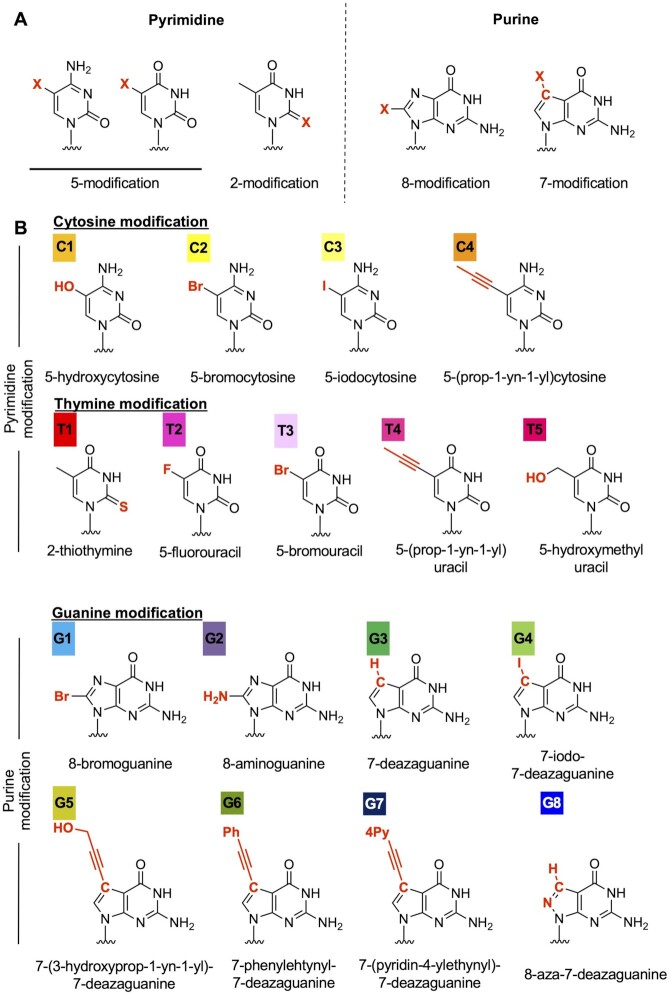
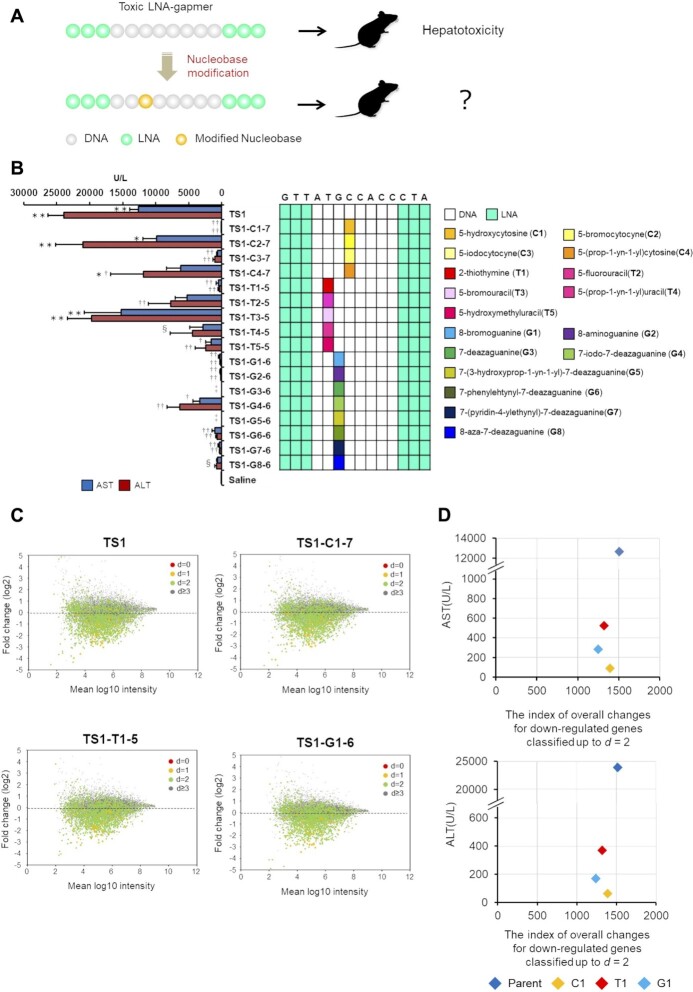
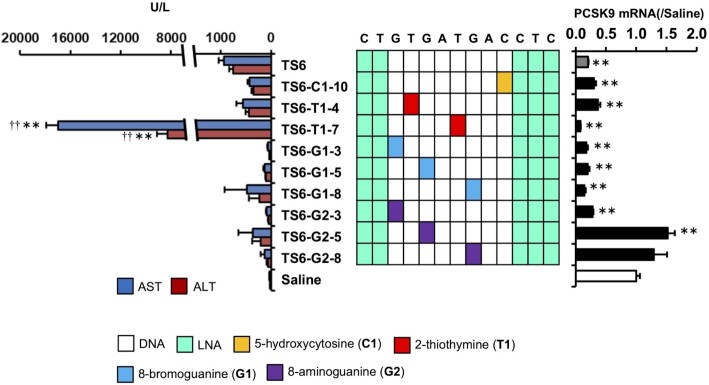
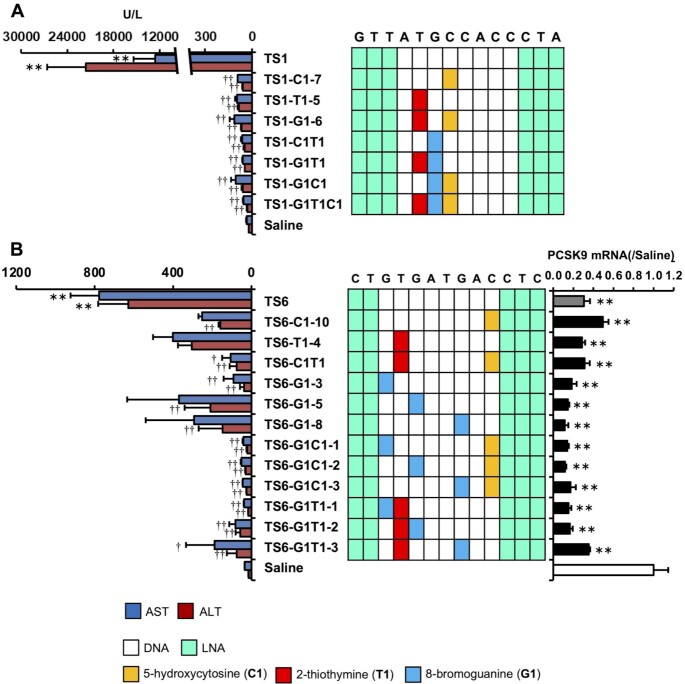
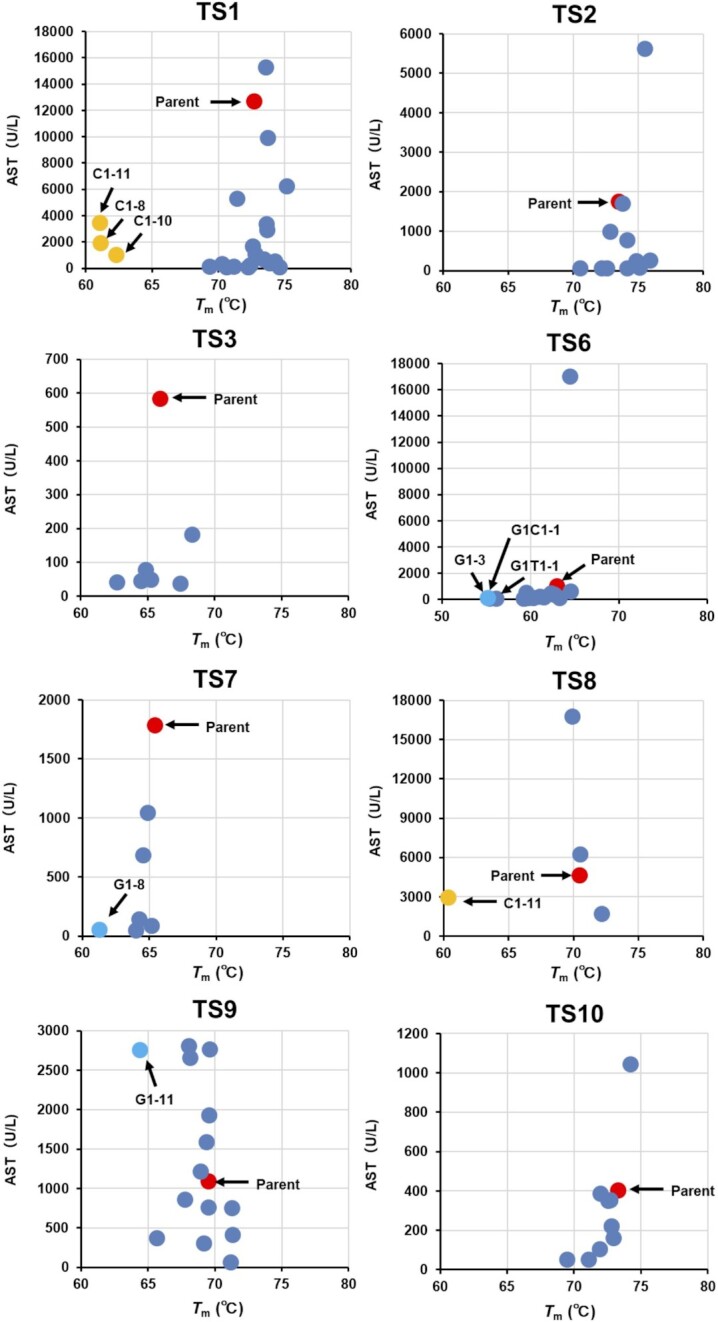
Currently, gapmer antisense oligonucleotide (ASO) therapeutics are under clinical development for the treatment of various diseases, including previously intractable human disorders; however, they have the potential to induce hepatotoxicity. Although several groups have reported the reduced hepatotoxicity of gapmer ASOs following chemical modifications of sugar residues or internucleotide linkages, only few studies have described nucleobase modifications to reduce hepatotoxicity. In this study, we introduced single or multiple combinations of 17 nucleobase derivatives, including four novel derivatives, into hepatotoxic locked nucleic acid gapmer ASOs and examined their effects on hepatotoxicity. The results demonstrated successful identification of chemical modifications that strongly reduced the hepatotoxicity of gapmer ASOs. This approach expands the ability to design gapmer ASOs with optimal therapeutic profiles.
© The Author(s) 2022. Published by Oxford University Press on behalf of Nucleic Acids Research.
Figures
Similar articles
-
Ribonuclease H1-dependent hepatotoxicity caused by locked nucleic acid-modified gapmer antisense oligonucleotides.Sci Rep. 2016 Jul 27;6:30377. doi: 10.1038/srep30377. Sci Rep. 2016. PMID: 27461380 Free PMC article.
-
RNA Reduction and Hepatotoxic Potential Caused by Non-Gapmer Antisense Oligonucleotides.Nucleic Acid Ther. 2019 Feb;29(1):44-50. doi: 10.1089/nat.2018.0741. Epub 2018 Dec 1. Nucleic Acid Ther. 2019. PMID: 30508397
-
Antisense oligonucleotides containing locked nucleic acid improve potency but cause significant hepatotoxicity in animals.Nucleic Acids Res. 2007;35(2):687-700. doi: 10.1093/nar/gkl1071. Epub 2006 Dec 19. Nucleic Acids Res. 2007. PMID: 17182632 Free PMC article.
-
Cationic oligonucleotide derivatives and conjugates: A favorable approach for enhanced DNA and RNA targeting oligonucleotides.Beilstein J Org Chem. 2021 Jul 29;17:1828-1848. doi: 10.3762/bjoc.17.125. eCollection 2021. Beilstein J Org Chem. 2021. PMID: 34386102 Free PMC article. Review.
-
An overview of sugar-modified oligonucleotides for antisense therapeutics.Chem Biodivers. 2011 Sep;8(9):1616-41. doi: 10.1002/cbdv.201100081. Chem Biodivers. 2011. PMID: 21922654 Review.
Cited by
-
Nucleic acid drugs: recent progress and future perspectives.Signal Transduct Target Ther. 2024 Nov 29;9(1):316. doi: 10.1038/s41392-024-02035-4. Signal Transduct Target Ther. 2024. PMID: 39609384 Free PMC article. Review.
-
Enhancing RNA inhibitory activity using clamp-G-modified nucleobases.Cell Rep Phys Sci. 2024 Aug 21;5(8):102120. doi: 10.1016/j.xcrp.2024.102120. Epub 2024 Jul 29. Cell Rep Phys Sci. 2024. PMID: 39421604 Free PMC article.
-
Amplifying gene expression with RNA-targeted therapeutics.Nat Rev Drug Discov. 2023 Jul;22(7):539-561. doi: 10.1038/s41573-023-00704-7. Epub 2023 May 30. Nat Rev Drug Discov. 2023. PMID: 37253858 Free PMC article. Review.
-
Targeting FMN, TPP, SAM-I, and glmS Riboswitches with Chimeric Antisense Oligonucleotides for Completely Rational Antibacterial Drug Development.Antibiotics (Basel). 2023 Nov 8;12(11):1607. doi: 10.3390/antibiotics12111607. Antibiotics (Basel). 2023. PMID: 37998809 Free PMC article. Review.
-
Advances and prospects of RNA delivery nanoplatforms for cancer therapy.Acta Pharm Sin B. 2025 Jan;15(1):52-96. doi: 10.1016/j.apsb.2024.09.009. Epub 2024 Sep 14. Acta Pharm Sin B. 2025. PMID: 40041887 Free PMC article. Review.
References
-
- Hair P., Cameron F., McKeage K.. Mipomersen sodium: first global approval. Drugs. 2013; 73:487–493. - PubMed
-
- Keam S.J. Inotersen: first global approval. Drugs. 2018; 78:1371–1376. - PubMed
-
- Paik J., Duggan S.. Volanesorsen: first global approval. Drugs. 2019; 79:1349–1354. - PubMed
-
- Wan W., Seth P.. The medicinal chemistry of therapeutic oligonucleotides. J. Med. Chem. 2016; 59:9645–9667. - PubMed
Publication types
MeSH terms
Substances
LinkOut - more resources
Full Text Sources
Medical
Molecular Biology Databases
