. 2022 Oct 28;50(19):10896-10913.
doi: 10.1093/nar/gkac594.

NAT10-mediated N4-acetylcytidine modification is required for meiosis entry and progression in male germ cells

Affiliations

NAT10-mediated N4-acetylcytidine modification is required for meiosis entry and progression in male germ cells

Lu Chen et al. Nucleic Acids Res. .

Abstract

Post-transcriptional RNA modifications critically regulate various biological processes. N4-acetylcytidine (ac4C) is an epi-transcriptome, which is highly conserved in all species. However, the in vivo physiological functions and regulatory mechanisms of ac4C remain poorly understood, particularly in mammals. In this study, we demonstrate that the only known ac4C writer, N-acetyltransferase 10 (NAT10), plays an essential role in male reproduction. We identified the occurrence of ac4C in the mRNAs of mouse tissues and showed that ac4C undergoes dynamic changes during spermatogenesis. Germ cell-specific ablation of Nat10 severely inhibits meiotic entry and leads to defects in homologous chromosome synapsis, meiotic recombination and repair of DNA double-strand breaks during meiosis. Transcriptomic profiling revealed dysregulation of functional genes in meiotic prophase I after Nat10 deletion. These findings highlight the crucial physiological functions of ac4C modifications in male spermatogenesis and expand our understanding of its role in the regulation of specific physiological processes in vivo.


Figures

Figure 1.
Figure 1.
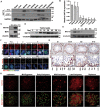
The expression of the ac4C writer NAT10 in multiple tissues and male germ cells. (A) Western blot analysis of NAT10 protein levels using anti-NAT10 and anti-GAPDH antibodies in the tissue lysates from 6-week-old WT mice. (B) Quantification of the relative expression levels of NAT10 in (A) using the ImageJ software. The relative expression level of the NAT10 protein was calculated by quantifying the gray value of NAT10/GAPDH for each sample. (C) Western blot analysis of NAT10 levels in the fraction of germ cells (GCs) and somatic cells (SCs) enriched from 6-week-old testes using a two-step enzymatic digestion process followed by a differential adhesion method. The GC marker MVH was used as an indicator of enrichment efficiency, and β-actin was used as the loading control. (D) Western blot analysis of NAT10 protein levels in mouse testes on different days postpartum (dpp) during the first wave of spermatogenesis. (E) Western blotting for NAT10 in spermatogenic cells isolated from adult WT mice using flow cytometry sorting (FACS) (L, leptotene; Z, zygotene; P, pachytene; D, diplotene; MII, metaphase II; RS, round spermatids). (F) Paraffin sections of WT adult testes were co-stained with rabbit anti-NAT10 and mouse anti-SYCP3 antibodies. The DNA was stained with DAPI (Spg, spermatogonia; PreL, pre-leptotene; L, leptotene; Z, zygotene; P, pachytene; D, diplotene spermatocytes; RS, round spermatids; ES, elongating spermatids). Scale bar = 5 μm. (G) Immunohistochemical staining of NAT10 in WT mouse testes (Spg, spermatogonia; Lep, leptotene; Zyg, zygotene; Pac, pachytene; Met, metaphase II; RS, round spermatid; EES, early elongating spermatids; LES, late elongating spermatids; Ser, Sertoli cells). Scale bar = 50 μm. (H) Localization of NAT10 (red) in spermatocytes at different stages of spermatogenesis in WT mice shown by nuclear spreading immunostaining. The meiotic stages of spermatocytes were determined by SYCP3 staining (green) of the chromosomal axis. Scale bar = 10 μm.
Figure 2.
Figure 2.
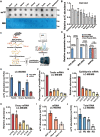
Dynamic ac4C modifications in tissues and mouse spermatogenesis. (A) Dot blot analysis of ac4C levels using the anti-ac4C antibody on total RNA from tissues of 6-week-old WT mice. Methylene blue staining was used as the internal standard. (B) Quantification of relative ac4C modification abundance in different samples using the ImageJ software; ac4C abundance was calculated by quantifying the gray value of ac4C/MB for each sample. Plots indicate the number of repetitions. (C) Schematic diagram of the HPLC-MS/MS experiment. (D) RT-qPCR detection of 18S and 28S rRNA expression to verify mRNA purity. Data are presented as the mean ± SEM; ****P < 0.0001. (E) LC-MS/MS detection of ac4C levels (ac4C/C) in total RNA and mRNA from WT adult testes, ovaries and epididymis. Data are presented as mean ± SEM, n = 3. (F–H) LC-MS/MS experiment to detect the abundance of m6A/A, ac4C/C, m3C/C, m5C/C, m1A/A and hm5C/C in the testes (F), epididymis (G) and ovaries (H). Data are presented as mean ± SEM, n = 3. (I) LC-MS/MS detection of ac4C levels in mRNA of 293T, HeLa and male germ cells. Mean ± SEM, n = 3. (J) LC-MS/MS detection of ac4C modification in spermatocytes at four different stages of spermatogenesis: L, leptotene; Z, zygotene; P, pachytene; D, diplotene spermatocytes; MII, metaphase II spermatocytes; RS, round spermatids. Data are presented as mean ± SEM of three biological replicates.
Figure 3.
Figure 3.
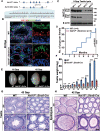
NAT10 is essential for mouse spermatogenesis and male fertility. (A) Schematic representation of the Nat10 conditional targeting construct. Detailed information on the NAT10 isoforms and genotyping results are shown in Supplementary Figure S4A and B. (B) Immunofluorescence staining of NAT10 in WT and Nat10-SKO mouse testes. SYCP3 was co-stained to indicate spermatocytes. Scale bar = 10 μm. (C) Western blot analysis of NAT10 protein levels in WT control and Nat10-SKO testes. β-Actin was used as the loading control. (D) Fertility tests of Nat10-SKO and age-matched control mice for 6 months. Cumulative number of pups per male mating with one female mouse. ****P < 0.0001 via two-tailed Student's t-test. (E) Representative image showing the morphology of testes derived from Nat10-SKO and WT control mice at 16 dpp (left) and 42 dpp (right). (F) Weight of testes derived from WT and Nat10-SKO mice at the indicated ages. Error bars indicate SEM. **P < 0.01, ***P < 0.001 and ****P < 0.0001 by two-tailed Student's t-test. n.s. means not significant. (G and H) Morphological analysis of the testes (G) and epididymis (H) from control and Nat10-SKO mice using HE staining. Scale bar = 50 μm.
Figure 4.
Figure 4.
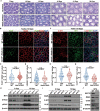
NAT10 is crucial for meiotic entry and spermatogonial differentiation. (A) HE staining of control and Nat10-SKO testes at the indicated ages. Scale bar = 50 μm. (B) Immunofluorescence co-staining for the undifferentiated spermatogonia marker PLZF (green) and Sertoli cell marker SOX9 (red) in the control and Nat10-SKO testes at 12 dpp. Scale bar = 50 μm. (C) Quantification of the ratio of PLZF-positive spermatogonia/SOX9-positive cells per tubule in histological sections of the control and Nat10-SKO 12 dpp testes. n.s. indicates not significant. (D and E) Quantification of the ratio of LIN28A-positive spermatogonia/SOX9-positive cells and GFRα1-positive spermatogonia/WT1-positive cells per tubule in histological sections of the control and Nat10-SKO 12 dpp testes relative to those shown in Supplementary Figure S6A and S6B. n.s. means not significant. (F and G) Immunostaining (F) and quantification (G) of c-KIT+ cells/WT1+ cells per tubule in sections from the 12 dpp control and Nat10-SKO mice. ****P < 0.0001 via two-tailed Student's t-test. (H) The expression levels of representative proteins in meiotic entry were significantly reduced after Nat10 deletion in 9 and 12 dpp testes. (I) Western blot detection of the levels of key proteins that function in spermatogonial differentiation in the 9 and 12 dpp testes. (J) Western blot detection of key protein levels in isolated SPG (spermatogonial cells).
Figure 5.
Figure 5.
NAT10 depletion causes defects in synapsis and meiotic recombination. (A) Co-immunofluorescence staining of HORMAD1 and SYCP3 on surface-spread spermatocytes from the control and Nat10-SKO mouse testes. Scale bar = 10 μm. (B) Representative SIM images from super-resolution microscopy of the immunostaining of spread pachytene spermatocytes with SYCP1 and SYCP3 in WT and Nat10-SKO mice. The enlarged images highlight the detailed structure of the lateral and central axes. Scale bar = 10 μm. (C and D) The number of crossovers marked by MLH1 foci was significantly reduced in Nat10-SKO pachytene spermatocytes compared with that in WT pachytene spermatocytes (C). Quantification of MLH1 foci in WT and Nat10-SKO spermatocytes at pachytene stage (D). ****P < 0.0001 by two-tailed Student's t-test. Scale bar = 10 μm. (E and F) Pachytene-stage spermatocytes co-stained for SYCP3 and MSH4, with magnified views enlarged on the right (E). Quantification of MSH4 foci on nuclear surface spreads of WT and Nat10-SKO spermatocytes at the pachytene stage (F). ****P < 0.0001 via two-tailed Student's t-test. (G and H) Immunostaining (G) and quantification (H) of TEX11 in WT and Nat10-SKO pachytene spermatocytes. ****P < 0.0001 via two-tailed Student's t-test. Scale bar = 10 μm. (I) Quantification of number of MZIP2 foci in late zygotene and pachytene spermatocytes relative to those in Supplementary Figure S7D. ****P < 0.0001.
Figure 6.
Figure 6.
NAT10 depletion causes defects in DSB repair. (A) Representative images of WT and Nat10-SKO spermatocytes at different stages of meiotic prophase immunostained for SYCP3 and γH2AX. ‘Not observed’ means that spermatocytes in the diplotene stage were not observed in nuclear spreading. Scale bars = 10 μm. (B and C) Chromosome spreads of spermatocytes (LZ, late zygotene; EP, early pachytene; MP, mid-pachytene) from the testes of WT and Nat10-SKO males immunostained for DMC1 and SYCP3. (B). Quantification of DMC1 foci number in the indicated spermatocytes. Error bars indicate SEM. **P < 0.01 and ****P < 0.0001 via two-tailed Student's t-test (C). (D) Quantification of RAD51 foci number in zygotene and pachytene spermatocytes relative to those in Supplementary Figure S7E. ****P < 0.0001. (E and F) RPA2 and SYCP3 were detected in the nuclear surface spreads of WT and Nat10-SKO spermatocytes (E). Quantification of RPA2 foci numbers in the indicated spermatocytes. **P < 0.01 and ****P < 0.0001 via a two-tailed Student's t-test (F).
Figure 7.
Figure 7.
Loss of NAT10 causes transcriptional dysregulation. (A–C) Volcano plots show the number of significantly differentially expressed genes (DEGs) in spermatogonia (A), pre-leptotene (B) and leptotene/zygotene (L/Z) (C) that were isolated with FACS from WT and Nat10-SKO testes. Up-regulated and down-regulated genes are highlighted by red and blue dots, respectively. Those that are not DEGs are represented as dark gray dots. P threshold ( = 0.05) and log2FC threshold ( = ±1) are reported in gray horizontal and vertical dashed lines, respectively. n, gene number; FC, fold change. (D) PCA results of spermatogonia and pre-leptotene and leptotene/zygotene (L/Z) in WT and Nat10-SKO mice. Each symbol represents an RNA-seq sample, and WT and Nat10-SKO samples are shown in blue and red, respectively. Sample groups with similar gene expression profiles were clustered with the indicated colors. The proportions of variation in PCA1 and PCA2 were 86.75% and 7.93%, respectively. (E) GO enrichment analysis of biological processes (BP) indicates the potential functions of the down-regulated transcripts in the leptotene/zygotene stage derived from Nat10-SKO and WT mice (adjusted P < 0.05, FC > 2). (F) GO analysis indicates the potential functions of transcripts up-regulated by > 2-fold in leptotene/zygotene (adjusted P < 0.05, FC > 2). (G) Sankey diagram showing the expression pattern of transcripts at the pre-leptotene and leptotene/zygotene stages between WT and Nat10-SKO mice. Each rectangle represents a gene category. (H) Heatmap for four major functional categories of selected key genes showing distinct expression characteristics between pre-leptotene and leptotene/zygotene cells of WT and Nat10-SKO mice. The color key from red to blue indicates the relative gene expression levels from high to low.
Figure 8.
Figure 8.
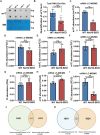
NAT10 depletion reduces ac4C abundance and results in dysregulation of functional genes in spermatogenesis. (A) Dot blotting of ac4C modification in WT and Nat10-SKO 12 dpp mice testes. Methylene blue staining was used as the total RNA loading control. (B) Quantification of ac4C modifications in total RNA from the control testes or Nat10-SKO testes relative to (A). The experiments were repeated three times. Mean ± SEM. **P < 0.01 via two-tailed Student's t-test. (C) ac4C detection in WT and Nat10-SKO testicular mRNA using LC-MS/MS. Mean ± SEM. The three biological replicates are represented by dots. Mean ± SEM. **P < 0.01. (D–I) LC-MS/MS detected the relative m5C/C, hm5C/C, m3C/C, ψ/U, m6A/A and f5C/C abundance in purified mRNA from WT and Nat10-SKO testes. Each dot represents a biological replicate. n = 3. Error bars indicate SEM. **P < 0.01 by two-tailed Student's t-test. n.s. means not significant. (J) Venn plot showing the overlap of down-regulated transcripts in Nat10-SKO leptotene/zygotene (L/Z) cells and genes with ac4C peaks, as previously published (23) (GSE102113). (K) Venn diagrams showing the overlap of up-regulated genes in Nat10-SKO leptotene/zygotene (L/Z) cells and genes with ac4C peaks, as previously published (GEO: GSE102113).

Similar articles

Cited by

References

    1. Anreiter I., Mir Q., Simpson J.T., Janga S.C., Soller M.. New twists in detecting mRNA modification dynamics. Trends Biotechnol. 2021; 39:72–89. - PMC - PubMed
    1. Boccaletto P., Bagiński B.. MODOMICS: an operational guide to the use of the RNA modification pathways database. Methods Mol. Biol. 2021; 2284:481–505. - PubMed
    1. Wiener D., Schwartz S.. The epitranscriptome beyond m(6)A. Nat. Rev. Genet. 2021; 22:119–131. - PubMed
    1. Roundtree I.A., Evans M.E., Pan T., He C.. Dynamic RNA modifications in gene expression regulation. Cell. 2017; 169:1187–1200. - PMC - PubMed
    1. Frye M., Harada B.T., Behm M., He C.. RNA modifications modulate gene expression during development. Science. 2018; 361:1346–1349. - PMC - PubMed

Publication types